Cost Management
The sidebar's Cost section groups six FinOps surfaces: the live cost dashboard, token usage telemetry, model pricing, budget caps, chargeback reports, and compliance reports.
Cost dashboard
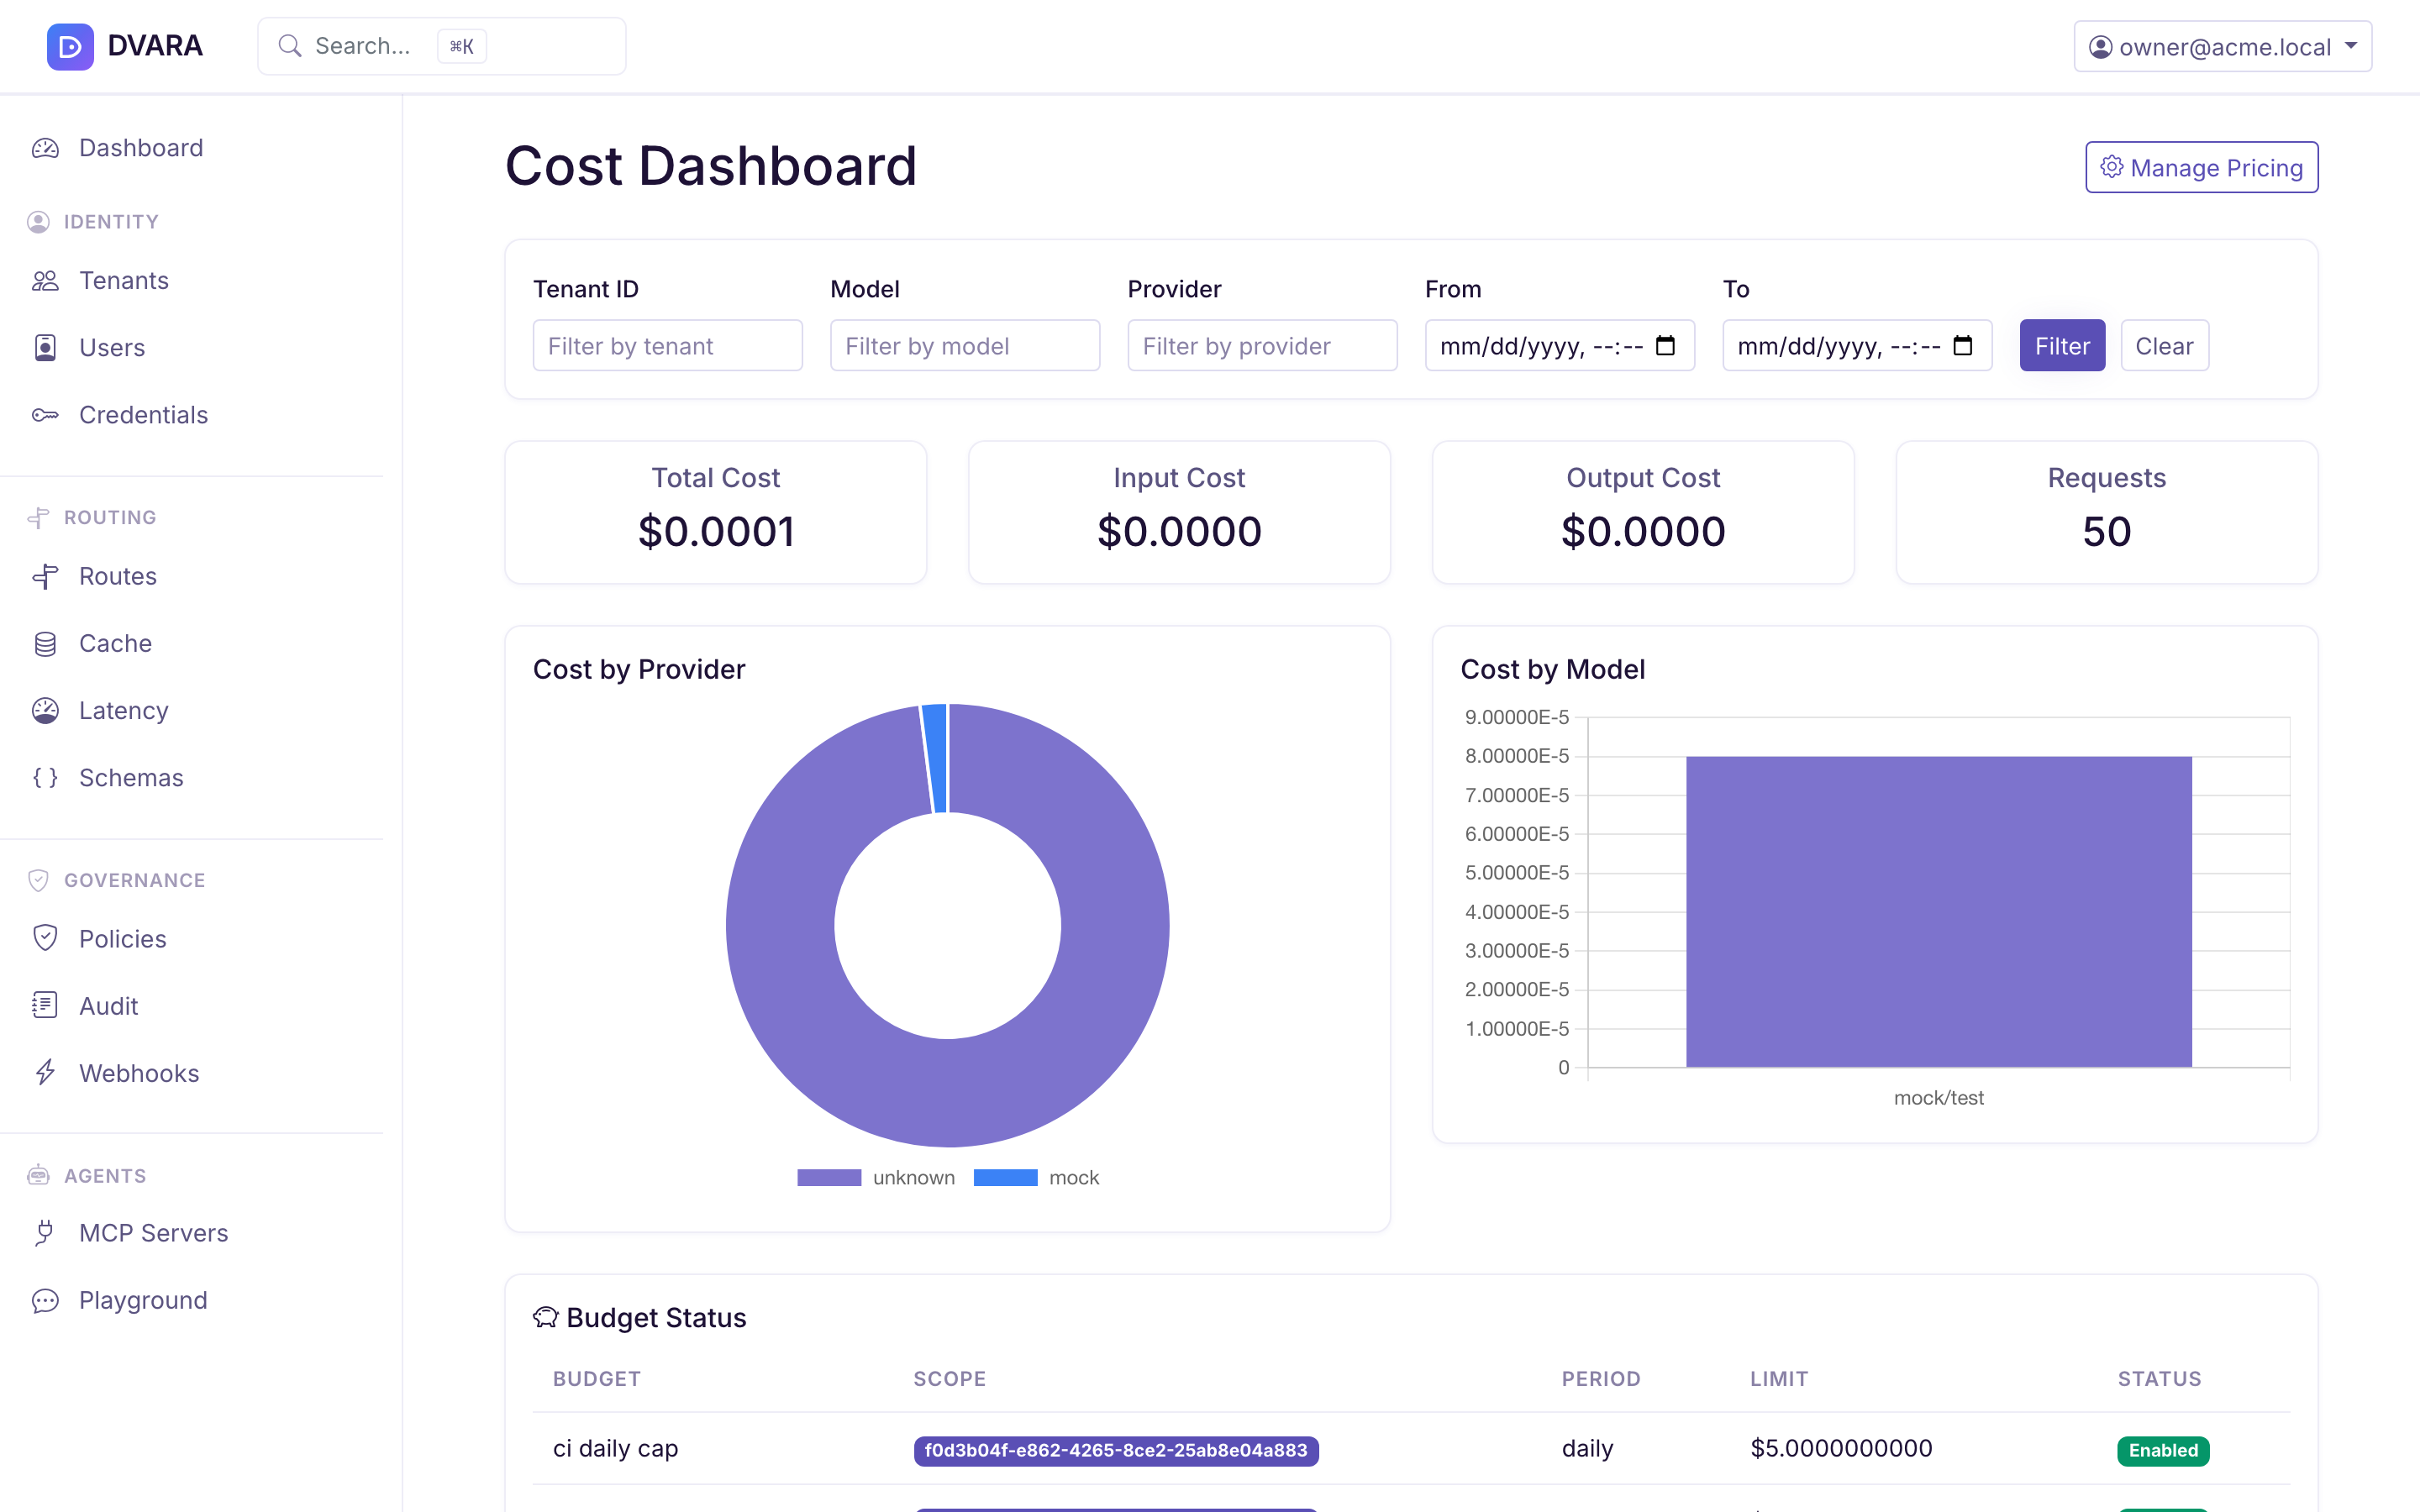
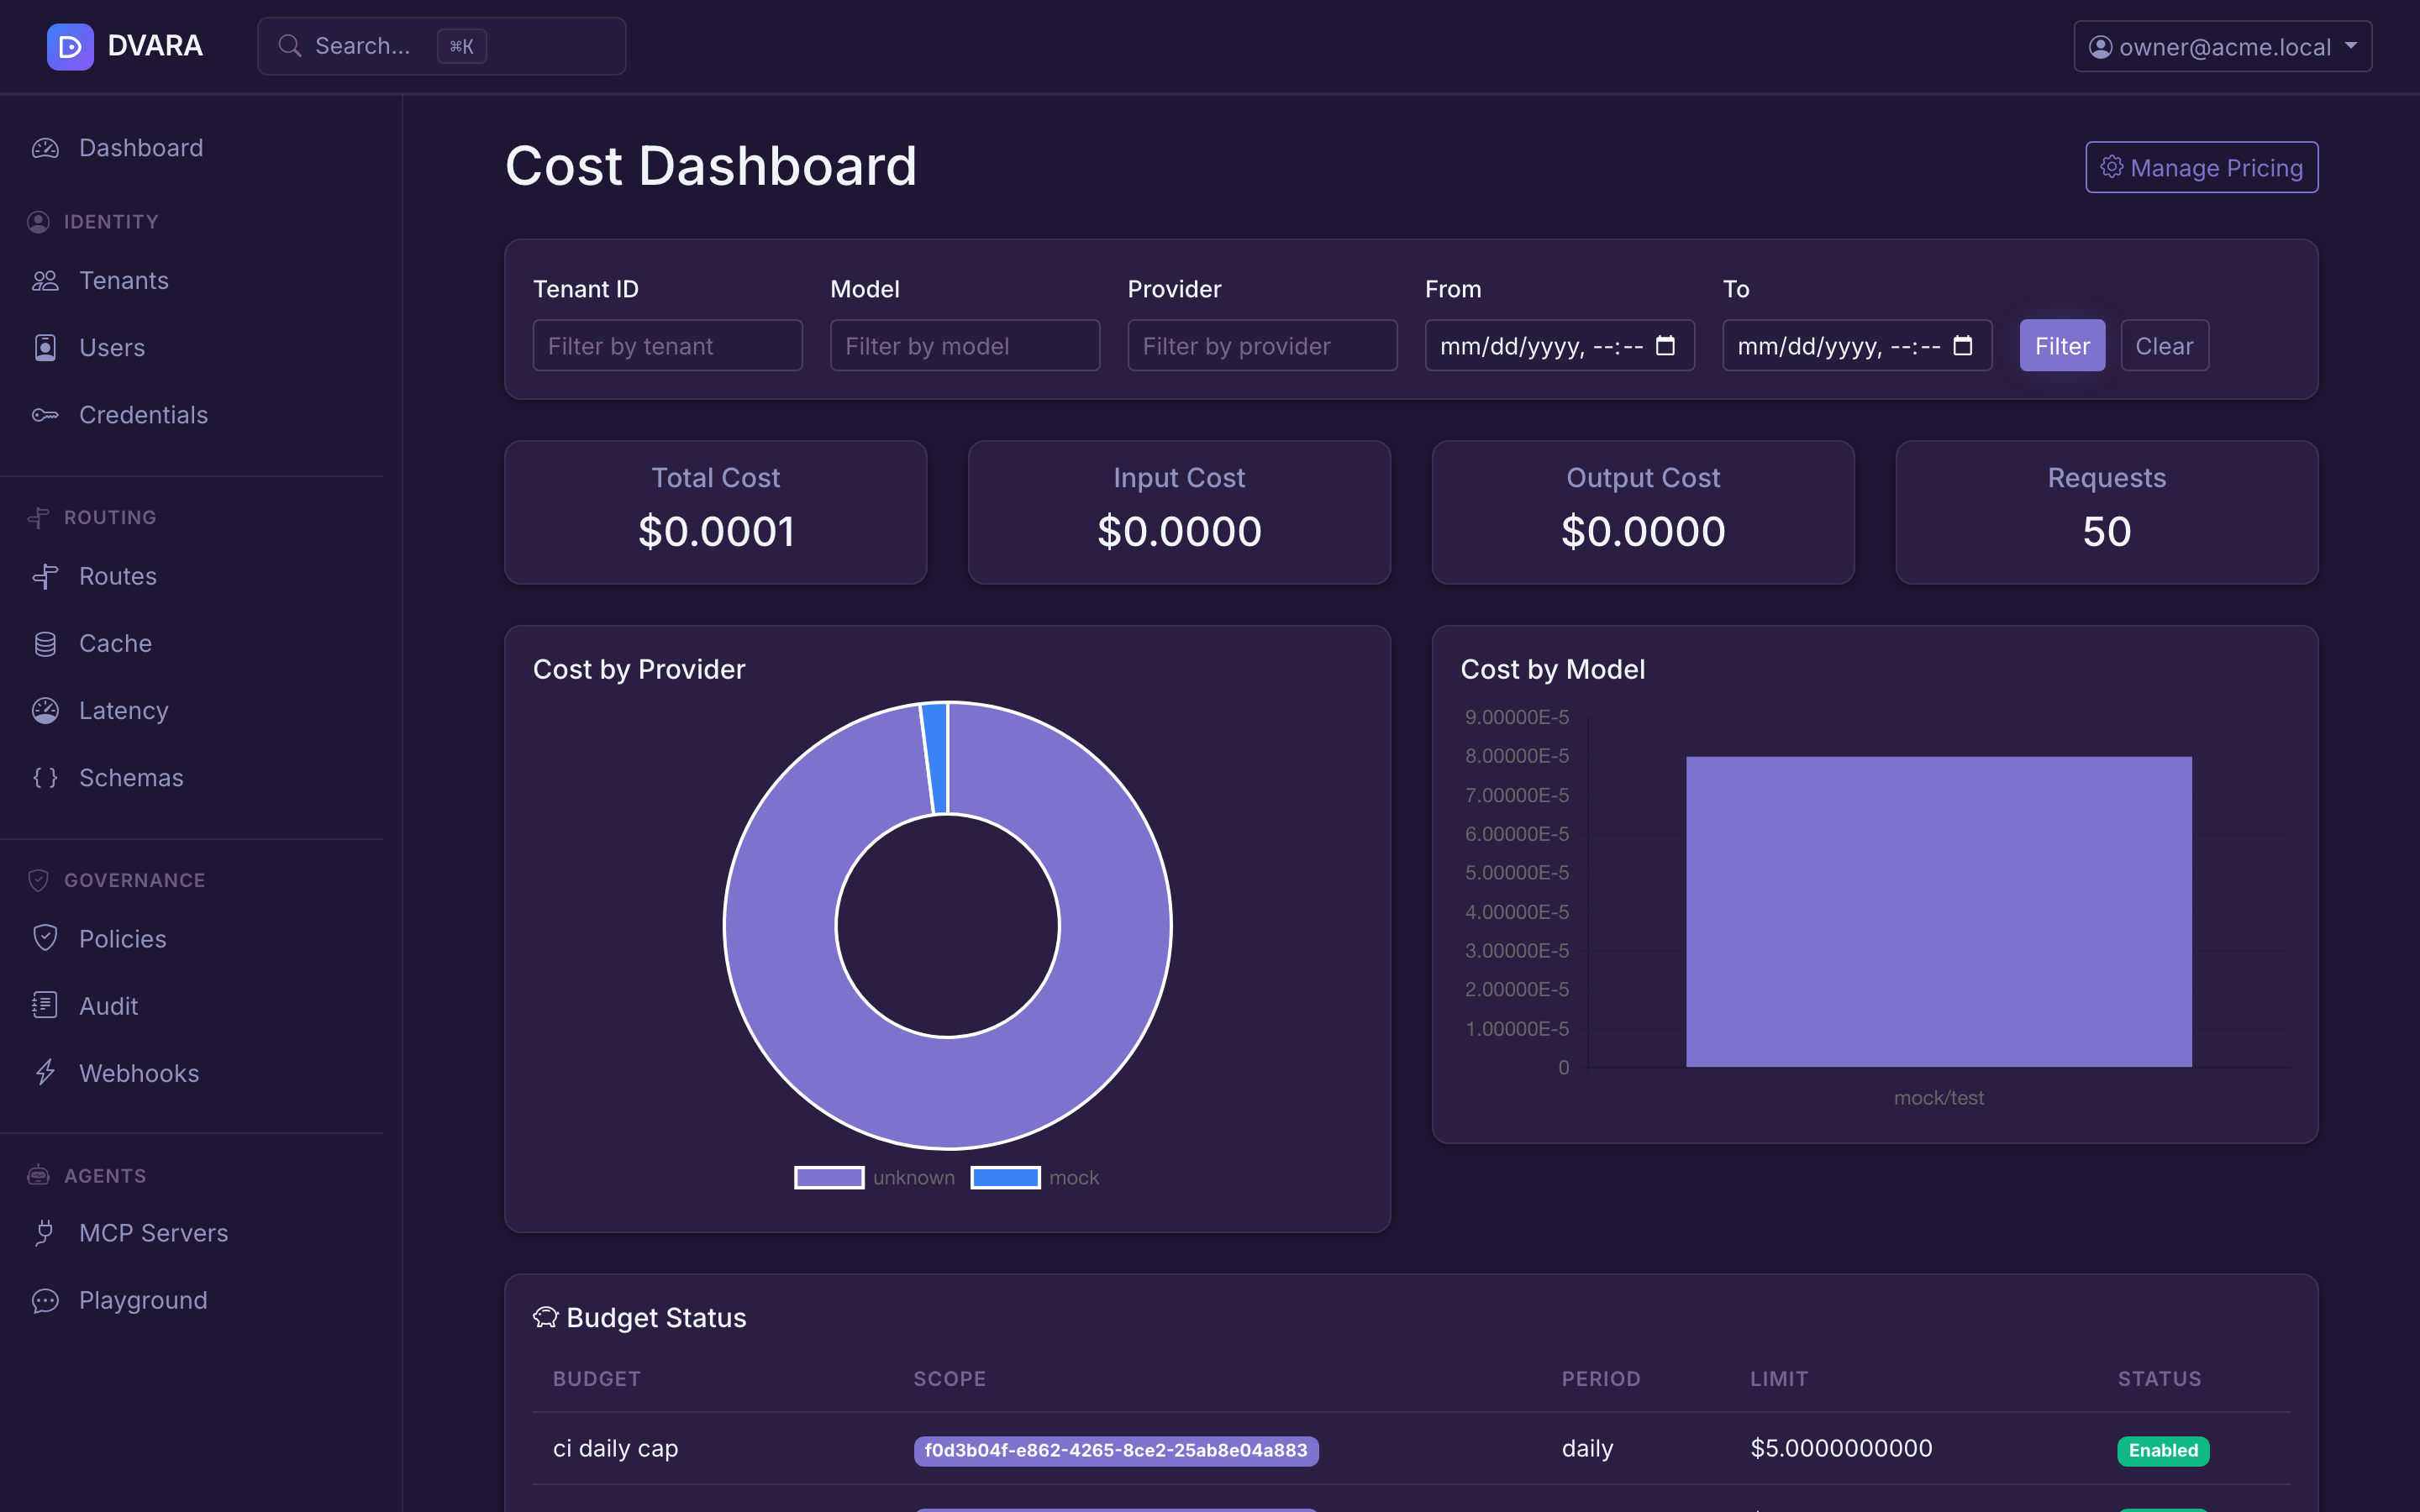
Open Cost → Cost Dashboard in the sidebar.
Cost records
A table of cost records with tenant, API key, model, provider, input / output tokens, input / output cost, total cost, and timestamp. Auto-refreshes every 5 seconds.
Filters: narrow by tenant, model, provider, and date range.
Summary cards
Aggregated totals at the top of the page: total cost, total requests, total input tokens, total output tokens.
Charts
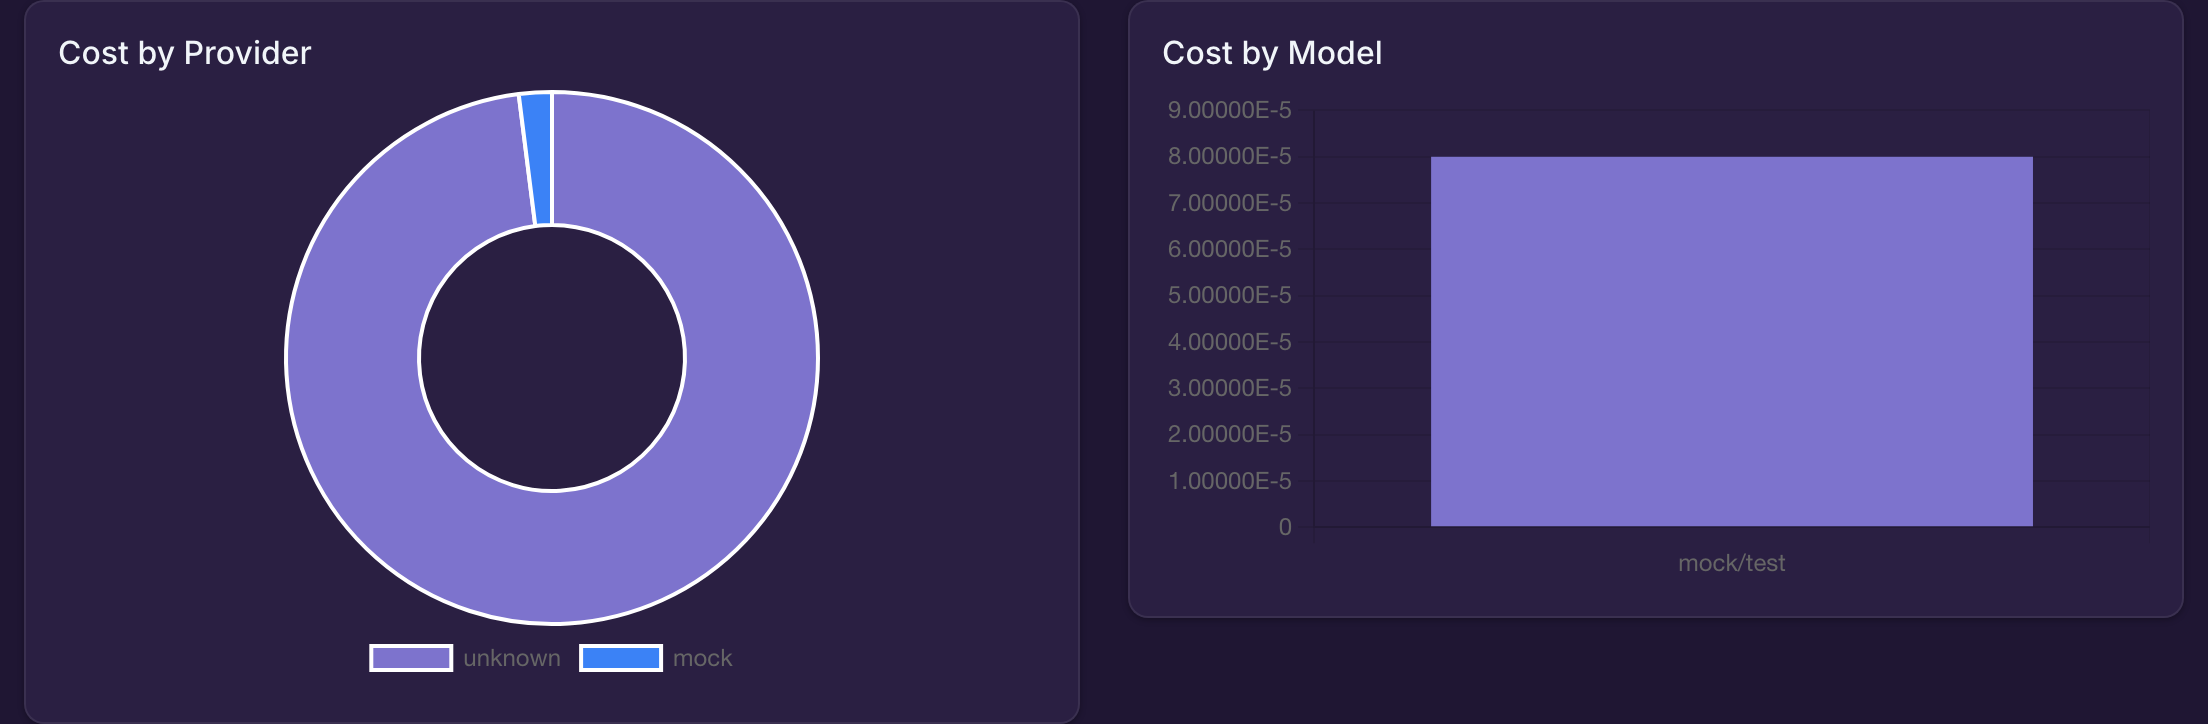
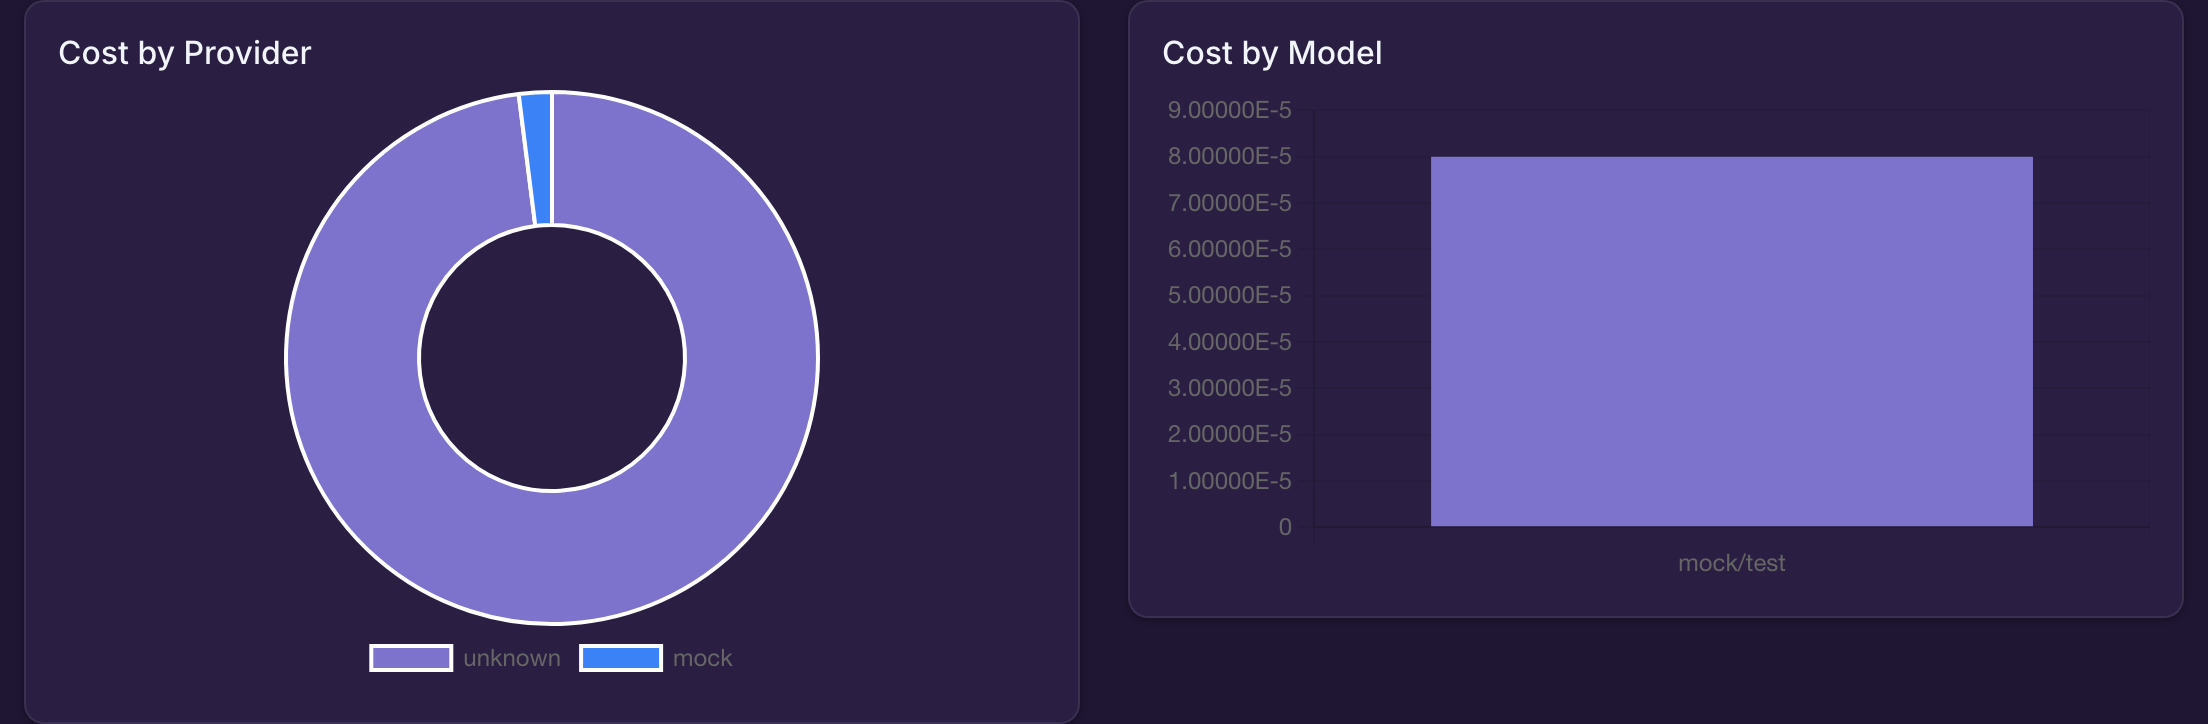
Two interactive visualizations:
- Cost by Provider — donut chart breaking down total spend by provider
- Cost by Model — horizontal bar chart showing spend per model
Budget status panel
Shows active budget caps with current spend vs. limit progress bars. Color-coded: green under the soft limit, amber at the soft limit, red at the hard limit.
Forecast cards
Shows 7-day trailing cost forecasts per model with projected month-end spend and trend indicators (increasing / decreasing / stable).
Anomaly alerts
Lists detected cost anomalies with tenant, model, current daily rate vs. baseline, deviation percentage, and detection timestamp. The threshold is configurable globally via dvara.llm-gateway.finops.anomaly-threshold-pct and per-tenant by setting cost.anomaly-threshold-pct in the tenant metadata.


Token Usage page
For per-request token detail — the raw records underneath the dollar aggregates — open Cost → Token Usage in the sidebar. The page wraps the /v1/admin/token-usage REST surface with a filter form (tenant, API key, model, date range) that drives a summary KPI card (input / output / total tokens, request count, average tokens-per-request) and a records table (newest first, masked API keys, an estimated-flag tooltip on rows where the upstream didn't return exact counts). Pagination caps at 1000/page; default 50.
The Cost Dashboard is the dollar lens of the same data — tokens rolled up with pricing into spend figures grouped by tenant / model / provider / time range. Use the Cost Dashboard for spend visibility and budgets; use the Token Usage page for pricing audits, cost-per-token analysis, or reconciling a disputed tenant invoice.
See the Admin API reference for the list and summary endpoints with filter parameters (tenantId, apiKey, model, from, to) and response shape.
Model pricing
Open Cost → Model Pricing in the sidebar.
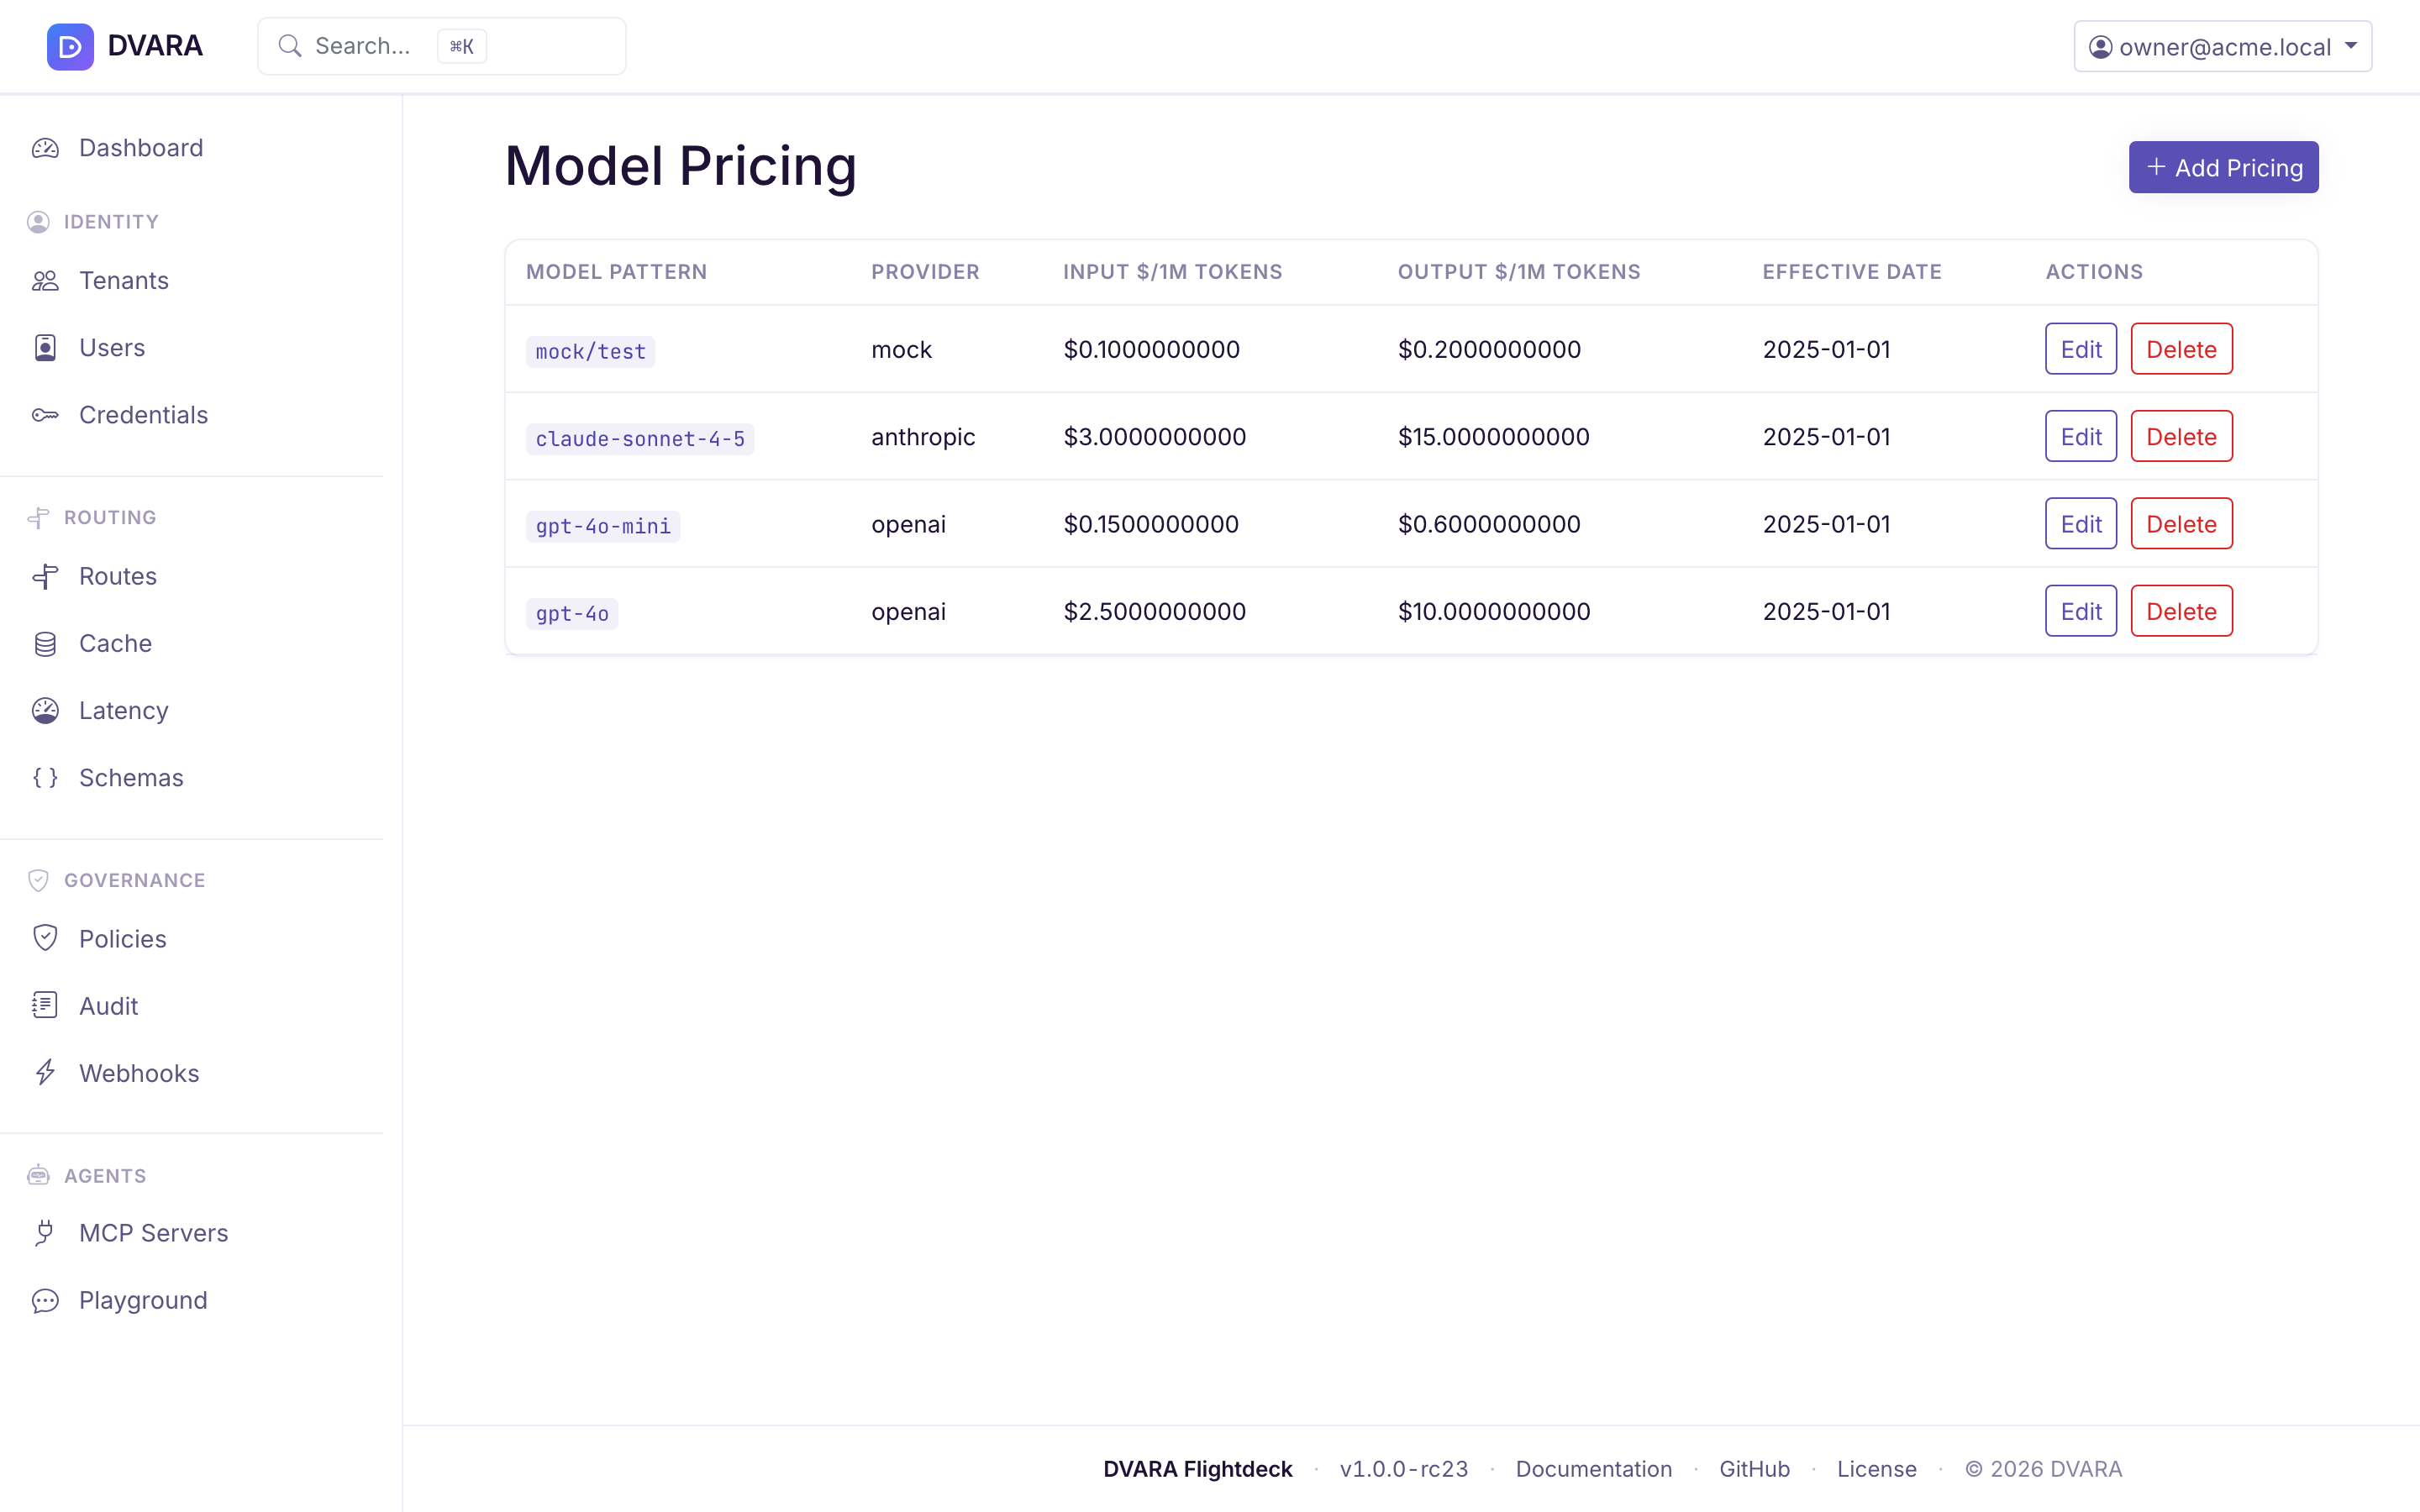
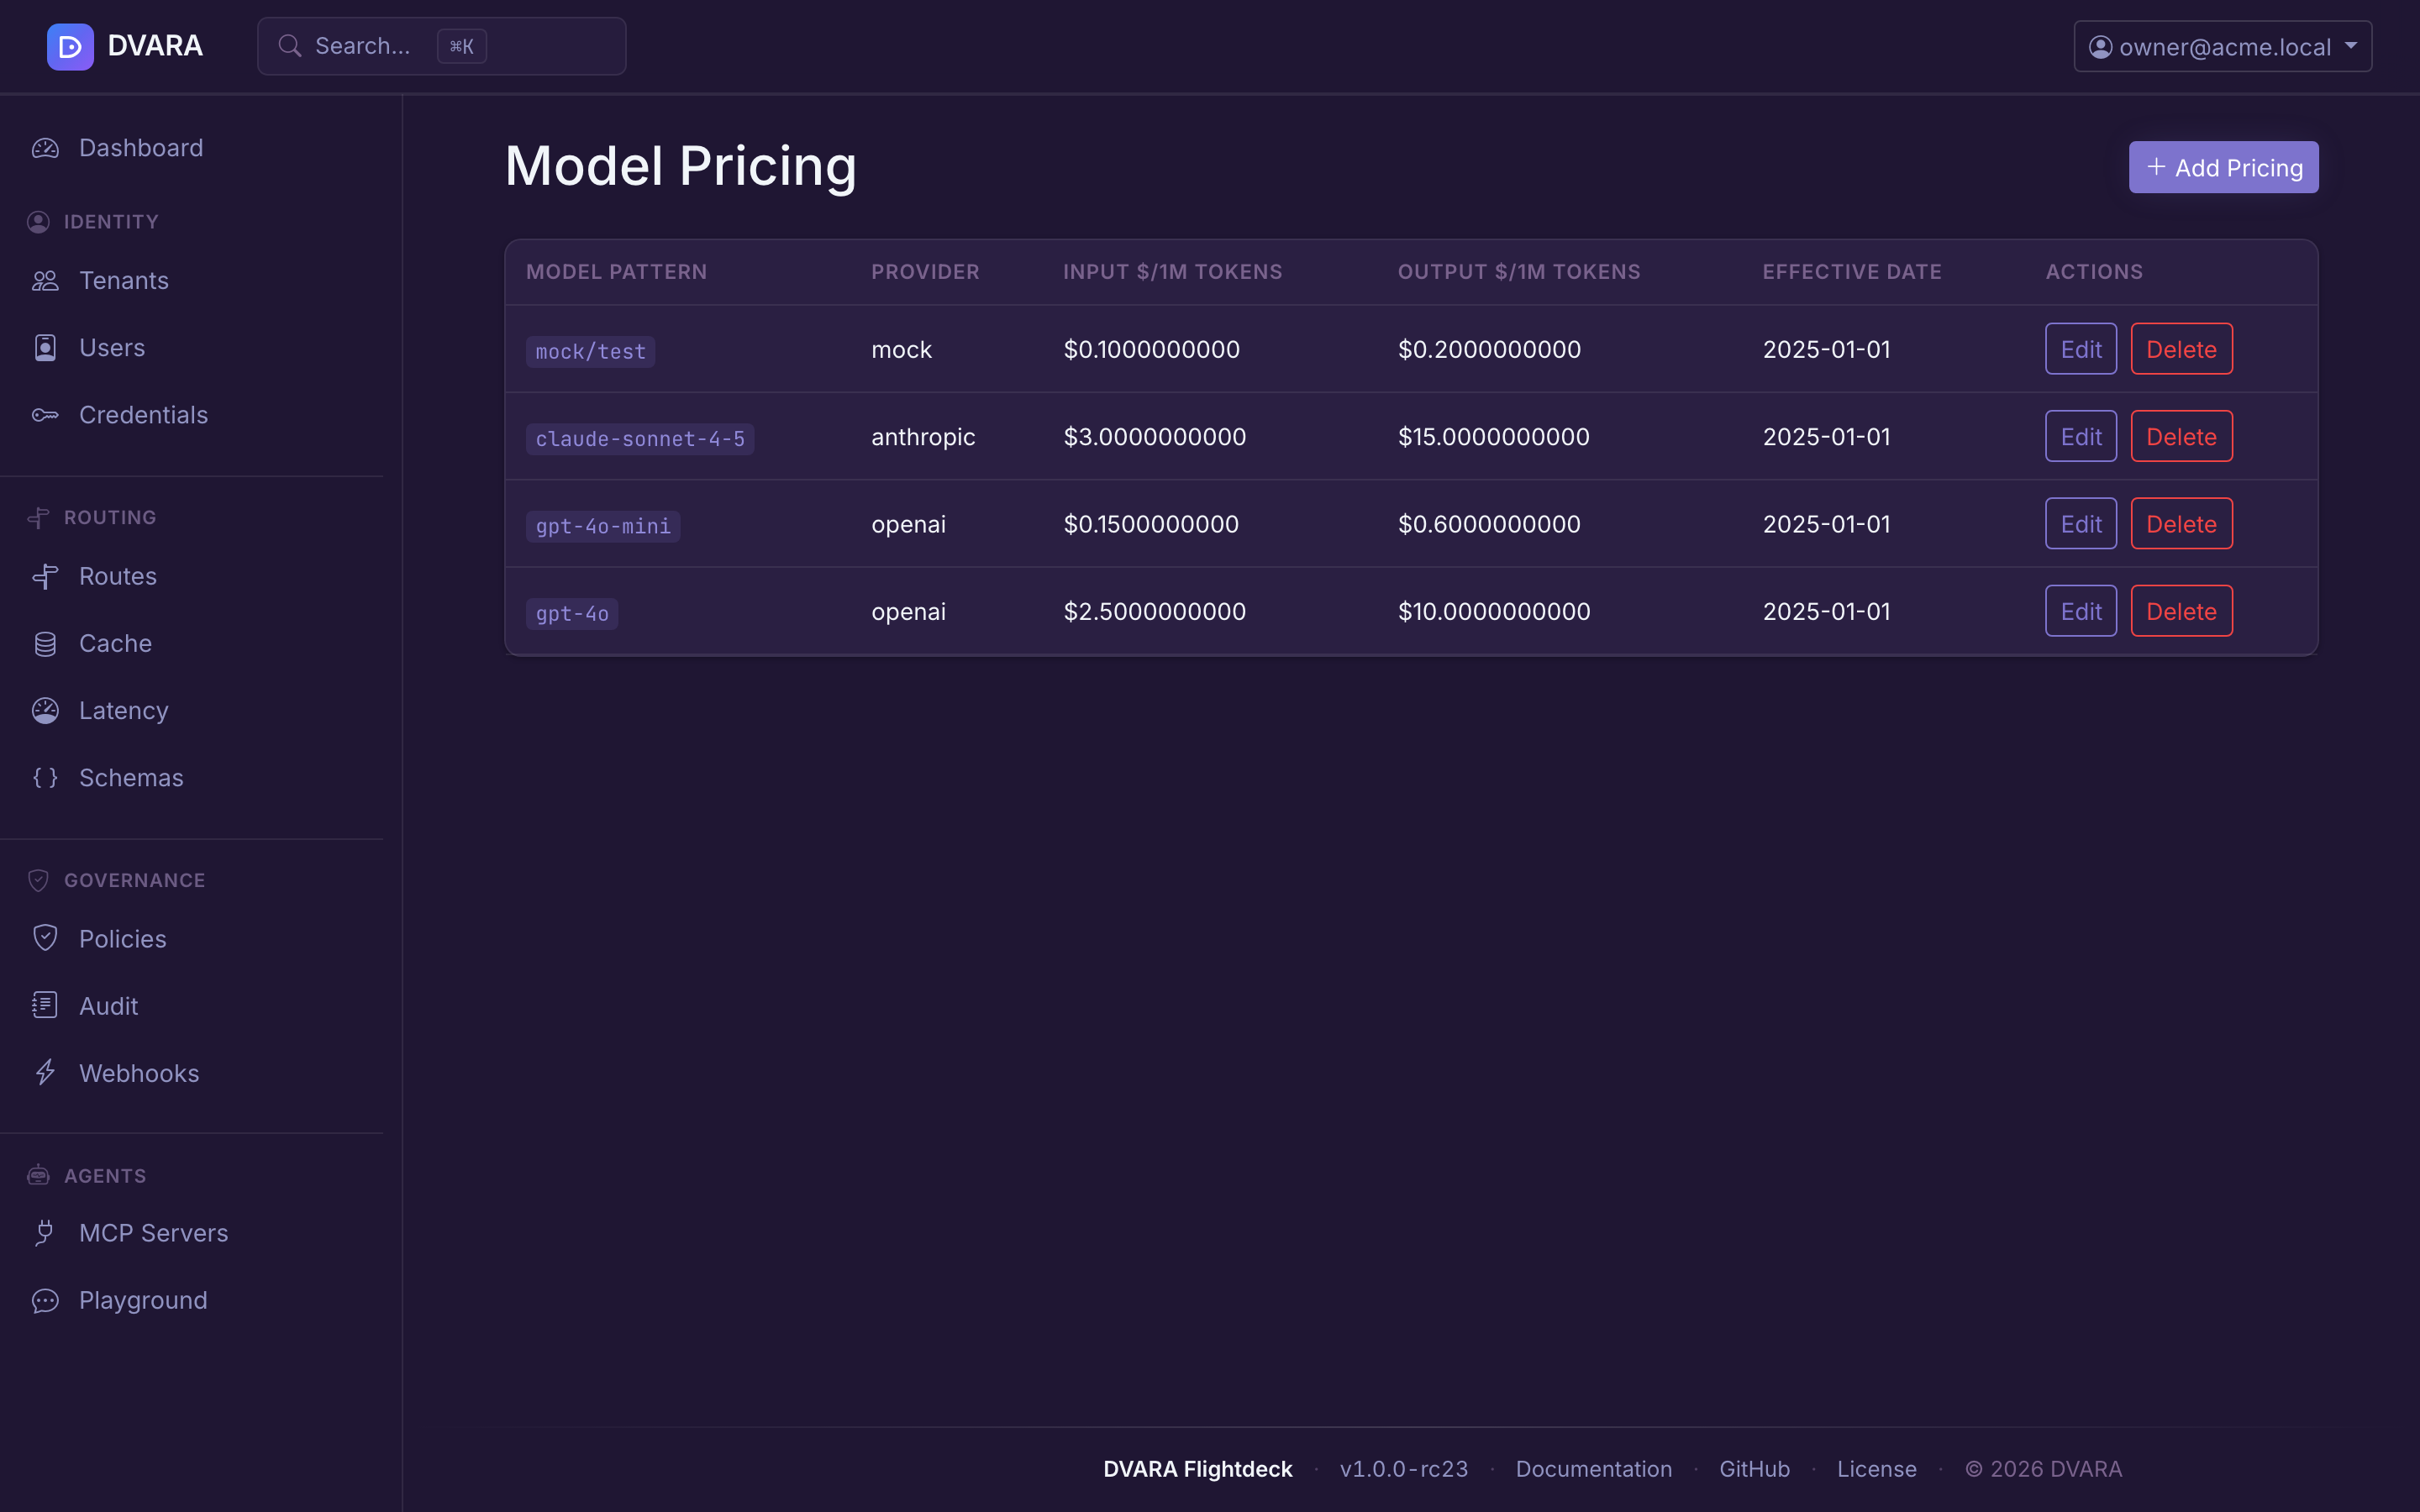
Pricing list
Lists every pricing entry with model pattern (glob), provider, input price per million tokens, output price per million tokens, effective date, and row actions.
Create / edit pricing
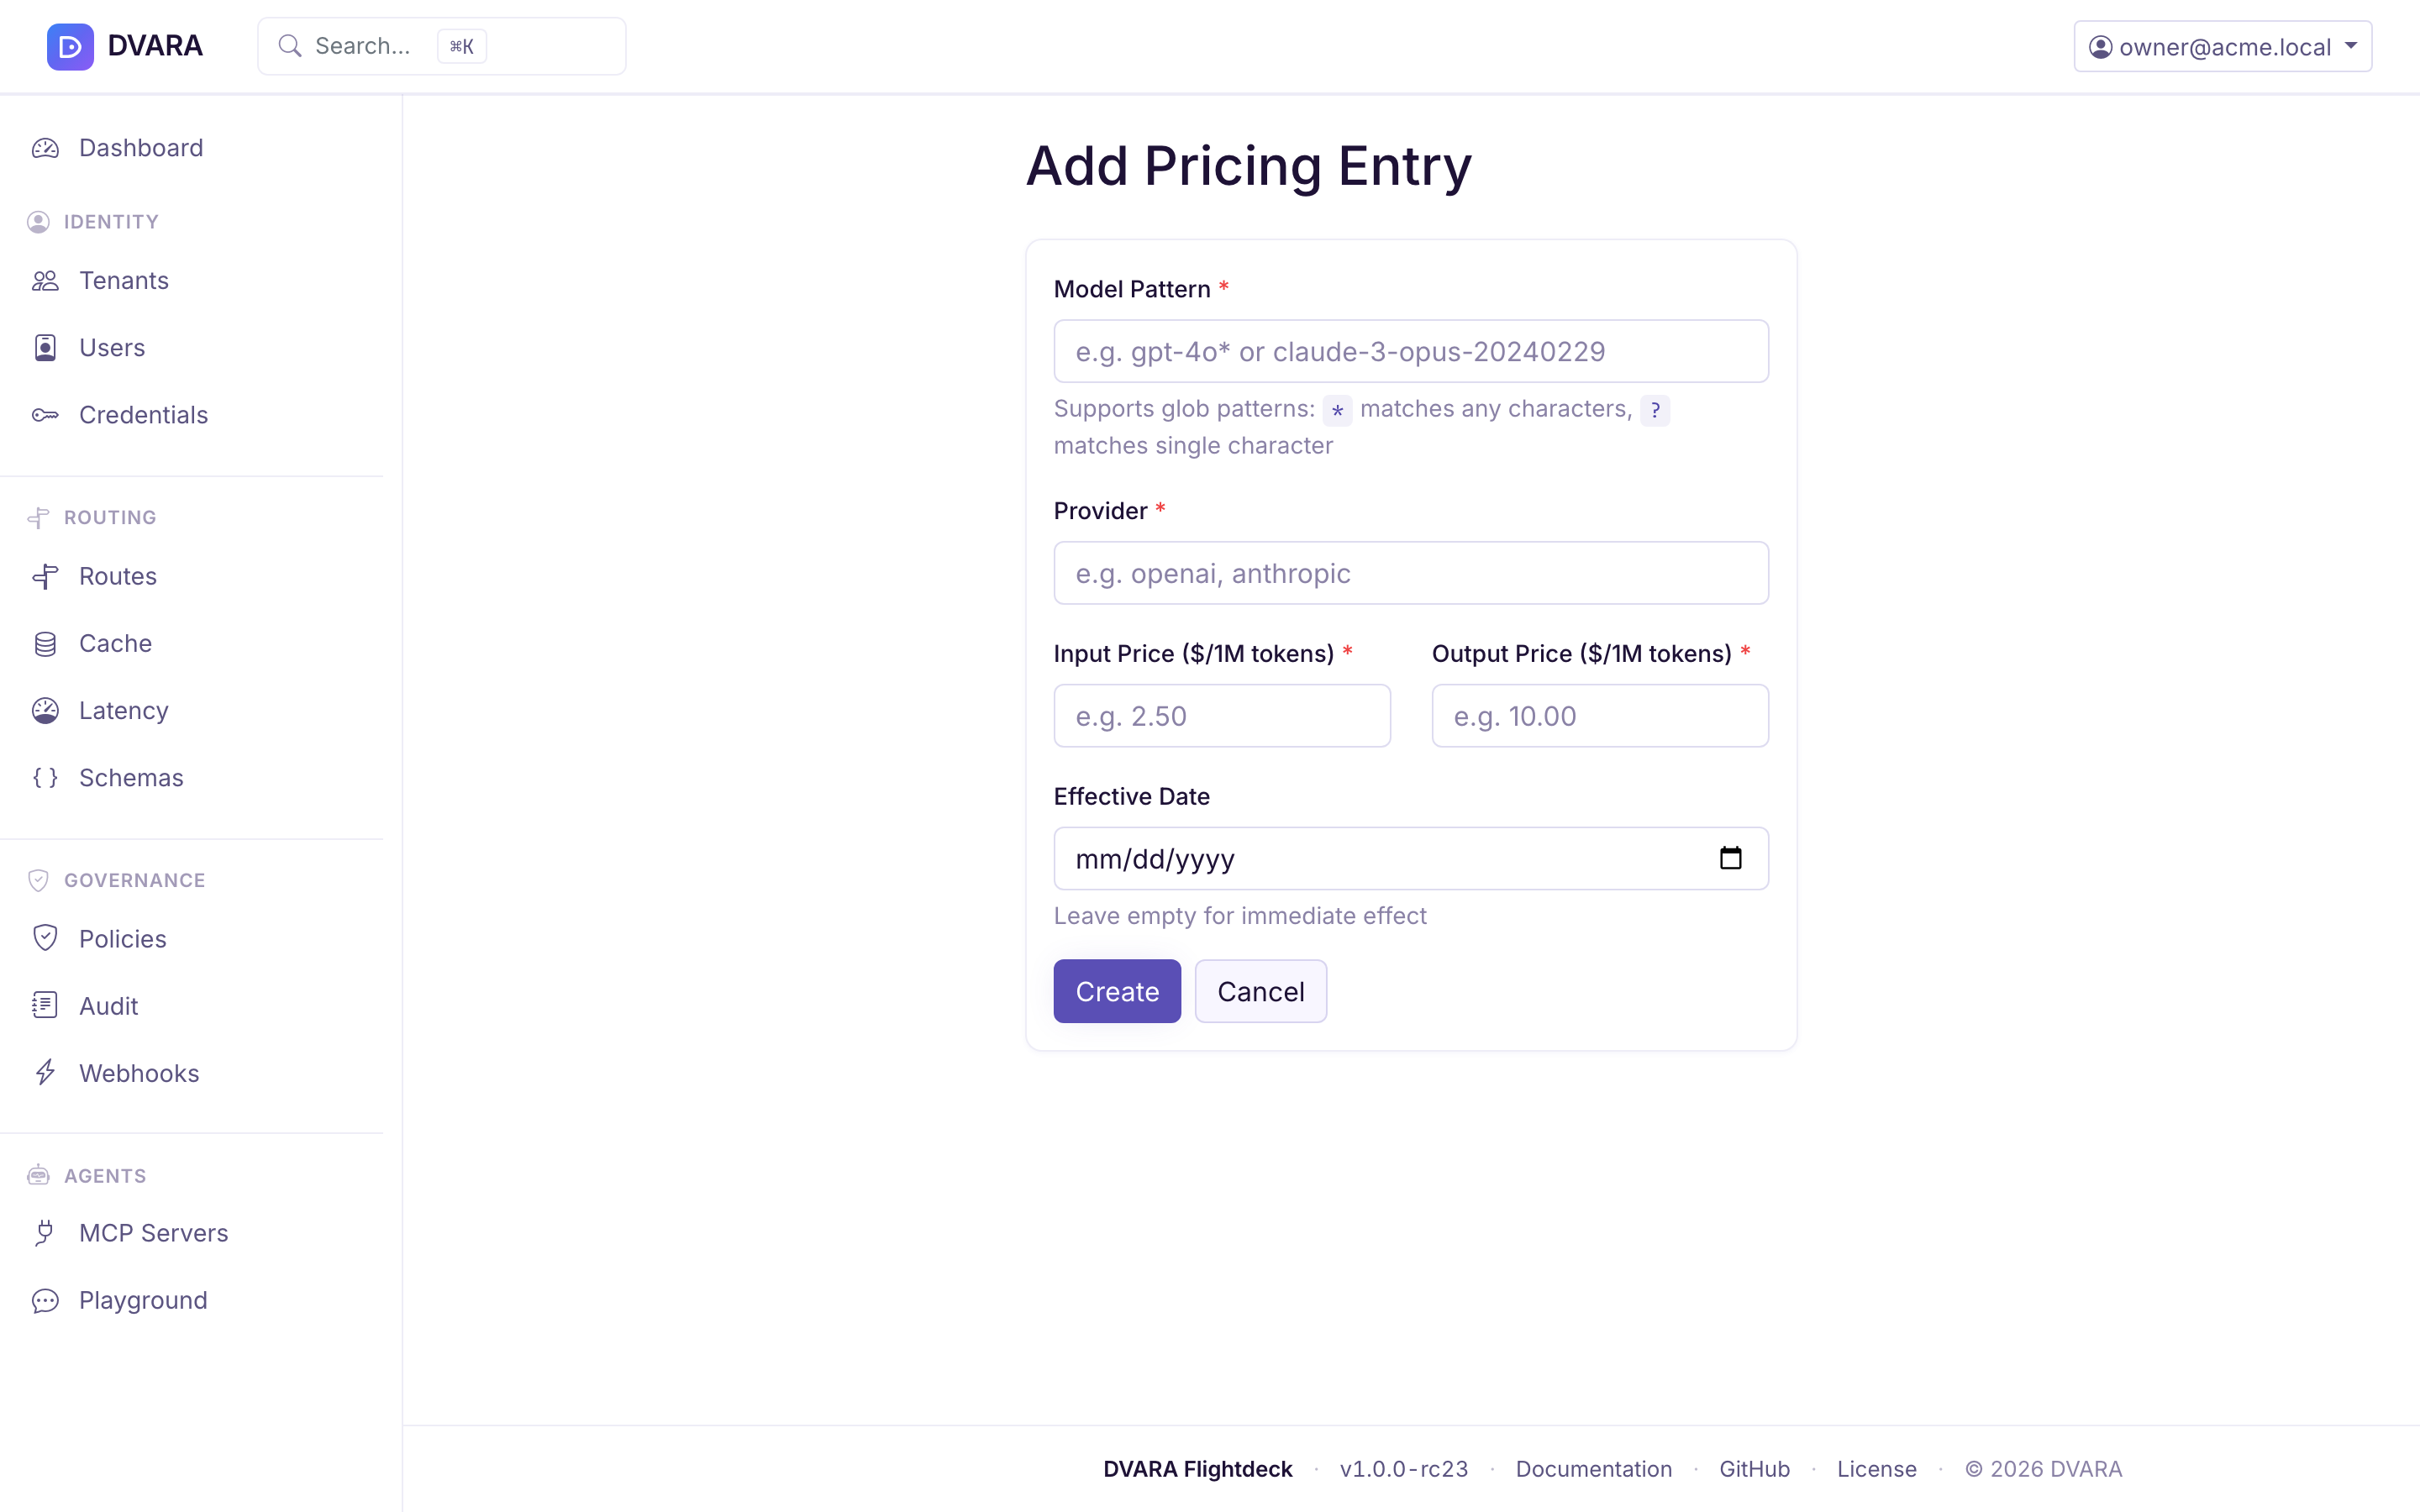
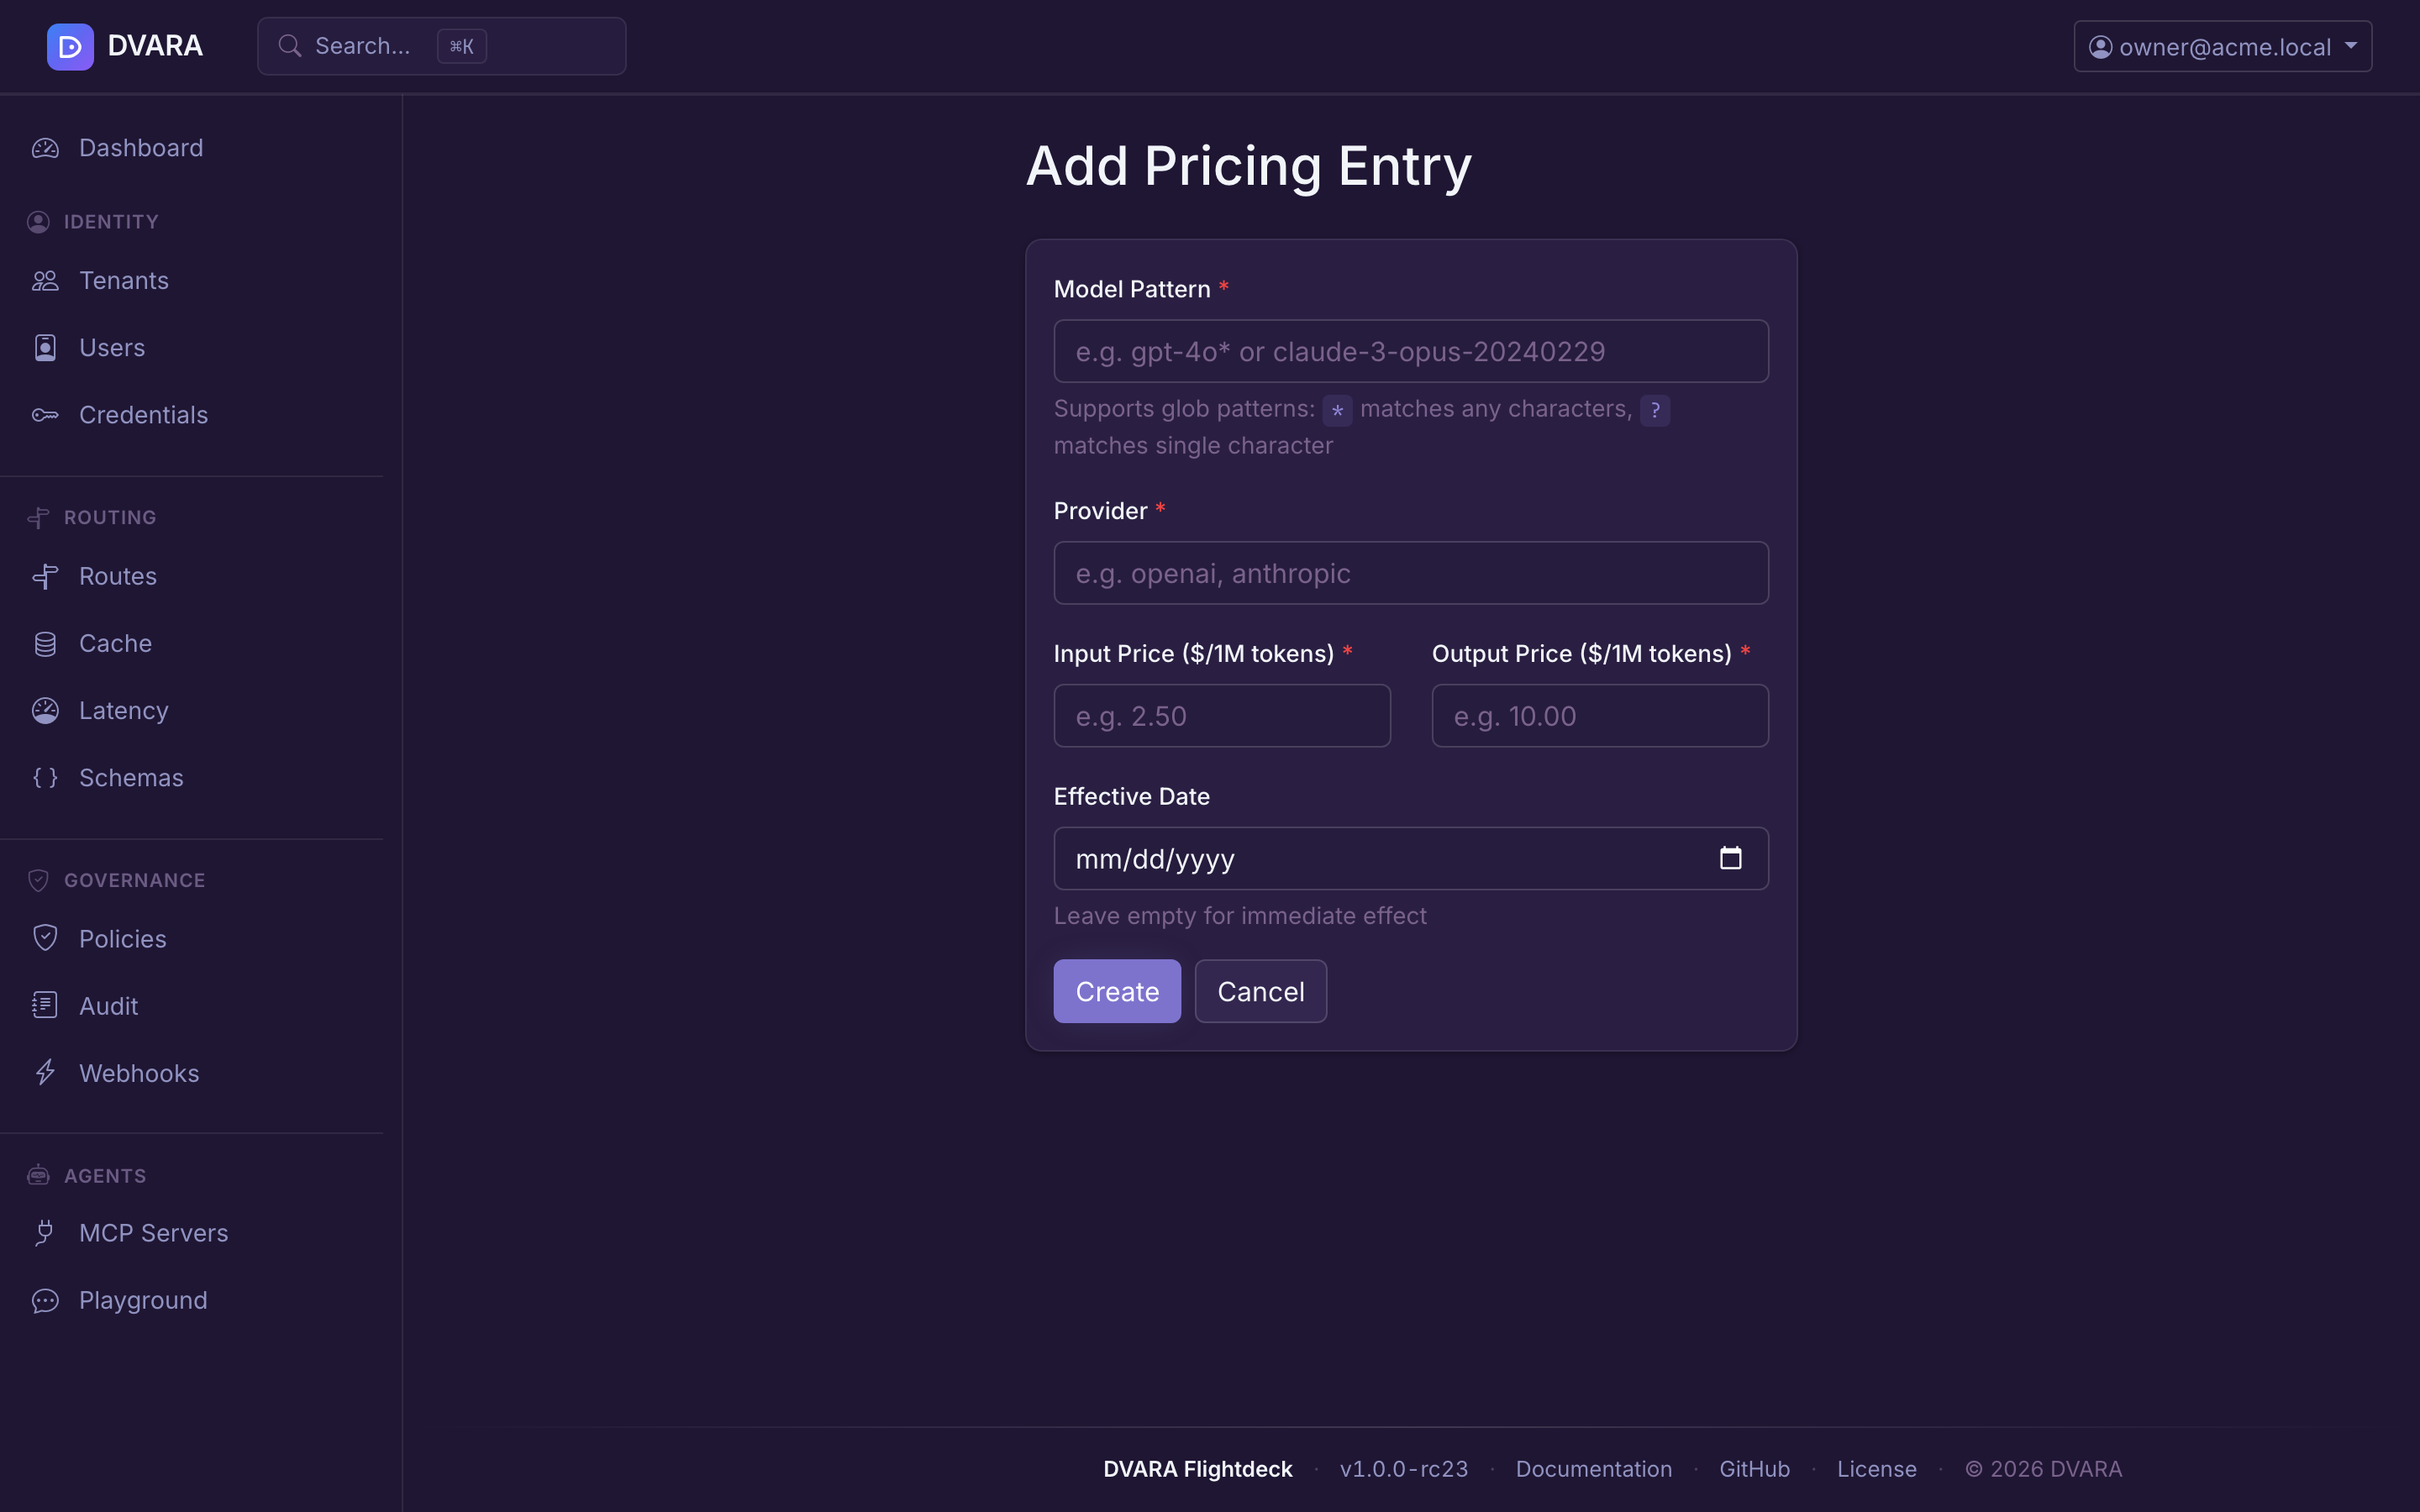
Click New Pricing to create an entry with:
- Model Pattern — glob pattern (e.g.
gpt-4o*,claude-3-sonnet*) - Provider — optional provider scope
- Input Price / Million — USD per 1 M input tokens
- Output Price / Million — USD per 1 M output tokens
- Effective Date — when this pricing takes effect
Click Delete to remove a pricing entry. Requires confirmation.
Budget caps
Open Cost → Budget Caps in the sidebar.
Budget list
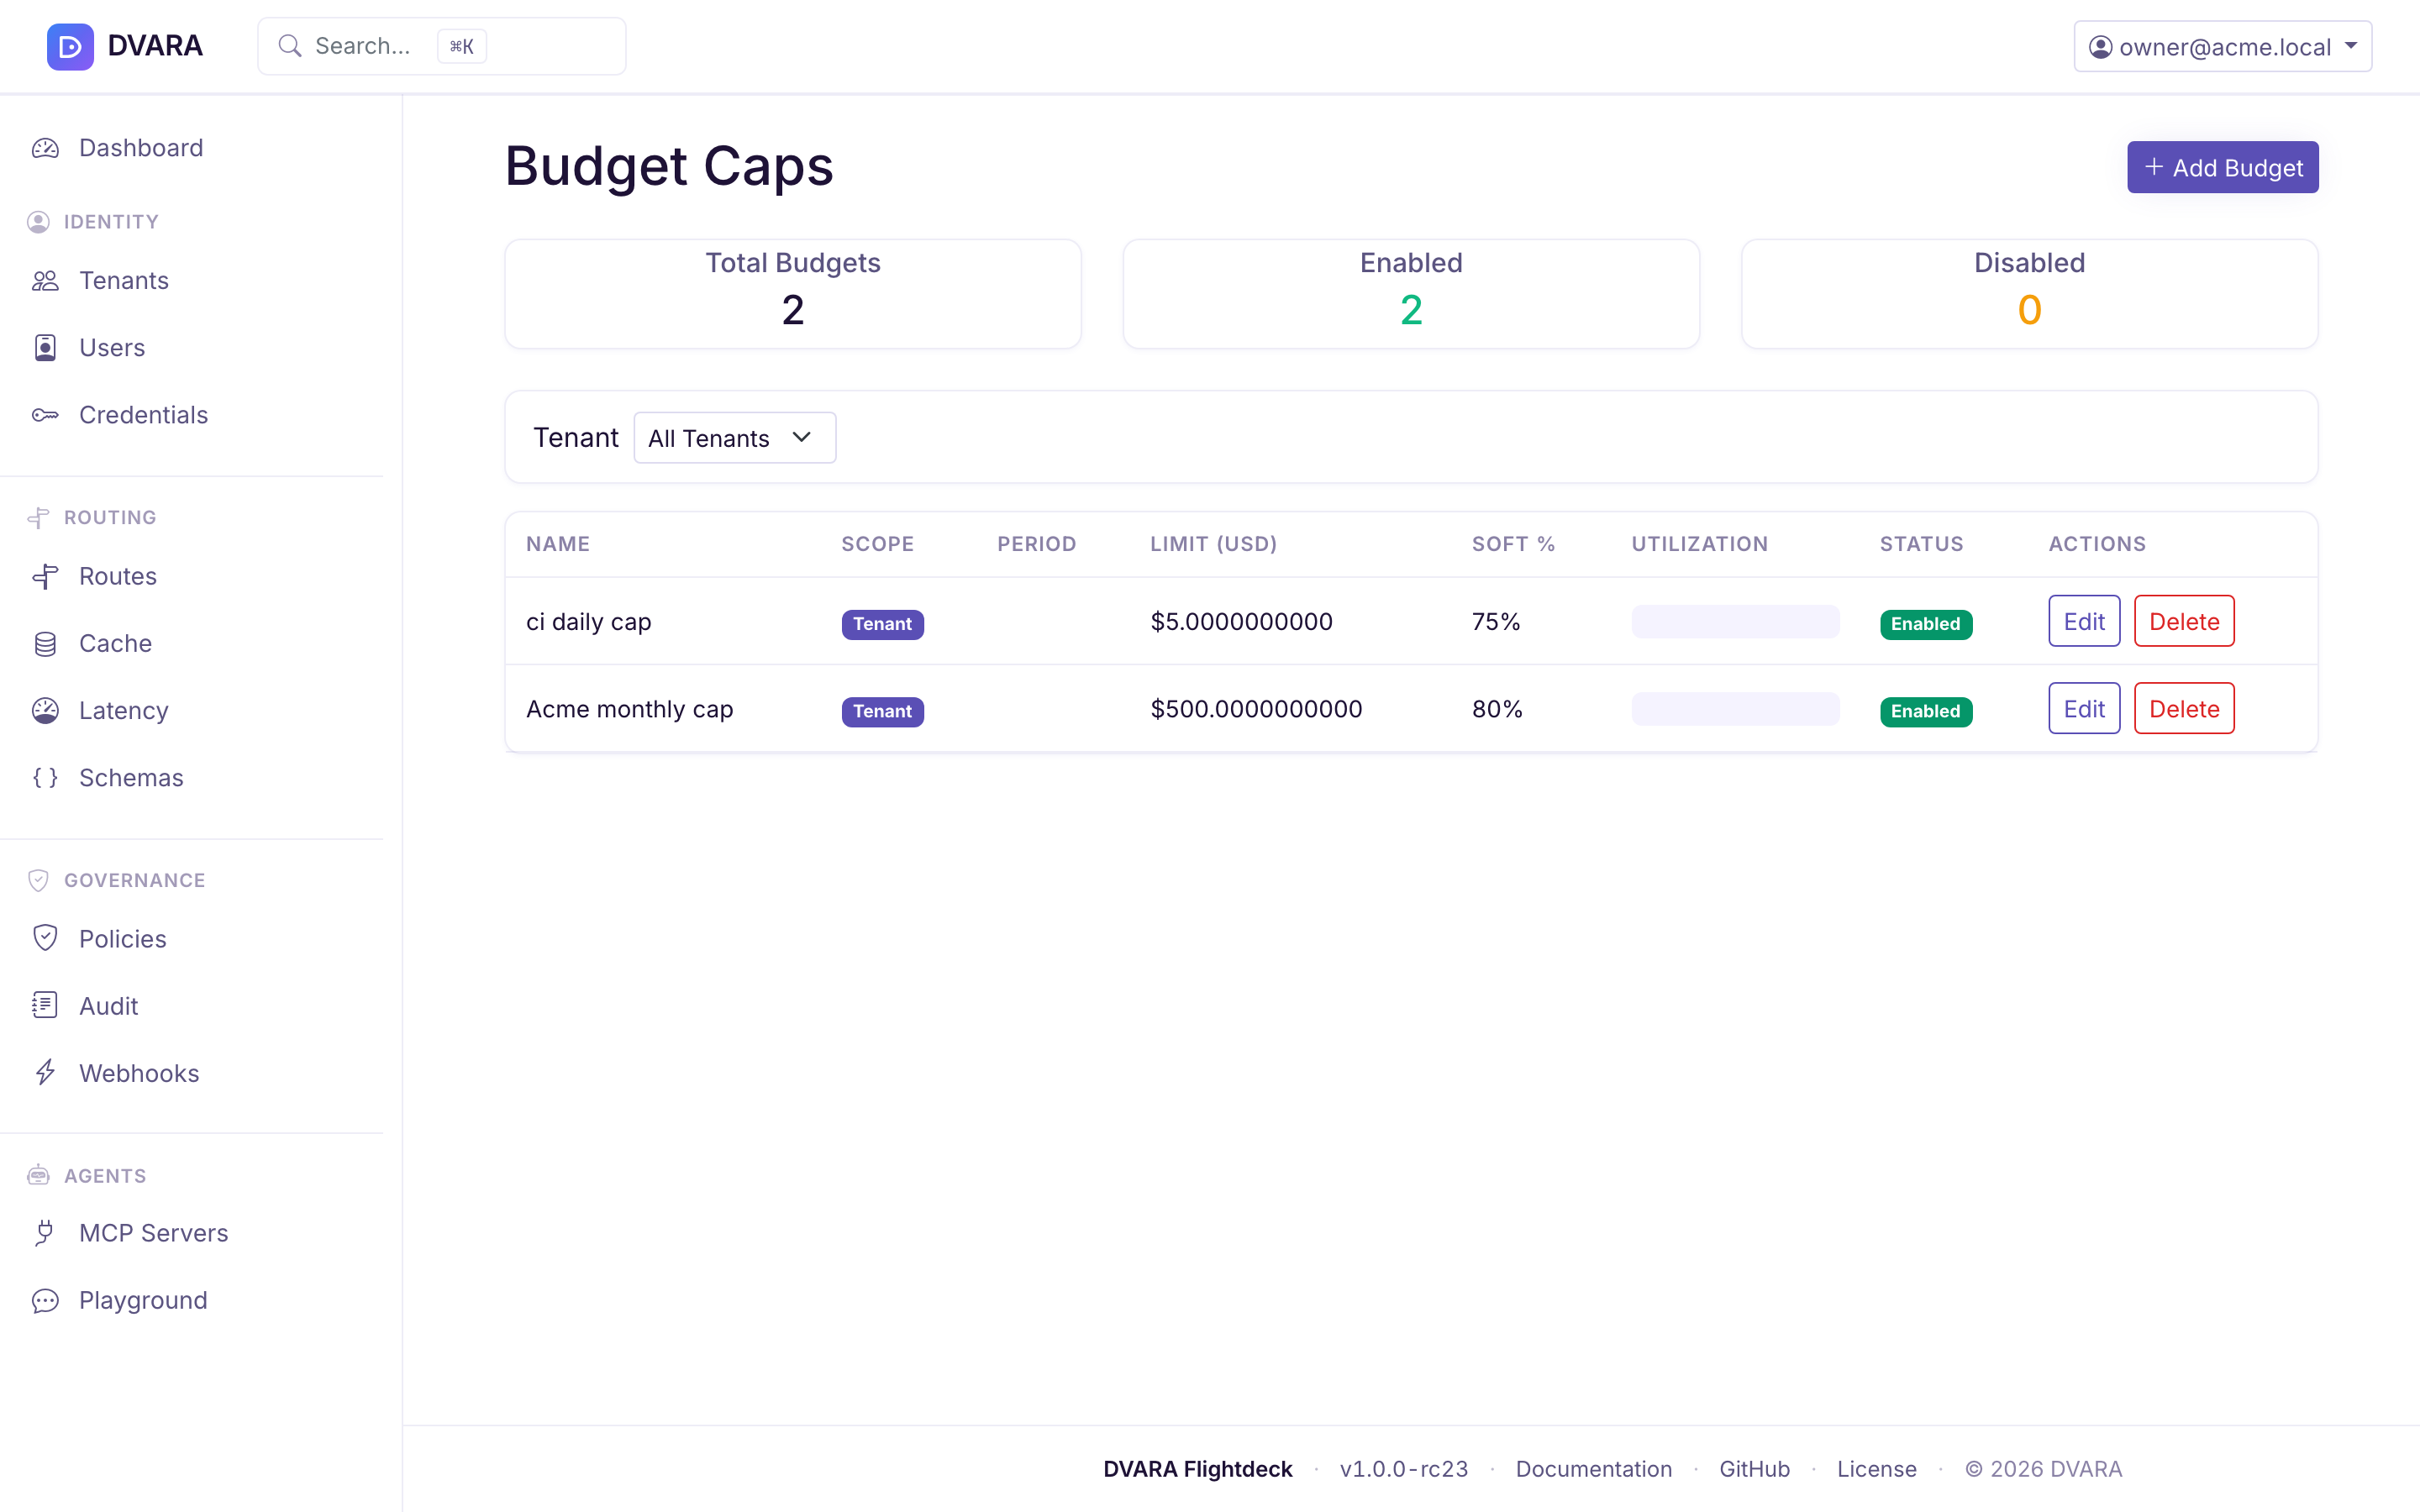
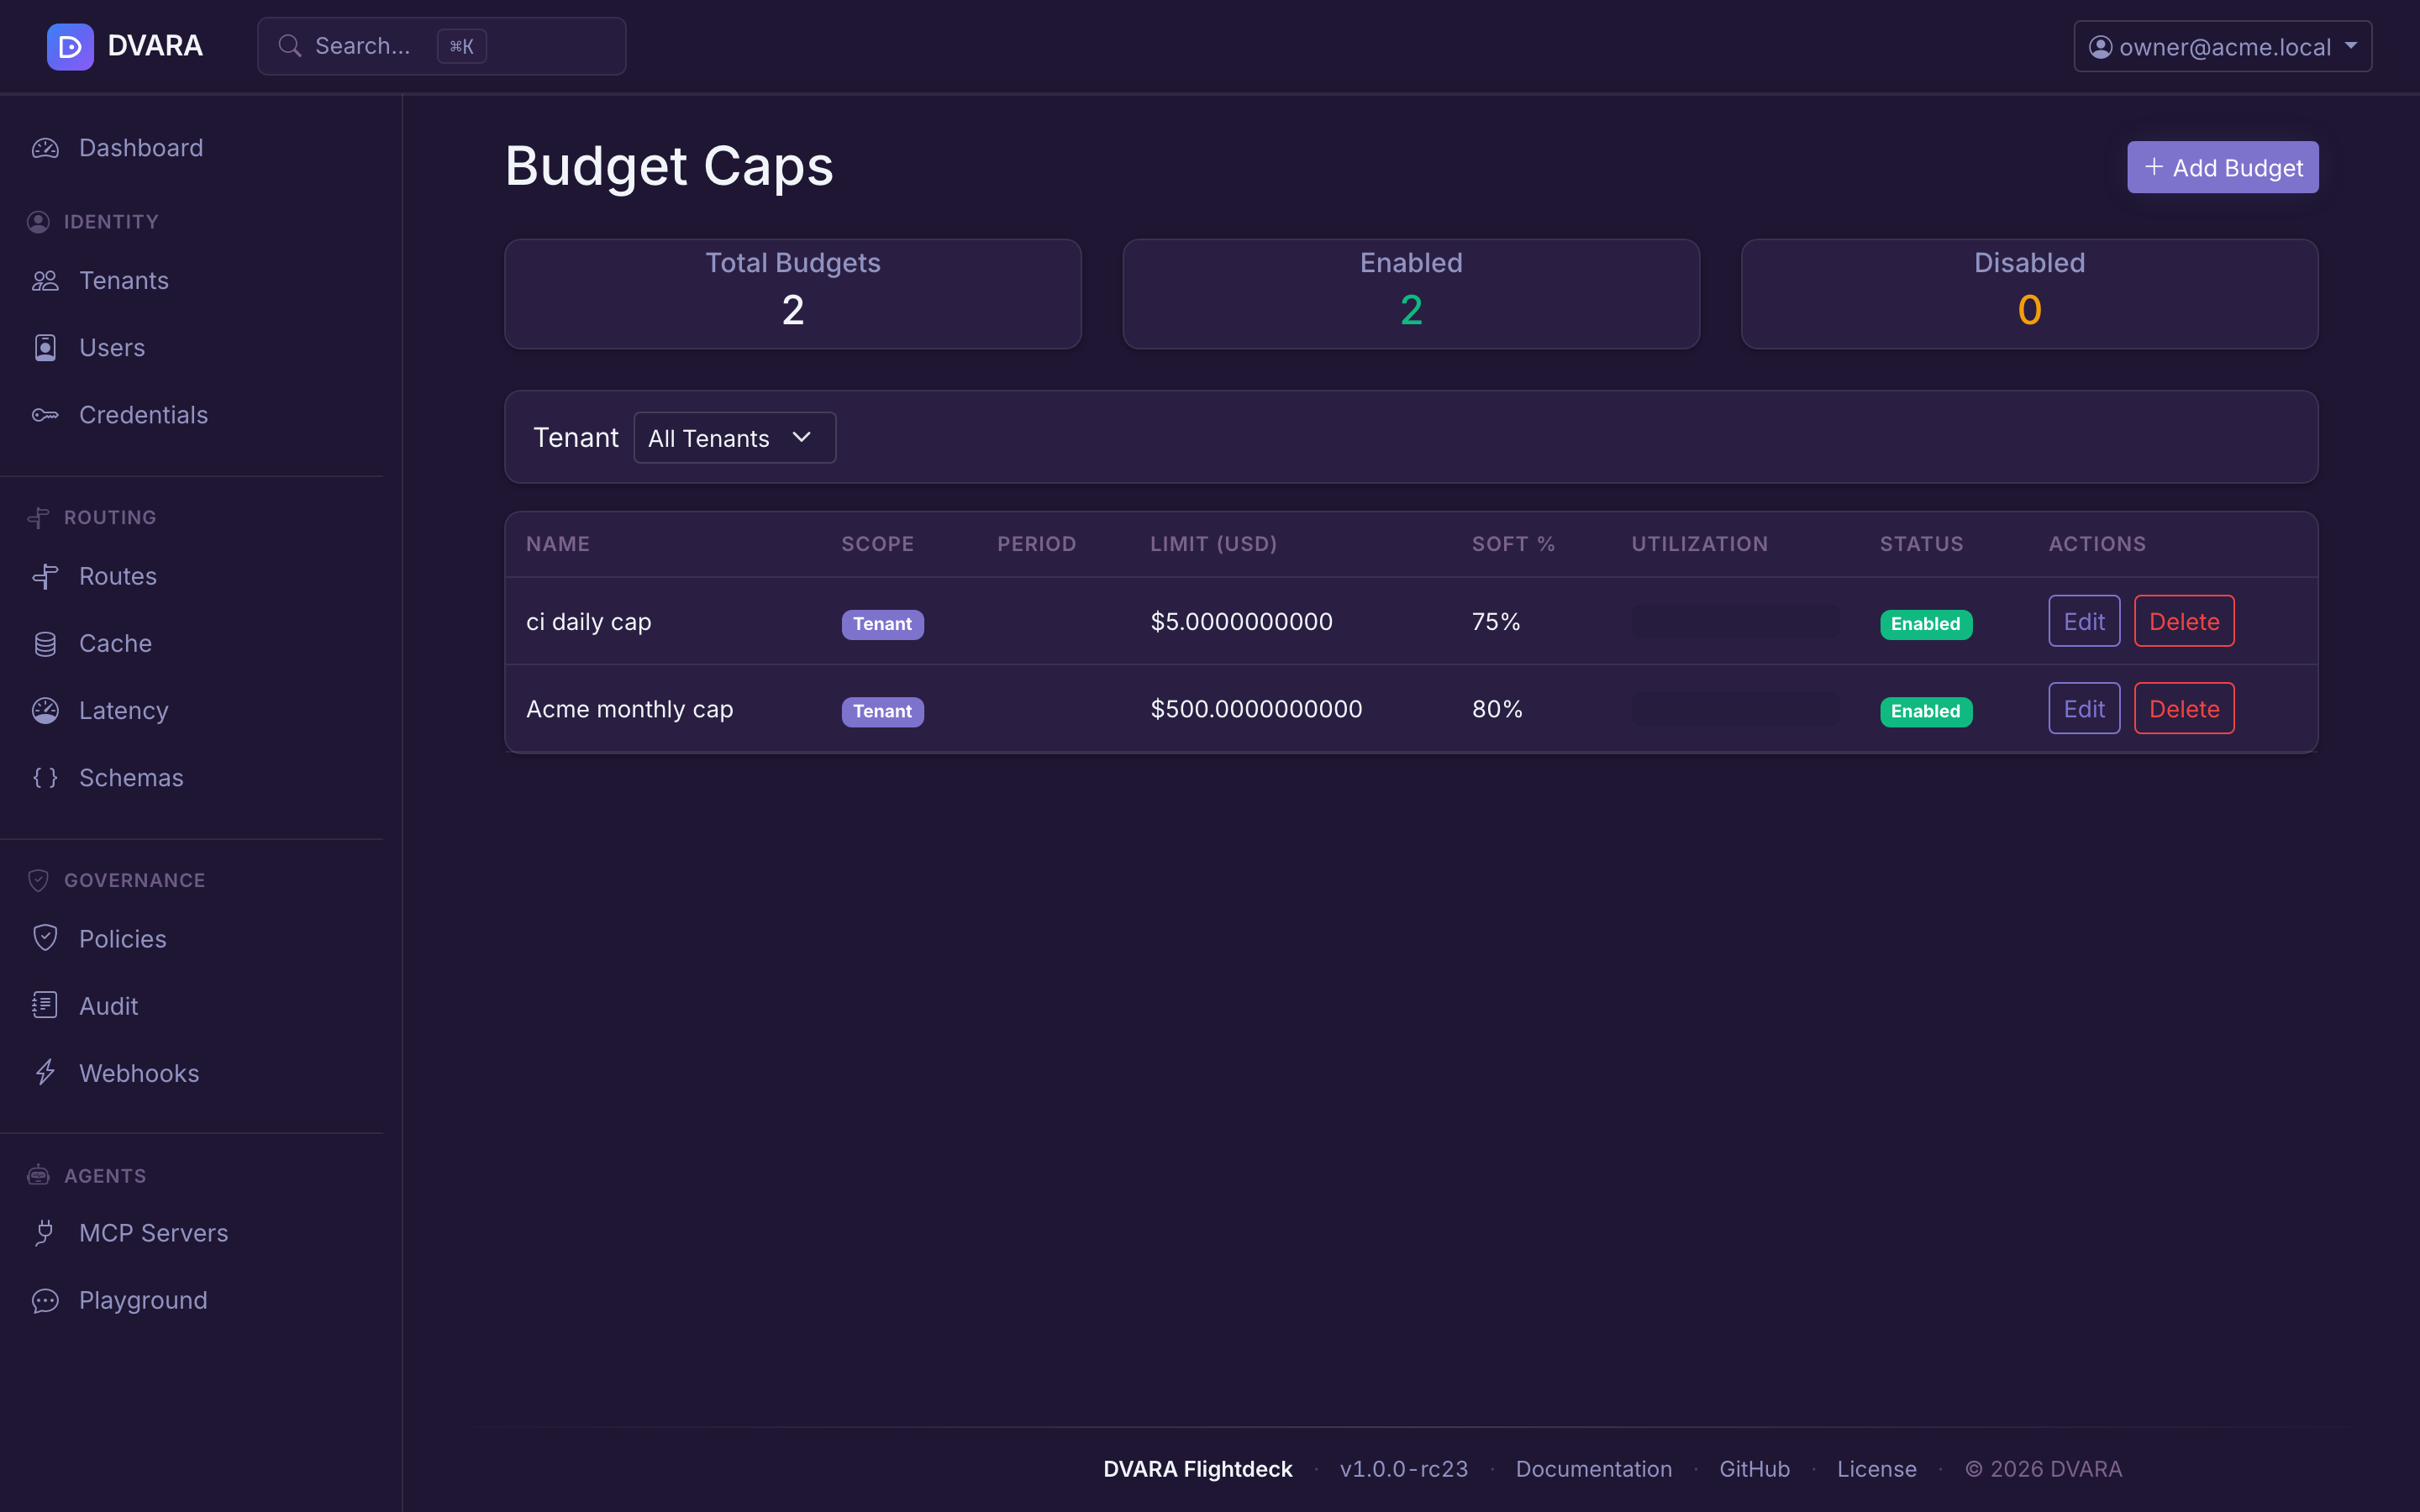
Lists every budget cap with name, tenant, API key, period (DAILY / WEEKLY / MONTHLY), limit (USD), soft limit percentage, enabled status, and version. Auto-refreshes every 10 seconds. A Summary row at the top shows total budgets, enabled count, and disabled count. Use the Tenant dropdown filter to narrow the list.
Tenants can create their own caps from /portal/budgets — these are stored with managedBy=TENANT and must sit at or below the effective platform ceiling (the tightest enabled PLATFORM-provenance cap that governs them). The Console's Budget list mixes both: platform-created caps are editable from here; tenant-created caps appear read-only with a lock badge. Budget evaluation is tightest-wins across every applicable cap.
Create / edit budget
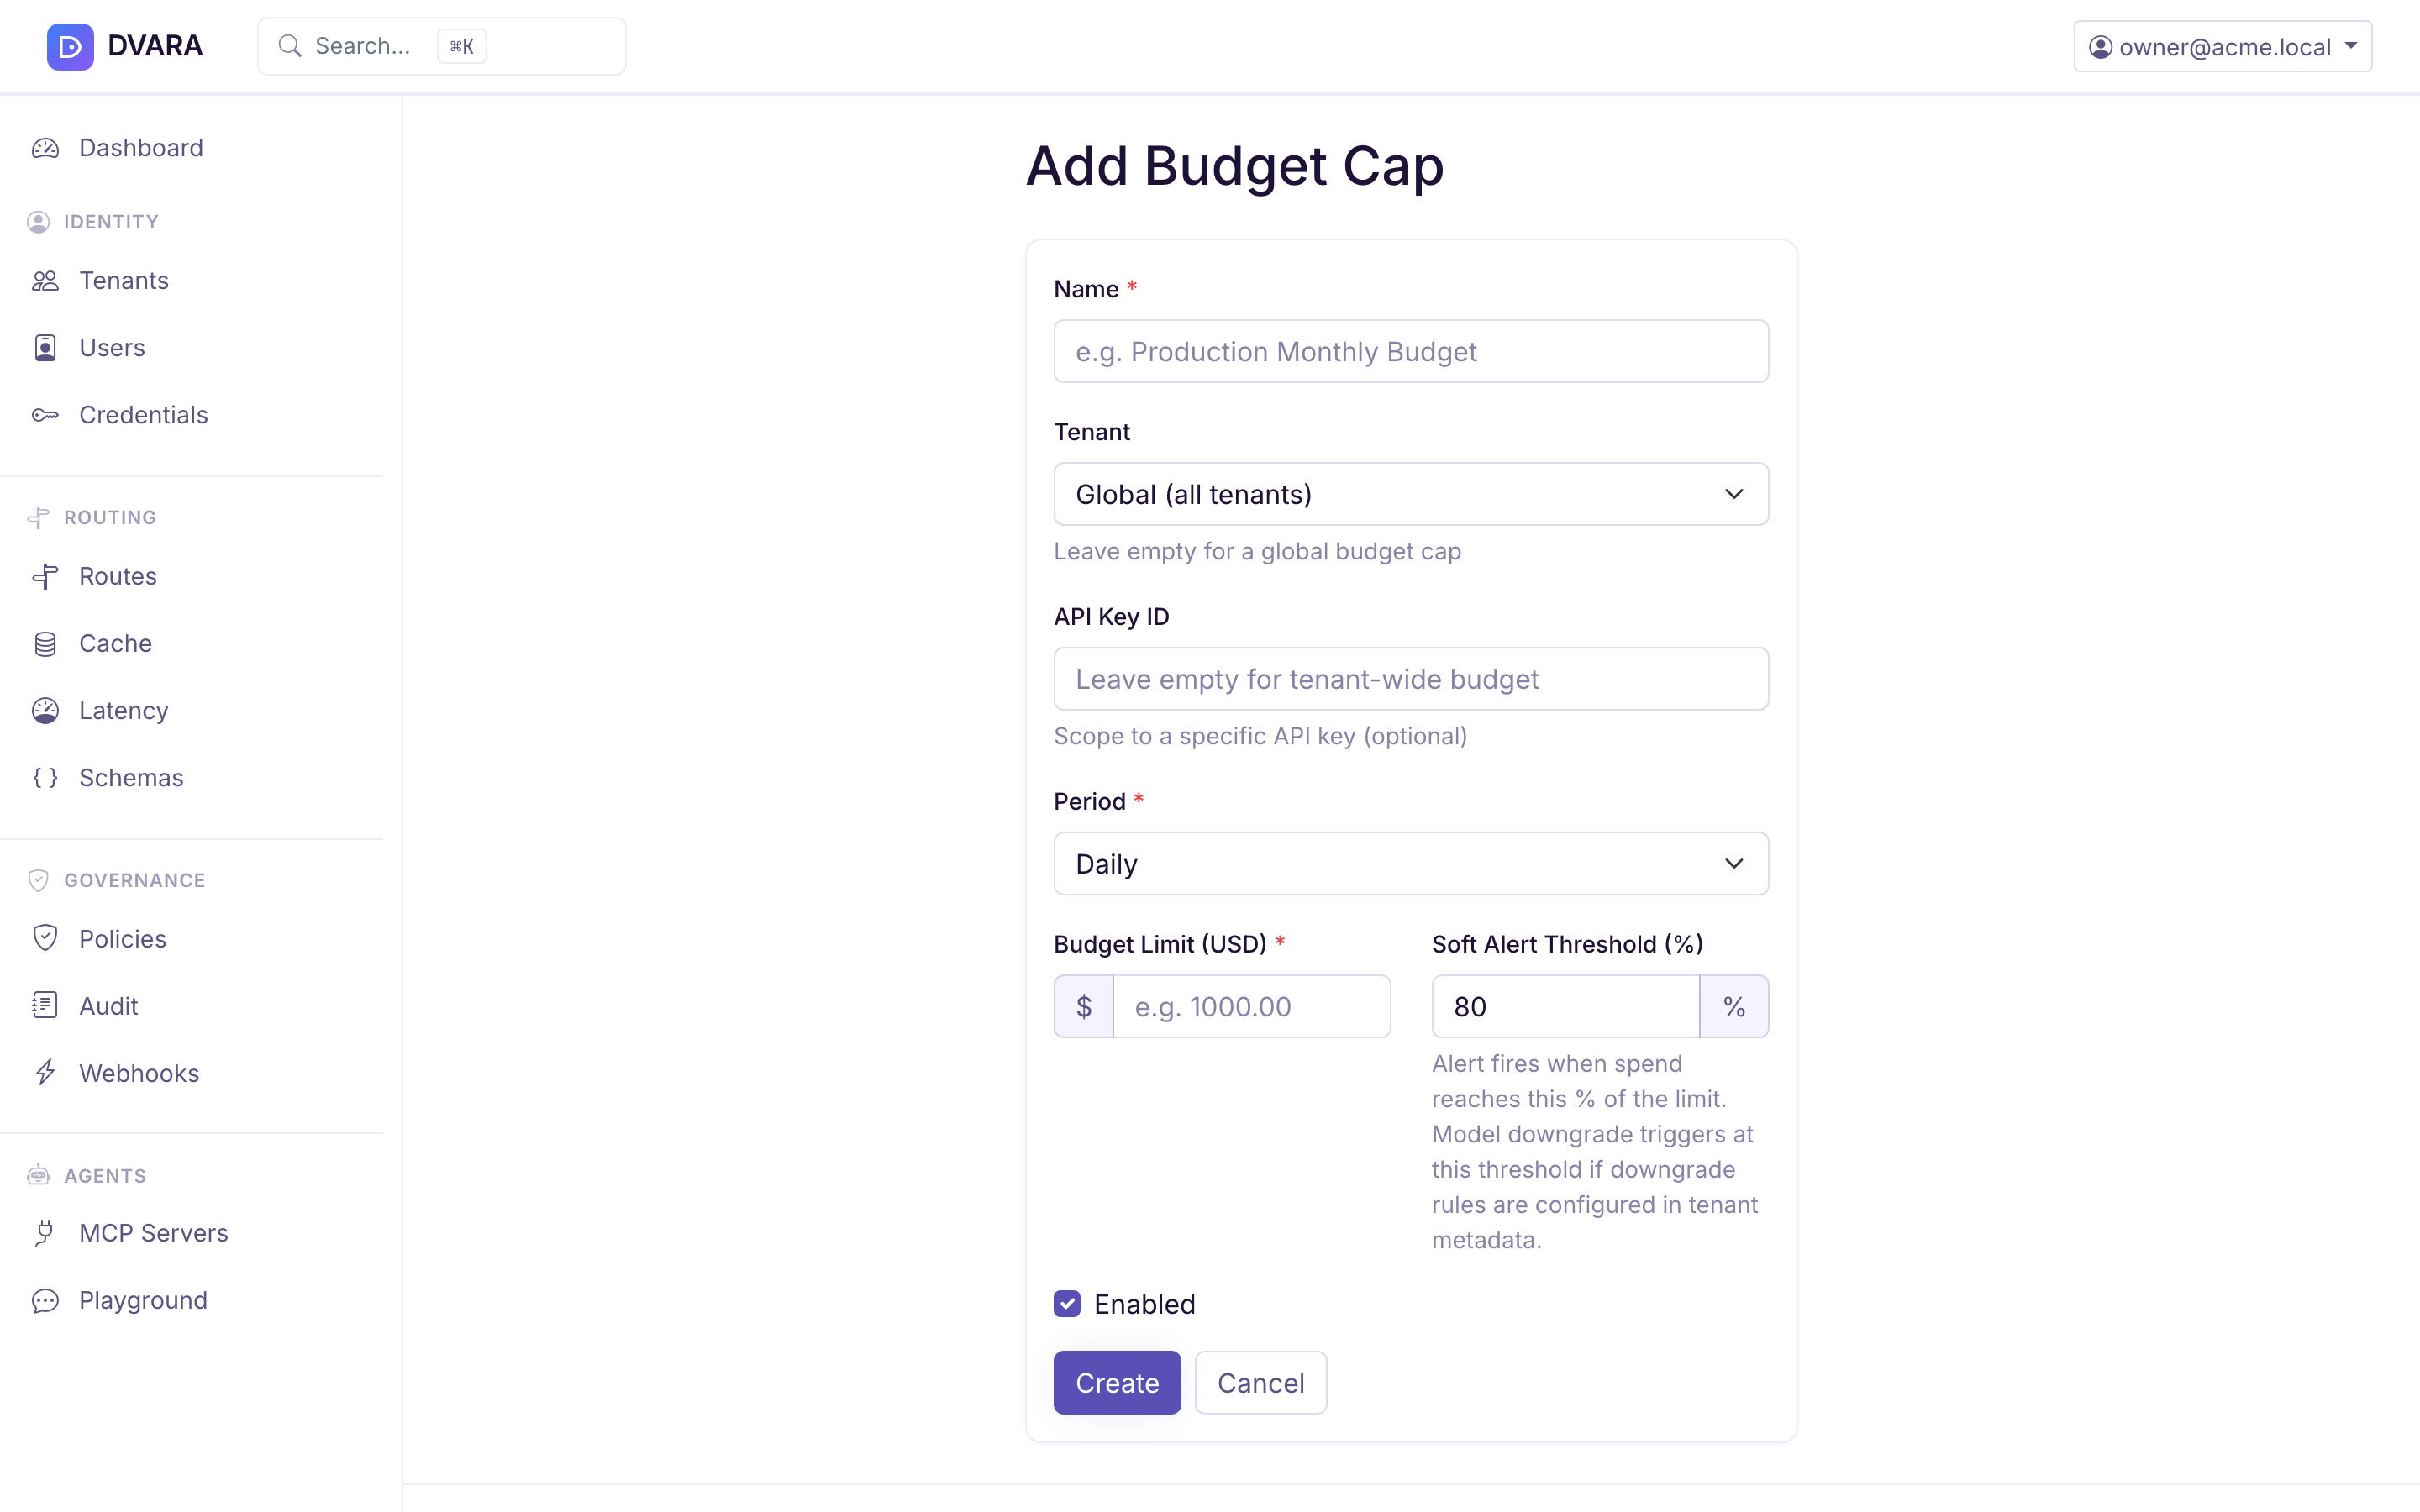
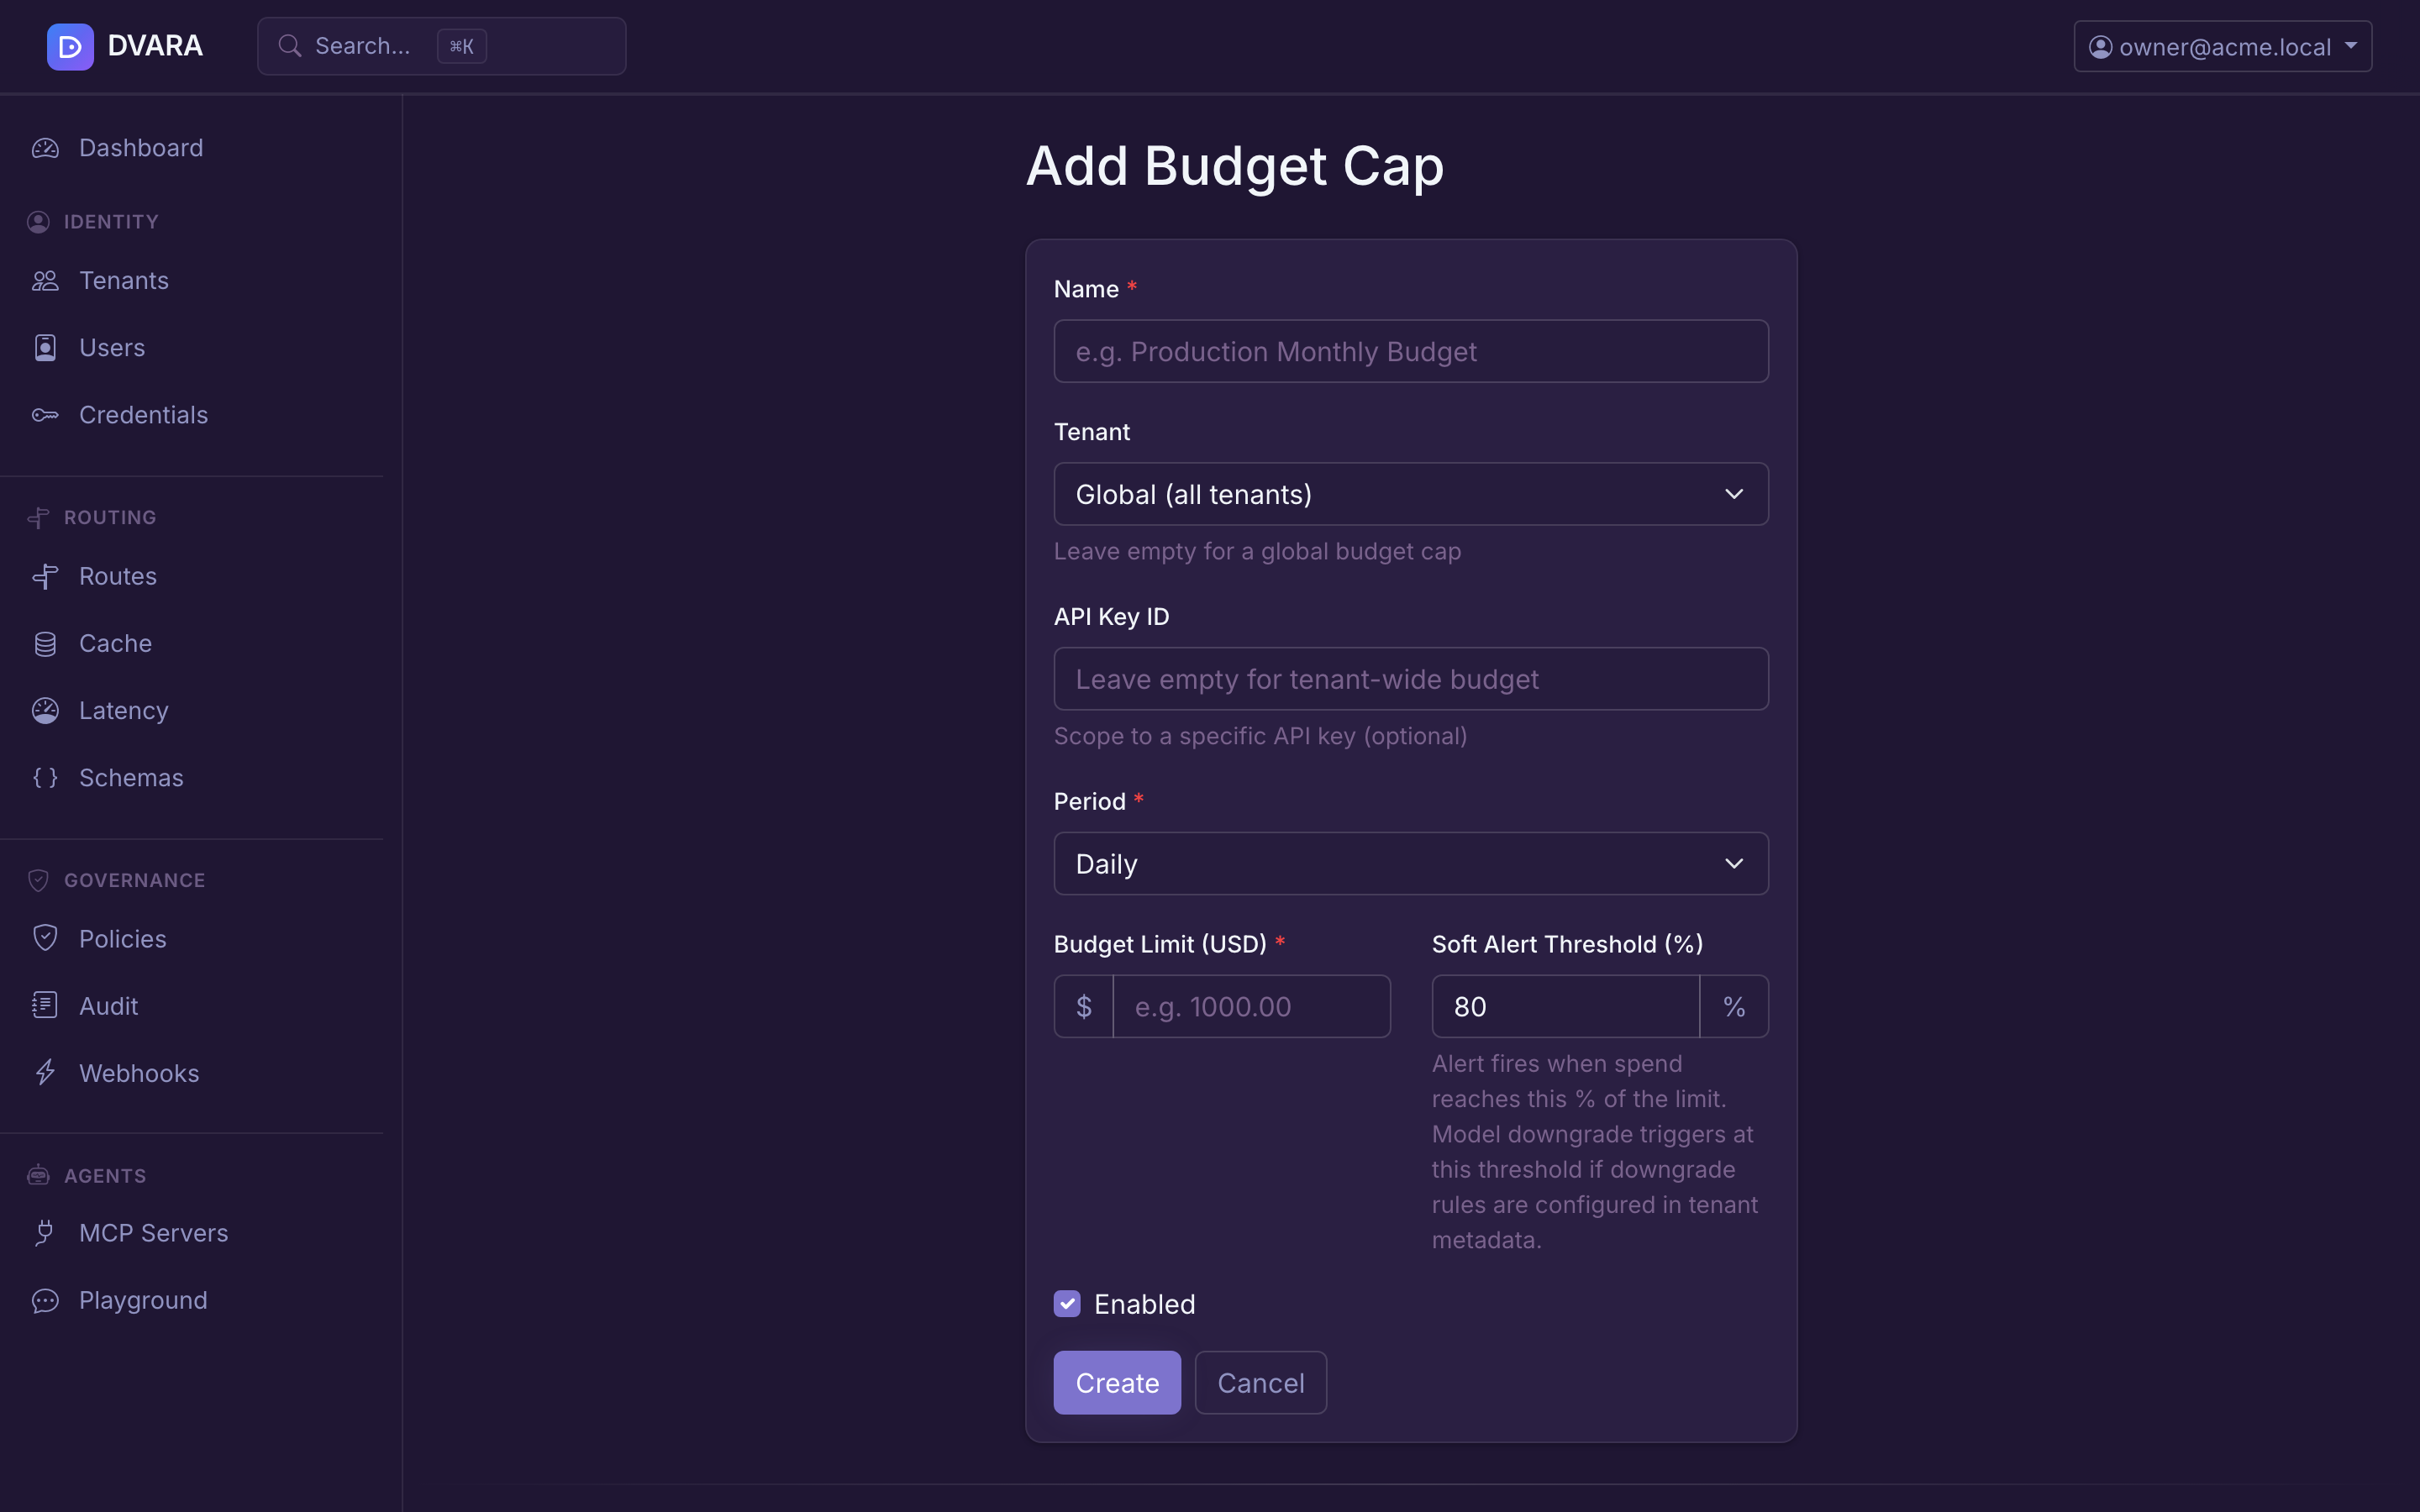
Click New Budget to create a budget cap with:
- Name — descriptive name
- Tenant ID — scope to a tenant (blank = global: a fleet-wide cap on total spend across all tenants, evaluated on every request)
- API Key ID — scope to a specific API key (blank = tenant-wide)
- Period — DAILY, WEEKLY, or MONTHLY
- Limit (USD) — hard spending limit
- Soft Limit % — percentage of limit at which soft alerts trigger (default: 80%)
All applicable budgets are evaluated on each request and the tightest limit wins — a global cap, the tenant's cap, and an API-key cap can all apply at once, and the first to breach blocks (hard limit) or alerts (soft limit).
Per-call cost ceiling
Budget caps limit accumulated spend over a period. A separate, optional per-call ceiling limits the estimated cost of any single request — useful when you want a hard stop on one runaway call regardless of how much budget remains. It's off by default and set in configuration, not the Console:
# application.yml
dvara:
  llm-gateway:
    finops:
      per-call-max-cost-usd: 0.50   # reject any single request estimated above $0.50
A request whose estimated cost exceeds the ceiling is rejected before it reaches the provider with 402 Payment Required (PER_CALL_COST_EXCEEDED) and an audit event. The estimate is max_tokens × the model's output price, so the gate reflects the worst-case output cost the client declared — it applies only when the request sets max_tokens and the model has a pricing row; otherwise the call can't be priced and passes through. Override the ceiling for one tenant with cost.per-call-max-usd in the tenant's metadata. This complements, and runs alongside, the accumulated-spend budget caps above.
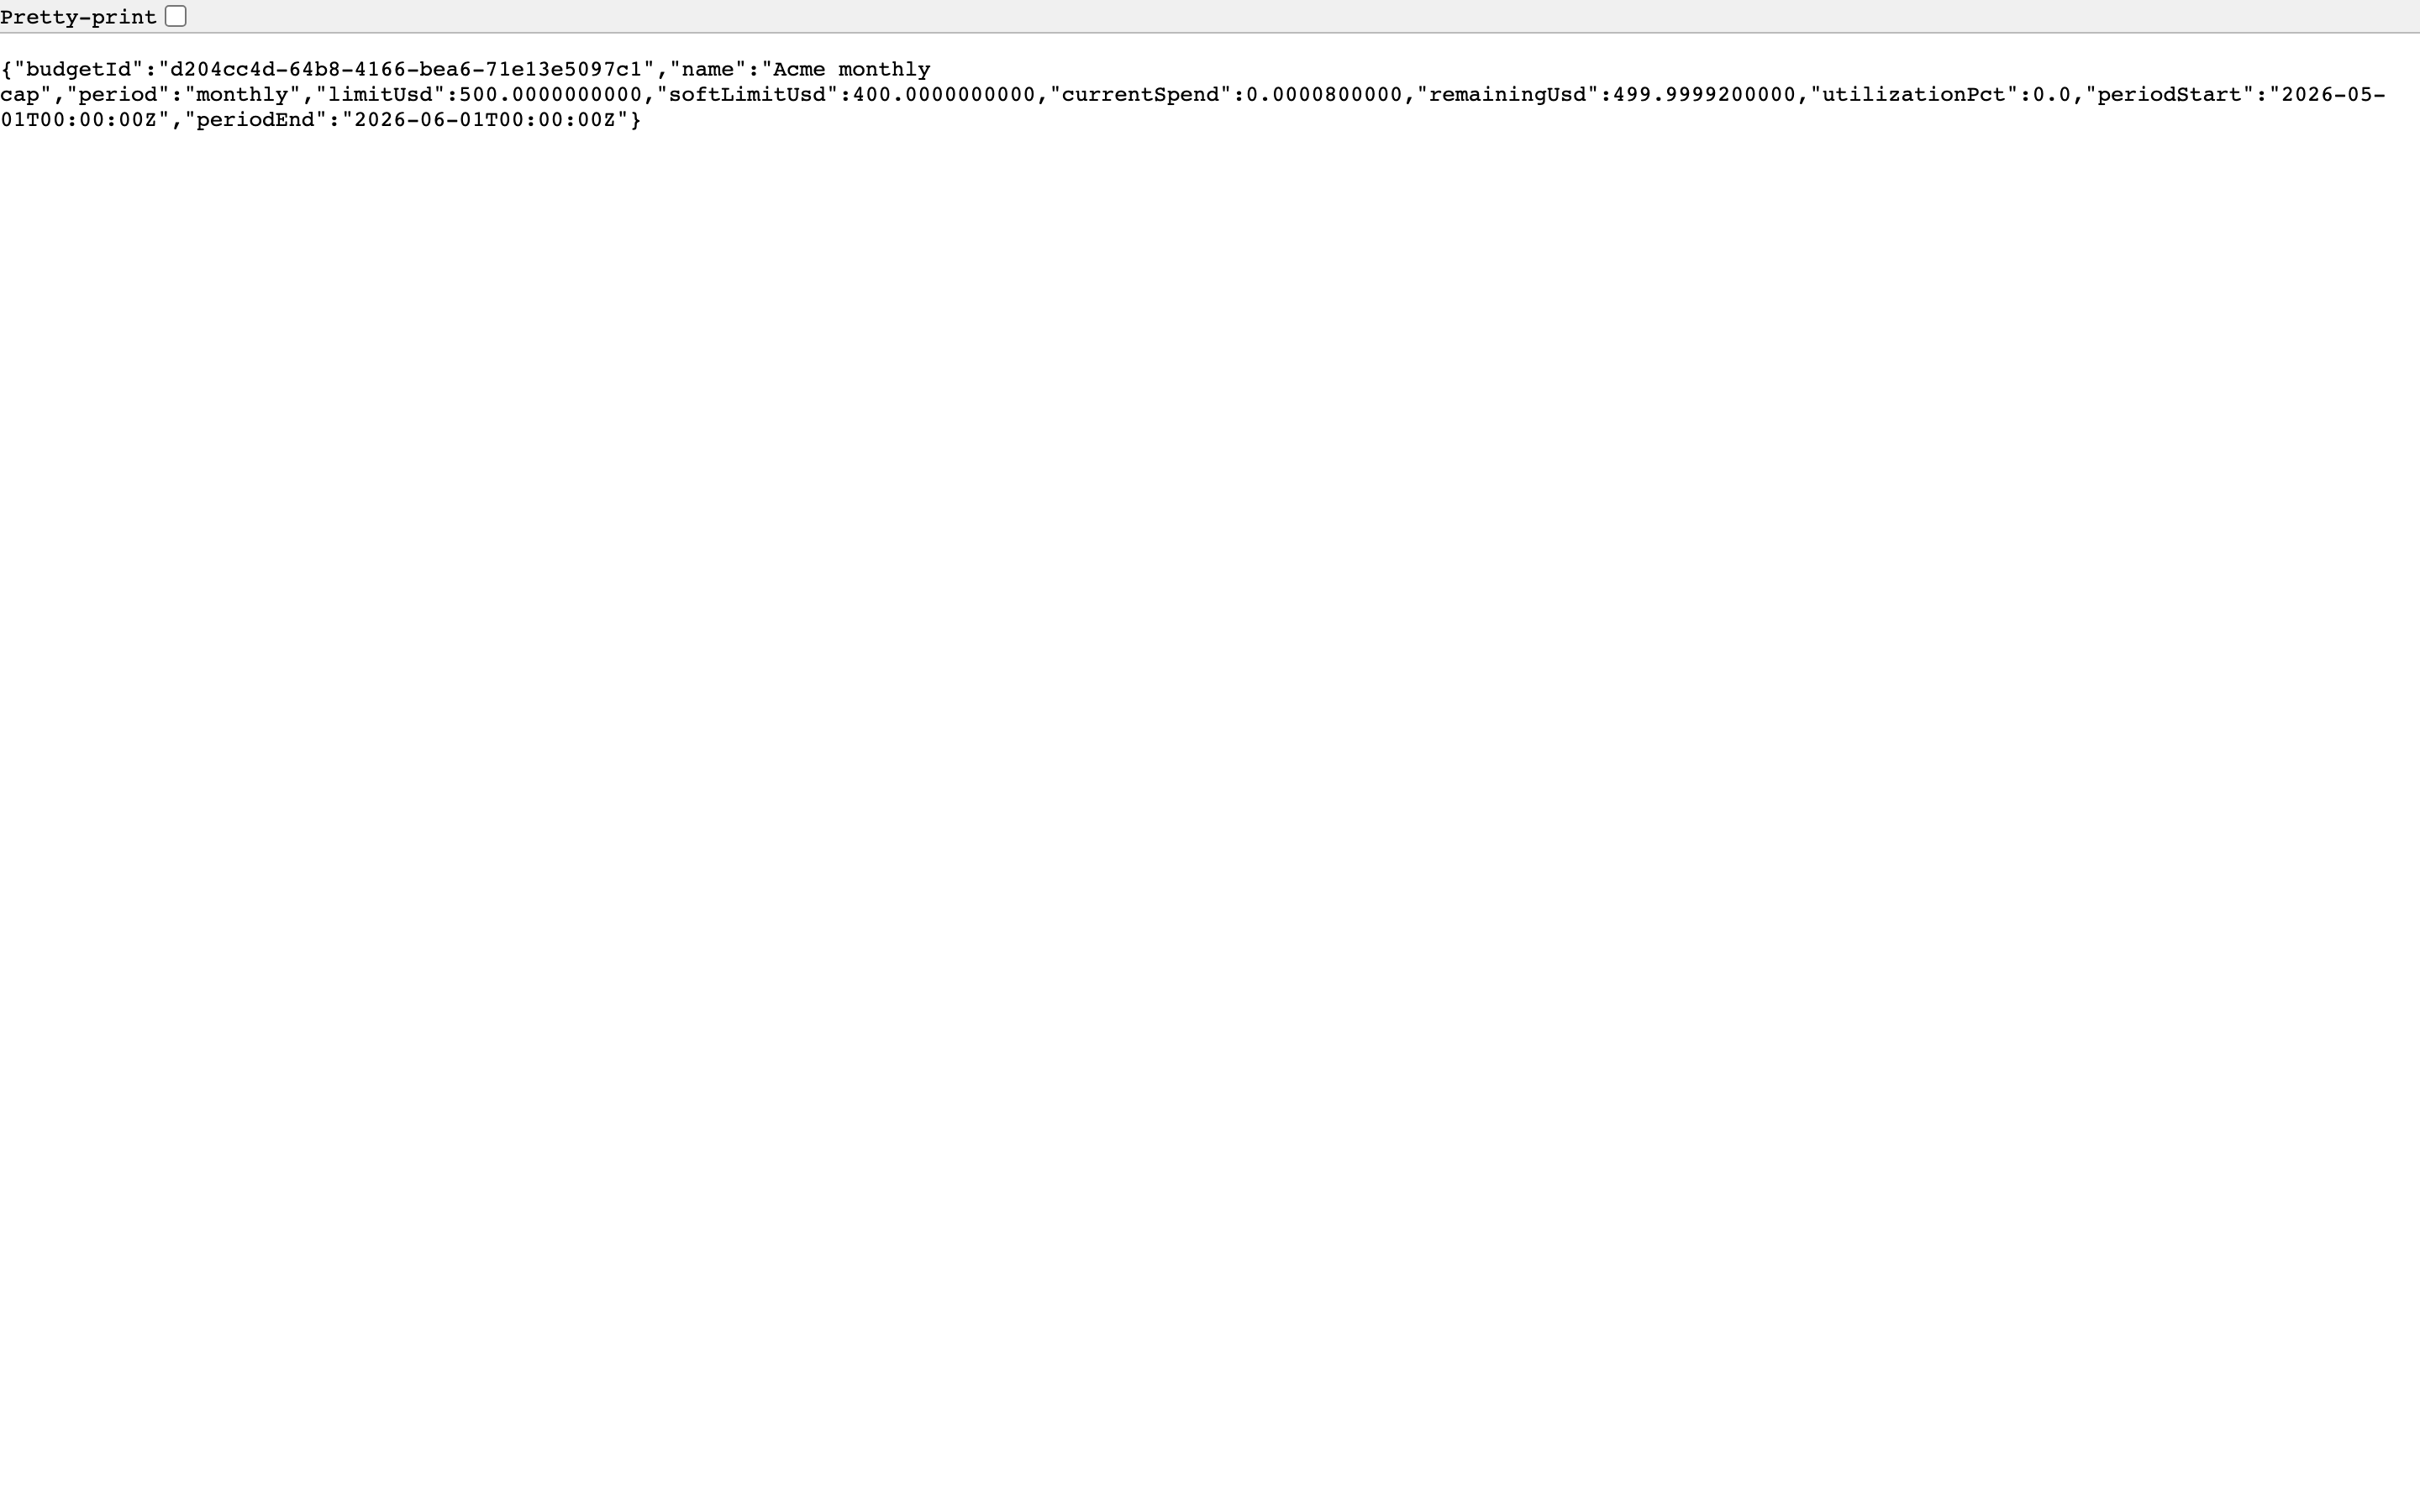
Budget status
Click the status icon on any budget row to view current period usage:
- Current Spend — amount spent in the current period
- Limit — configured limit
- Period Start / End — boundaries of the current budget period
- Utilization % — spend / limit percentage with a color-coded progress bar
- Remaining — dollars remaining before the hard limit
Click Delete to remove a budget cap. Requires confirmation.
Chargeback reports
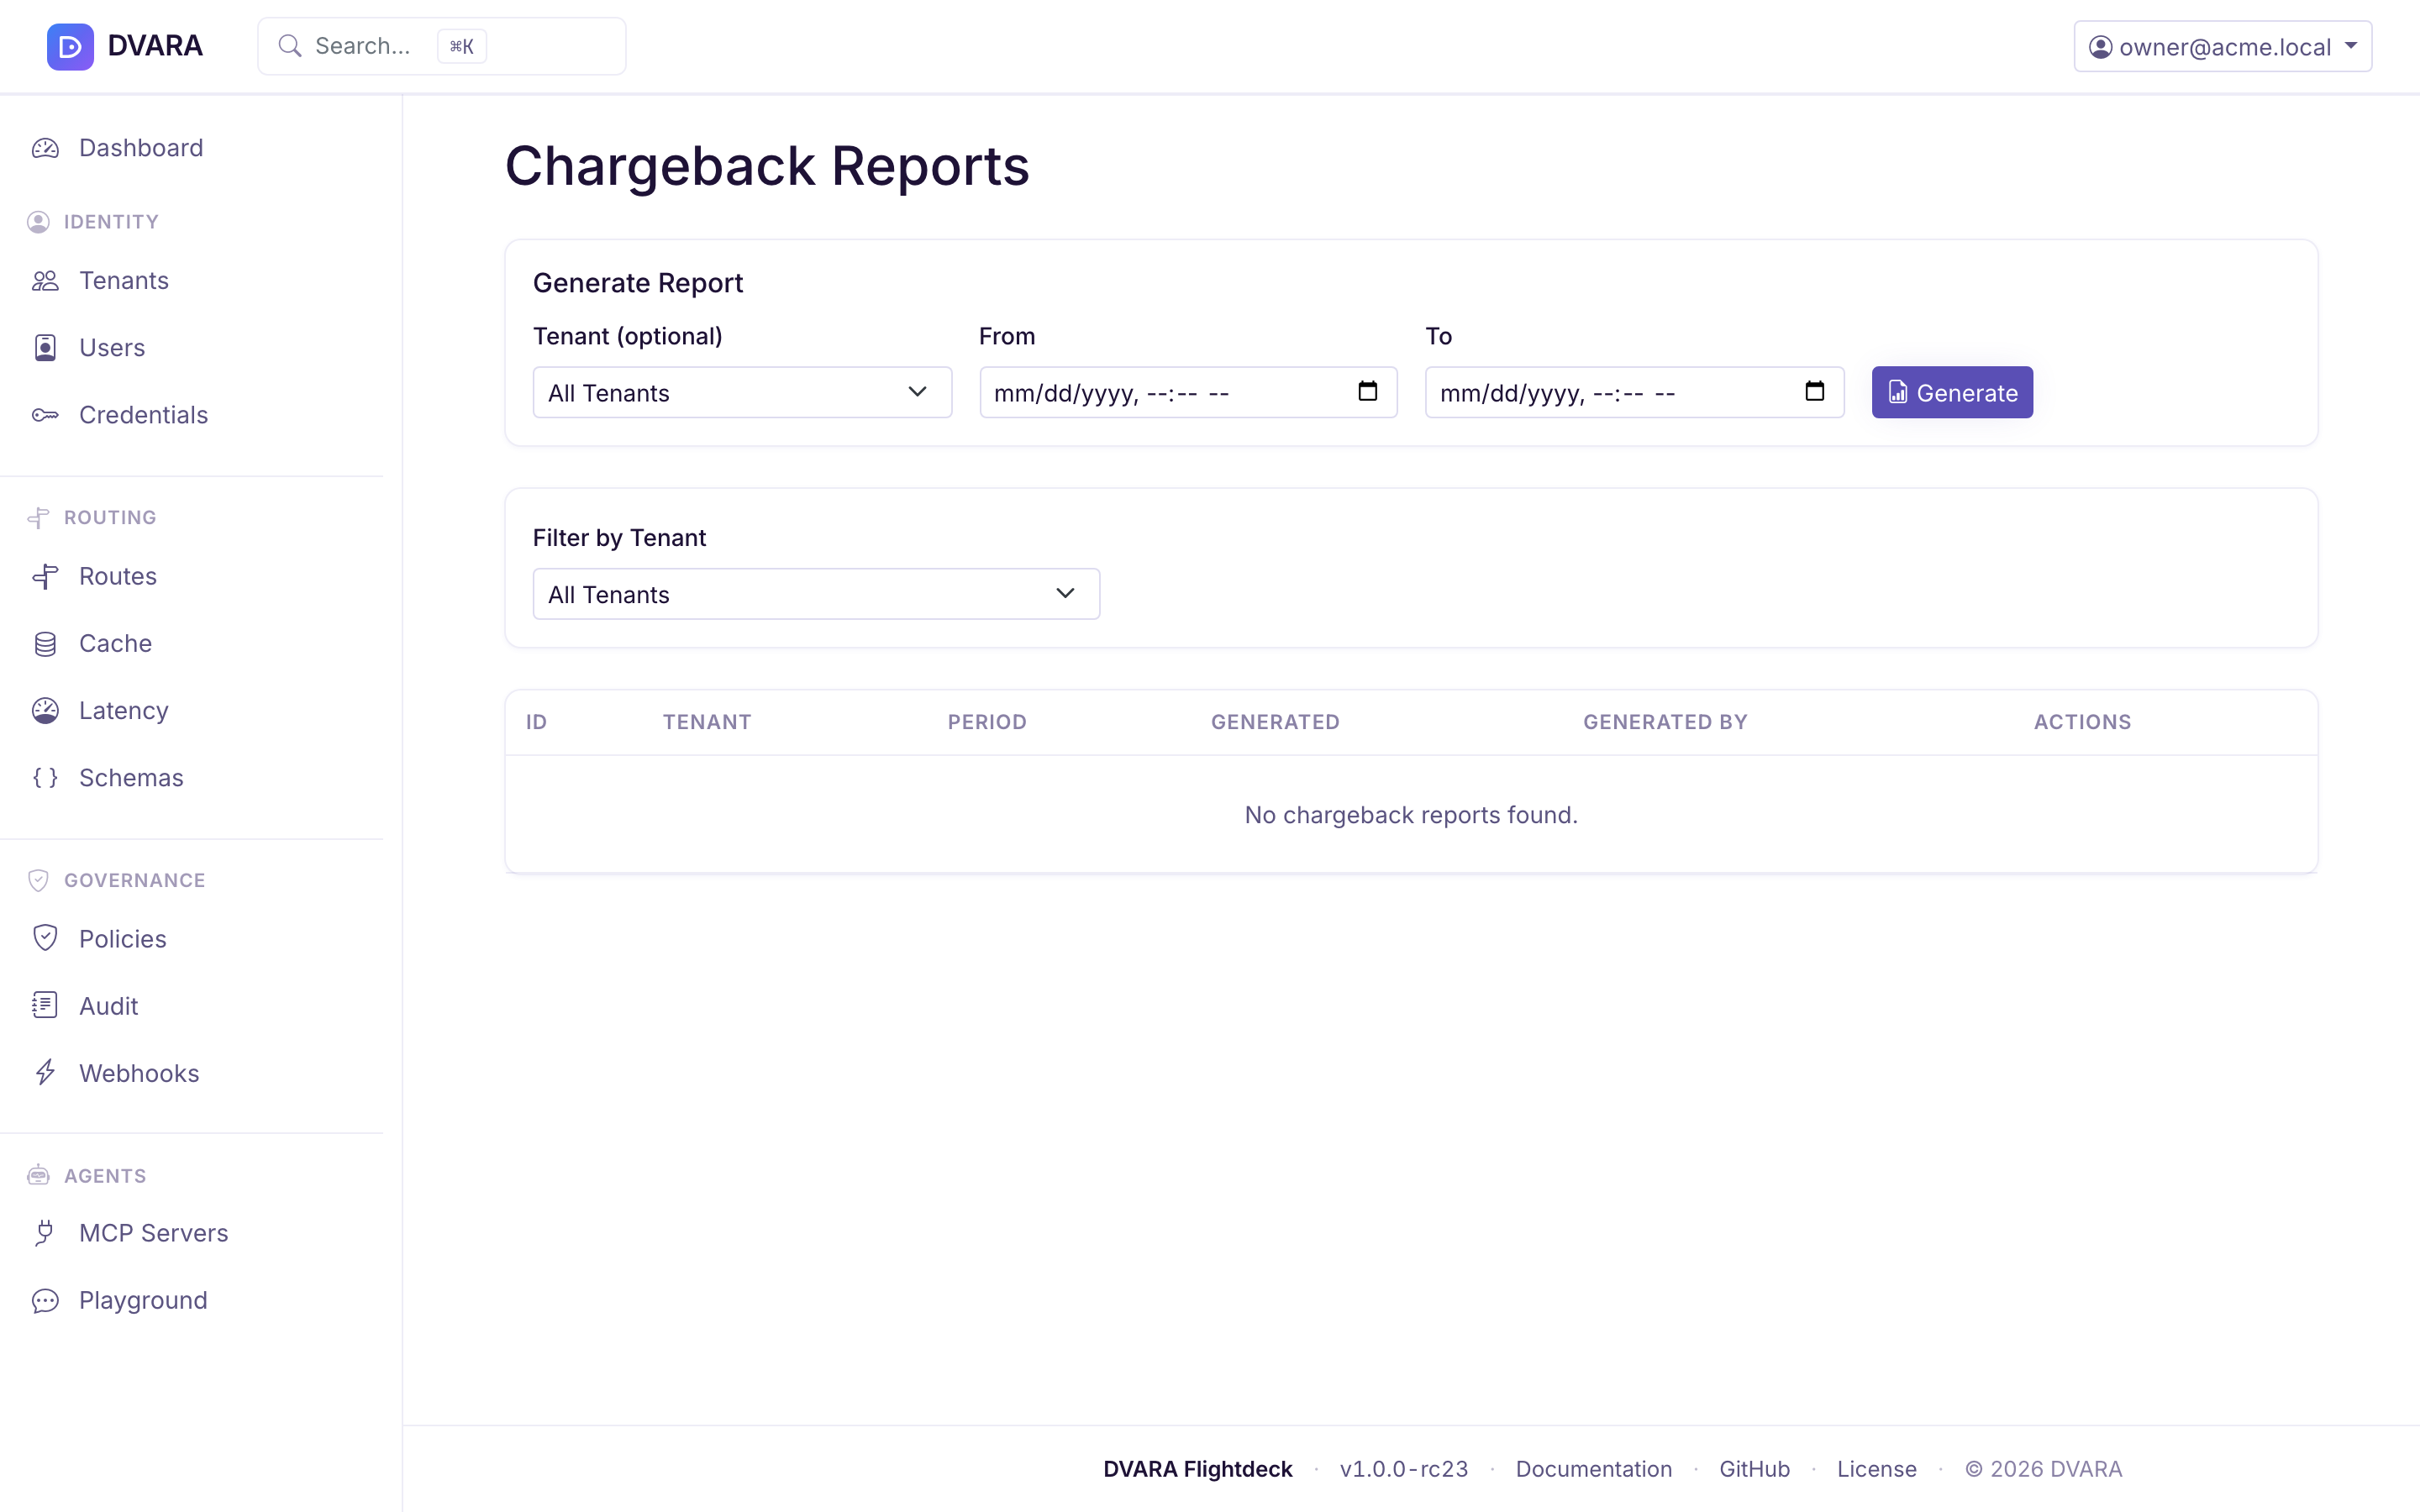
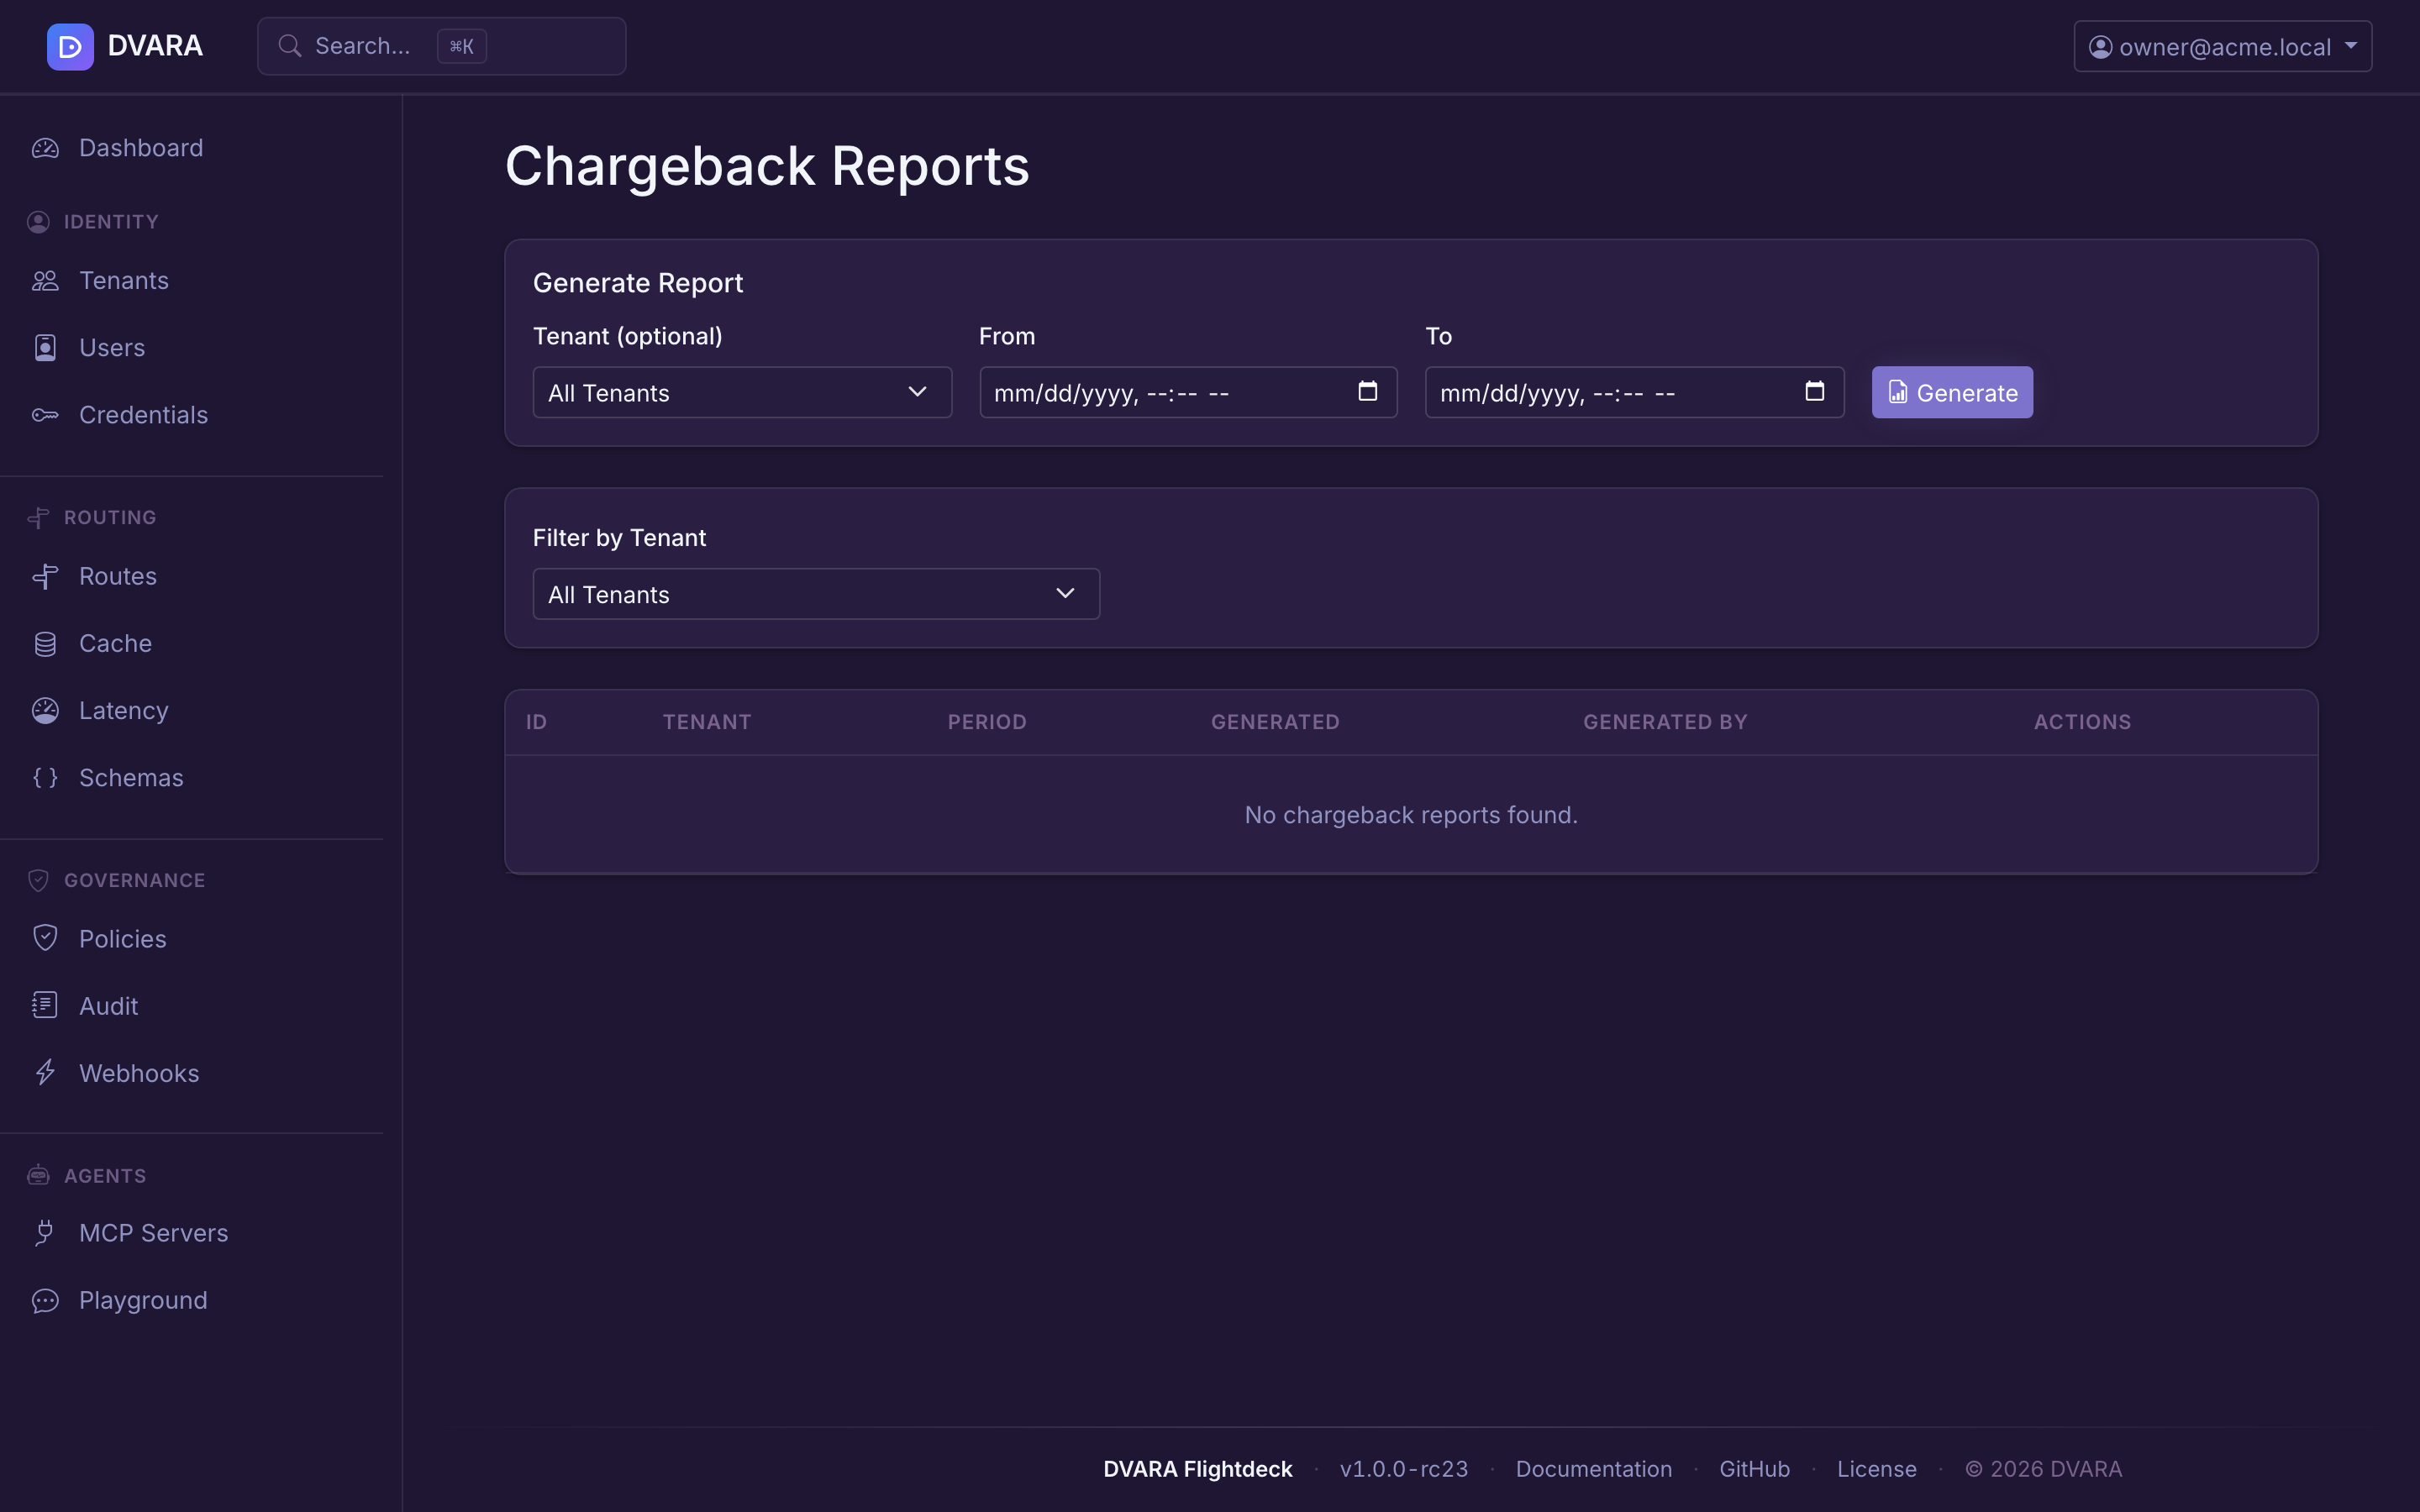
Open Cost → Chargeback Reports in the sidebar.
Report list
Lists every generated chargeback report with ID, tenant, period (from–to), generated date, and generated by. Auto-refreshes every 10 seconds.
Generate report
Click Generate to create a new chargeback report:
- Tenant ID — scope to a specific tenant (blank = all tenants)
- From / To — reporting period date range
The report includes seven sections: tenant summary, API key summary, model summary, provider summary, daily breakdown, forecasts, and anomalies.
Download
- PDF — click the PDF icon to download a formatted PDF report
- CSV — click the CSV icon to download raw data as CSV


Click Delete to remove a report. Requires confirmation.
Compliance reports
Open Cost → Compliance Reports in the sidebar.
Report list
Lists every compliance report with ID, type (SOC2 / HIPAA / GDPR / RBI / SEBI), tenant, period, generated date, and actions. Auto-refreshes every 10 seconds. Use the Type and Tenant dropdown filters to narrow the list.
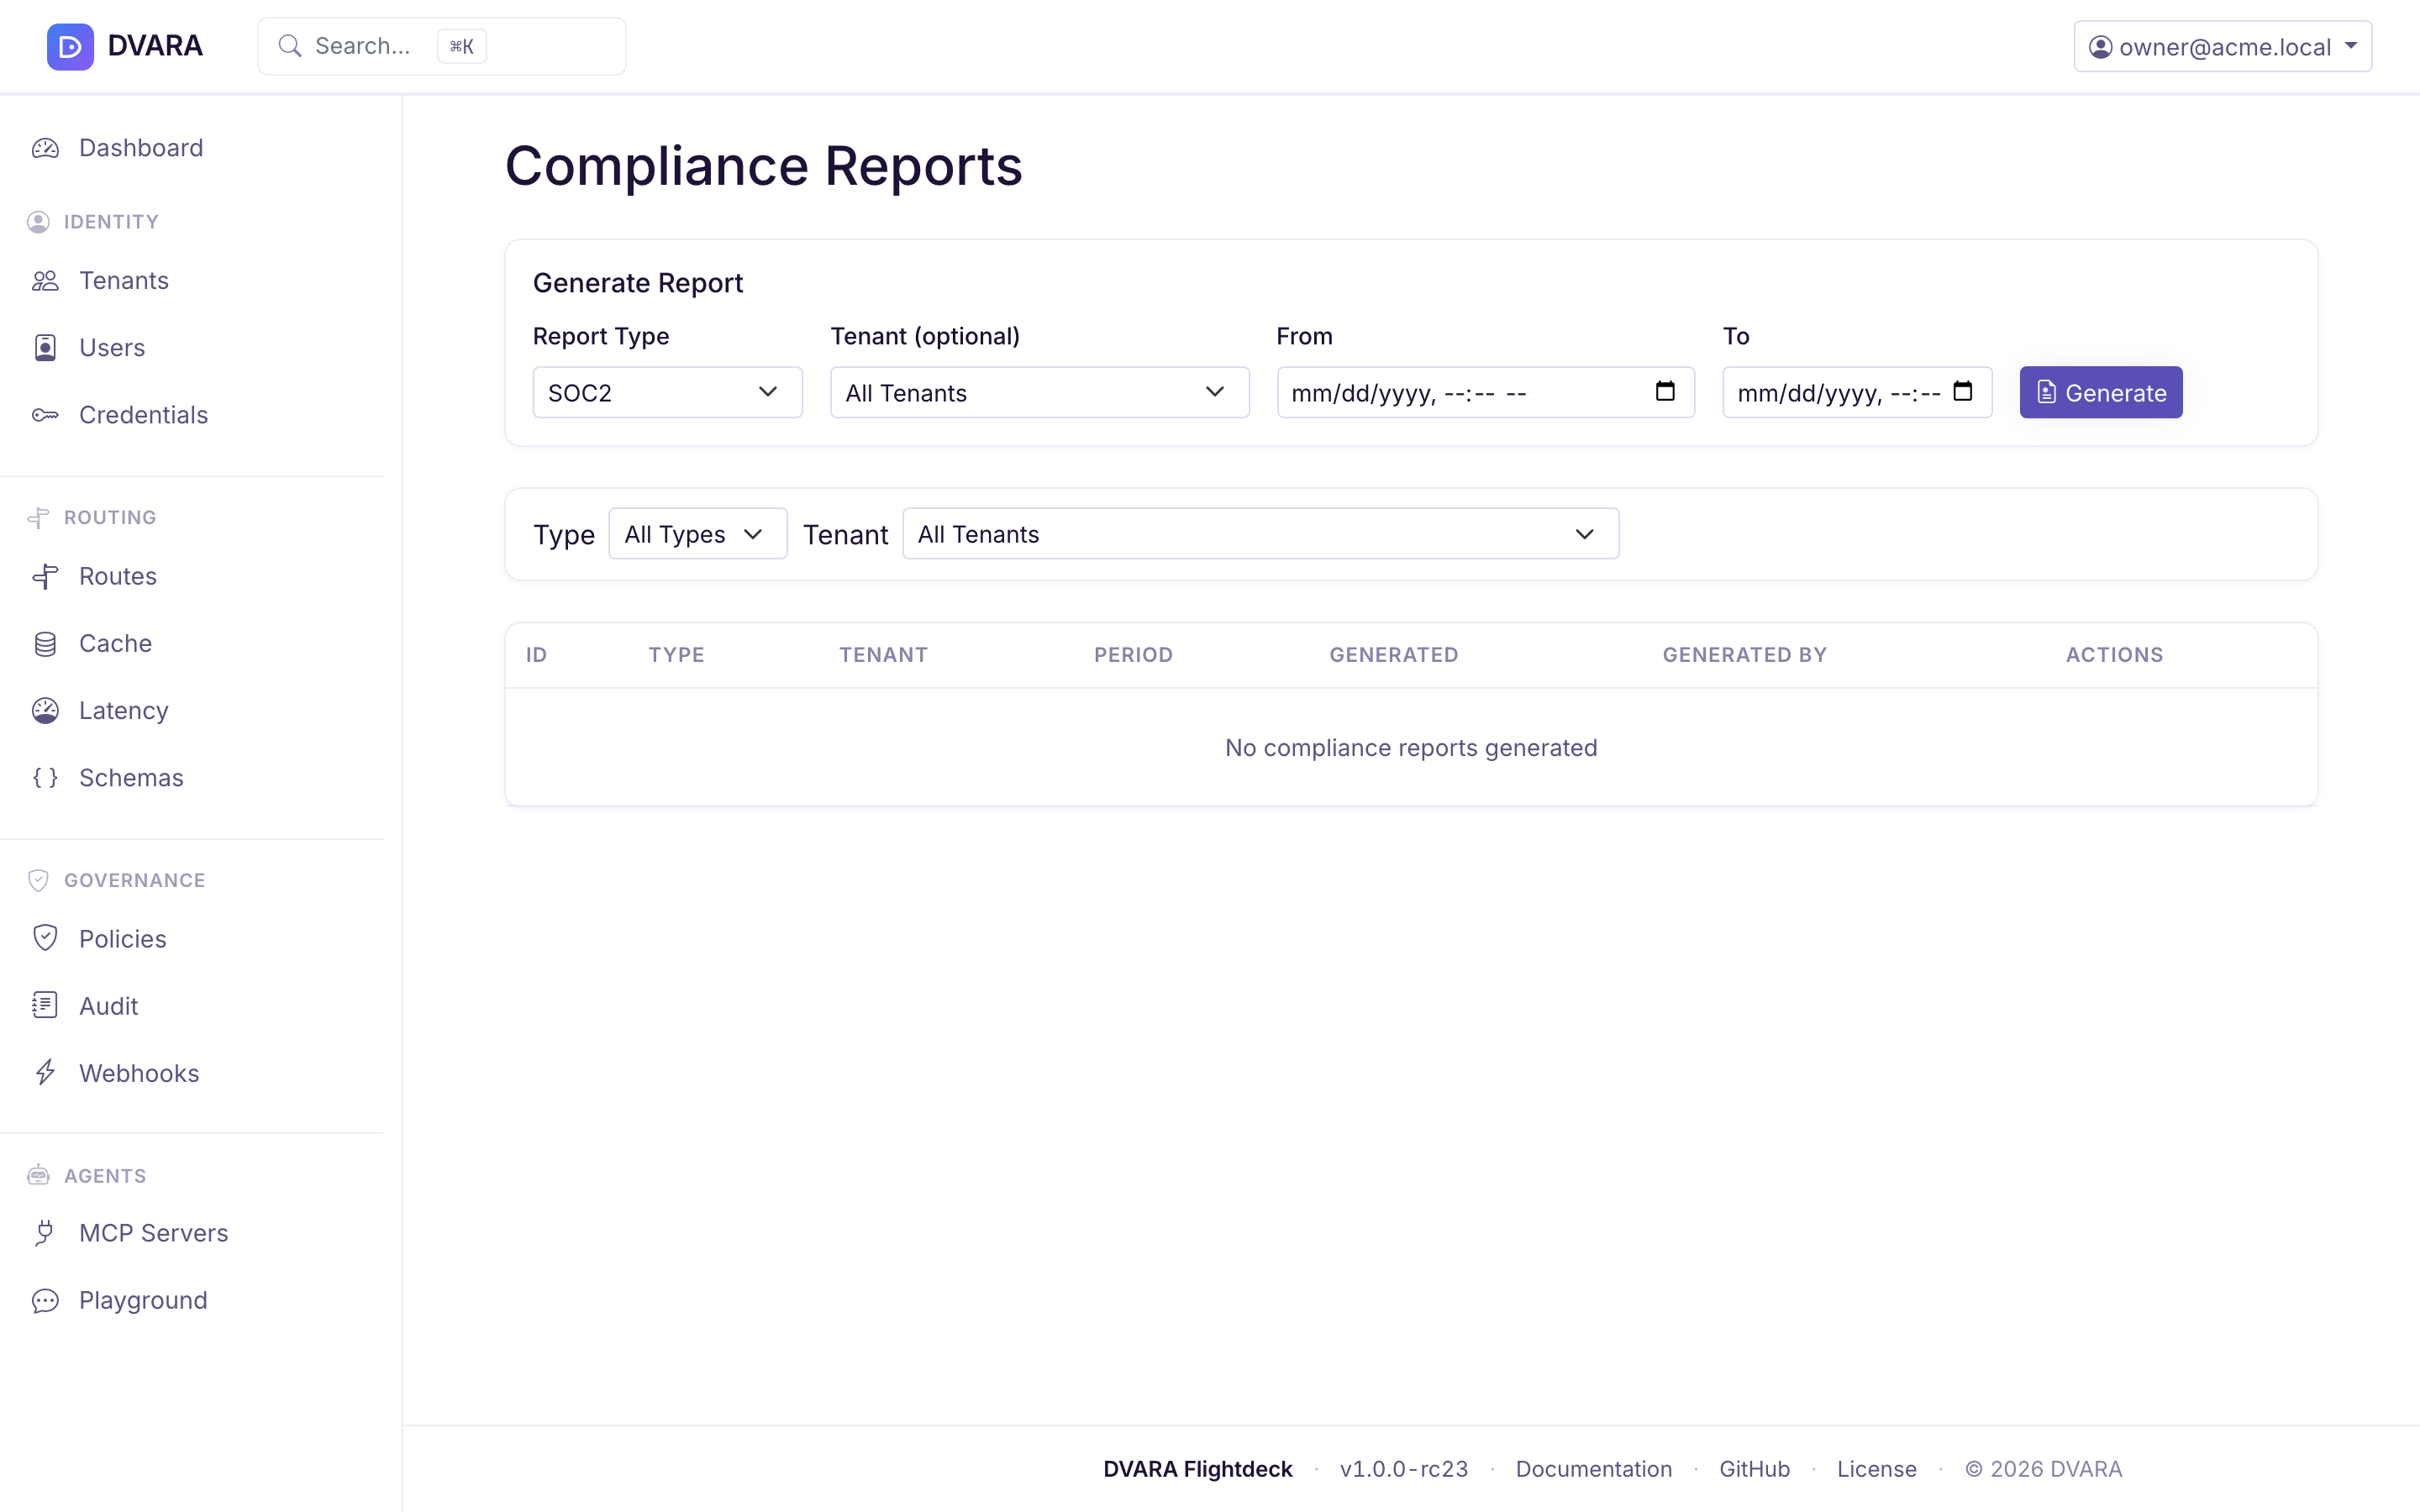
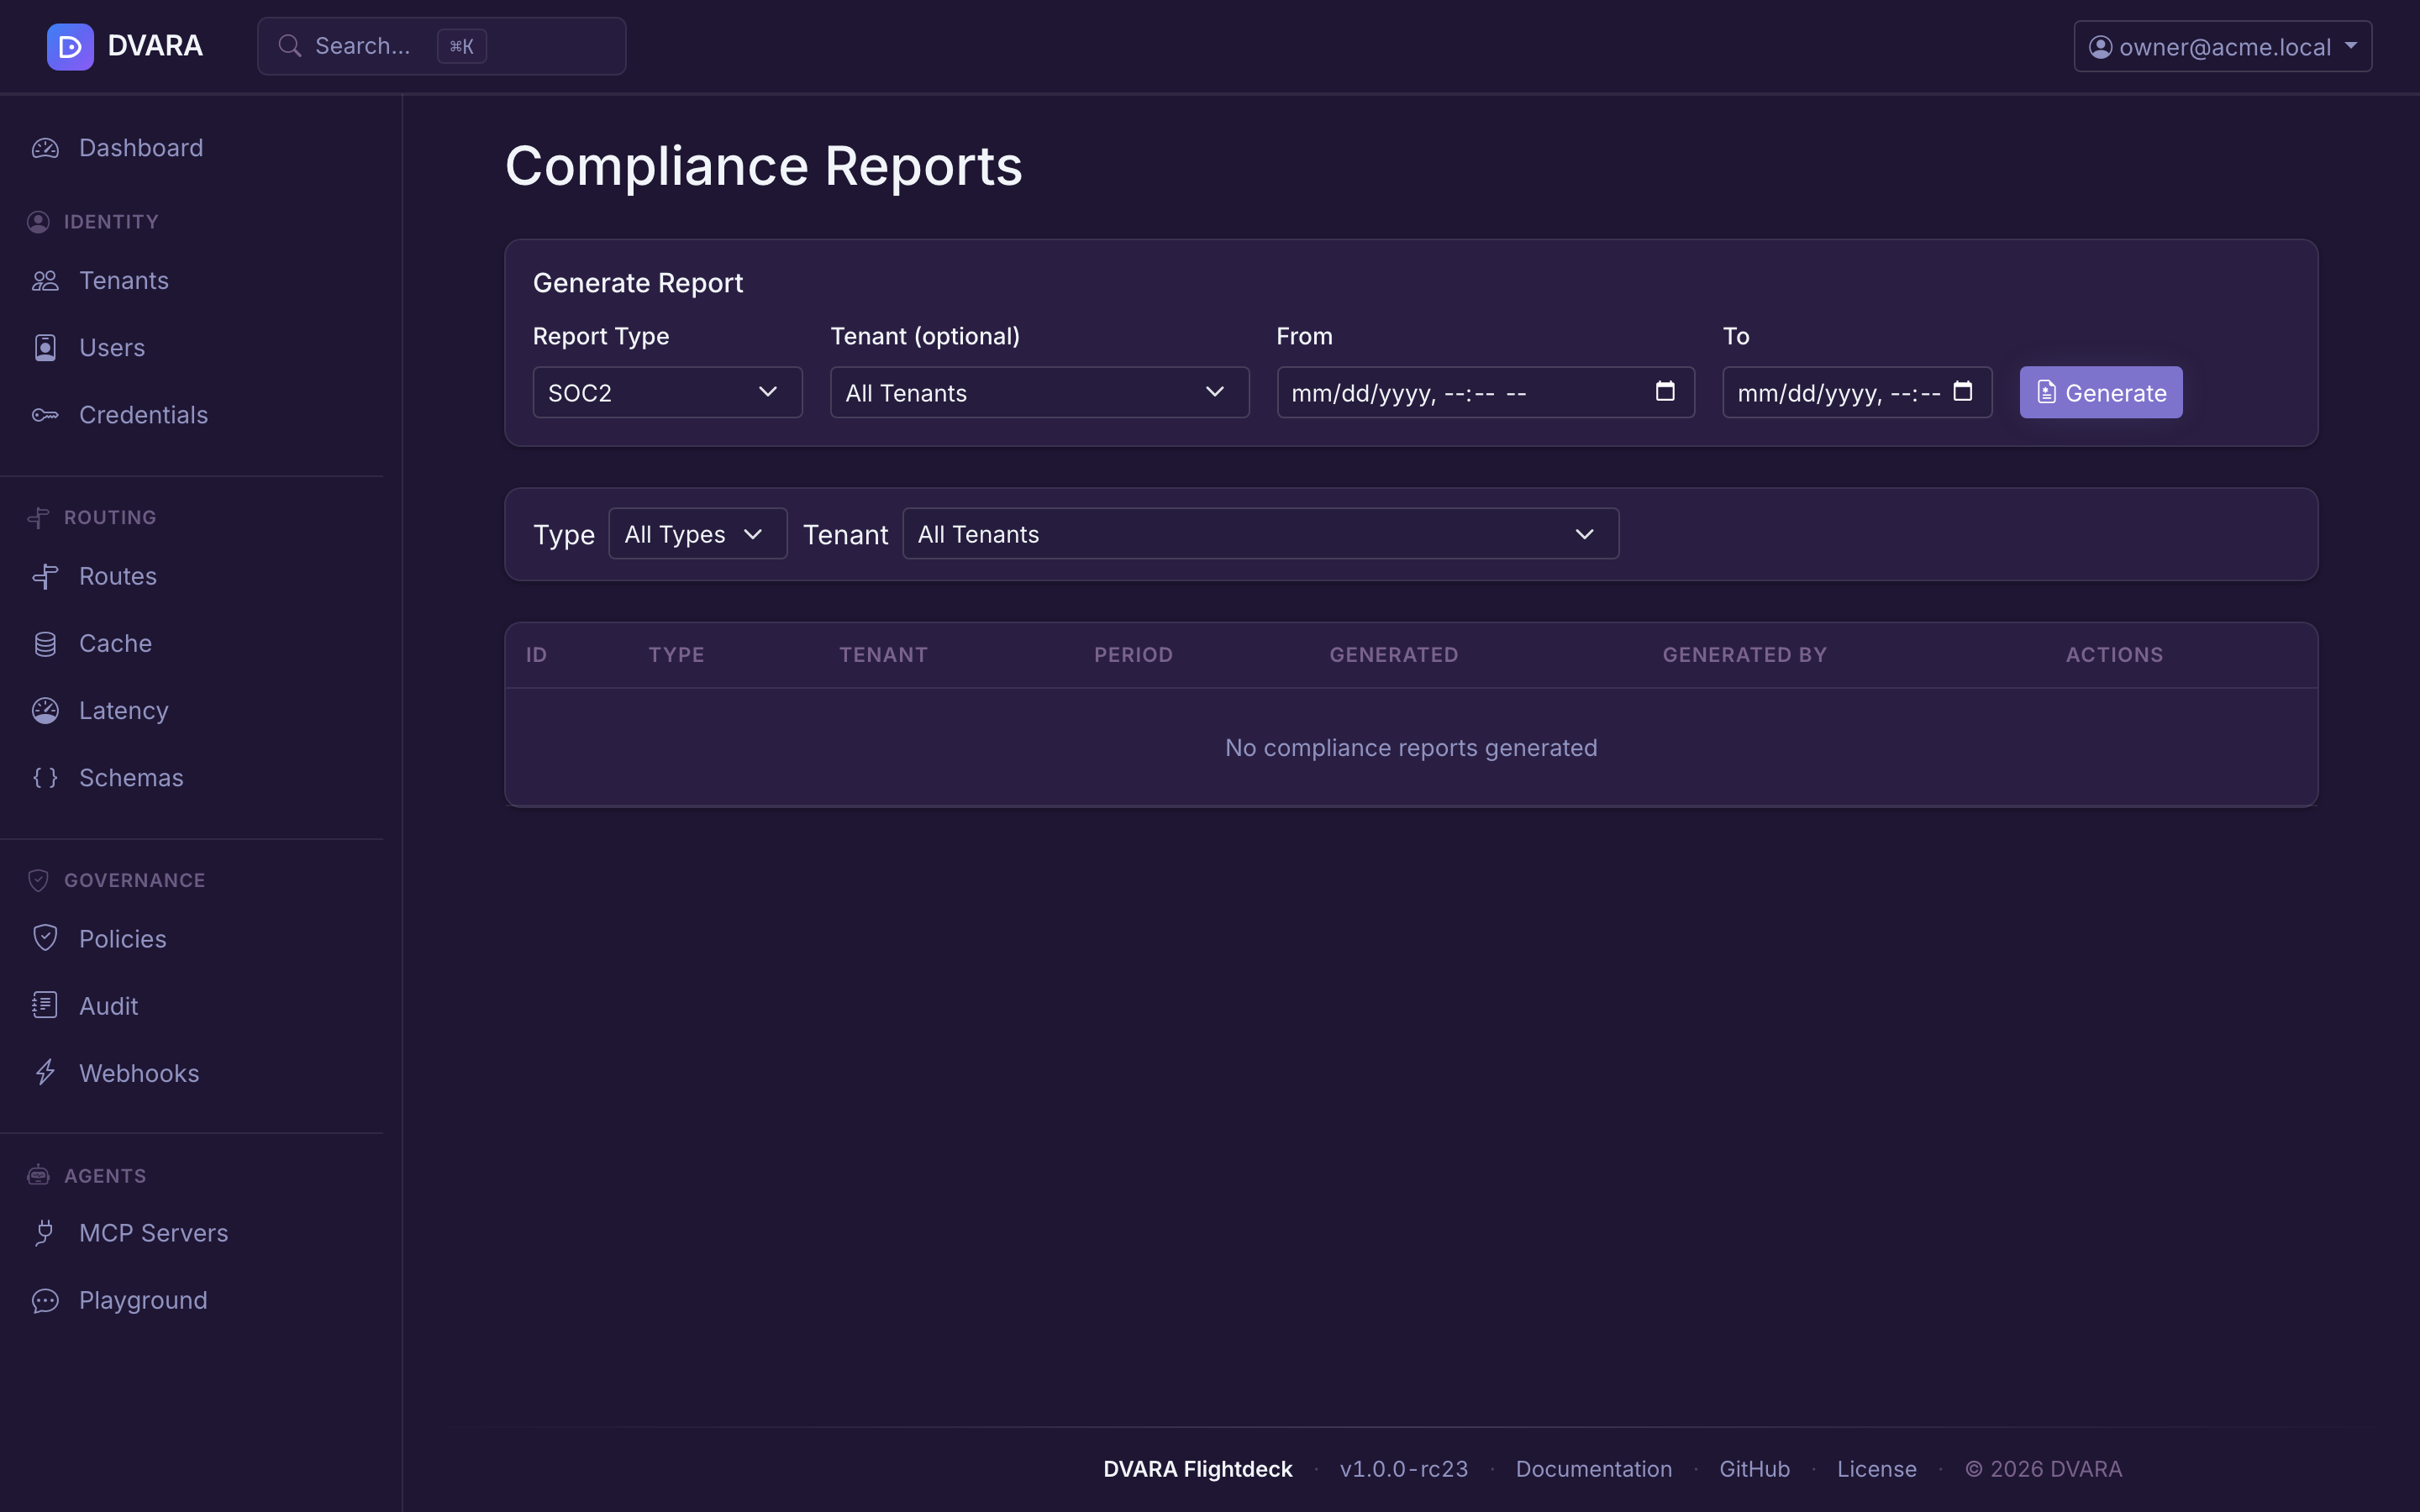
Generate report
Click Generate to create a new compliance report:
- Type — SOC2 Type II, HIPAA, GDPR, or India RBI / SEBI
- Tenant ID — scope to a specific tenant (blank = all tenants)
- From / To — reporting period date range
Report contents by type:
| SOC2 | HIPAA | GDPR |
|---|---|---|
| Audit chain integrity | Access log | Data processing activities |
| Access control summary | Authorization log | Tenant data residency |
| Policy enforcement summary | Policy violations | Consent and policy status |
| Data residency | Data access patterns | Data retention |
| Token usage summary | Audit integrity | Audit integrity |
| Event count by type |
The India RBI and SEBI reports share a common section set — data localization (residency), tamper-evident audit-chain integrity, access control, policy enforcement, and token usage — with regulator-specific framing (RBI emphasizes data localization; SEBI emphasizes recordkeeping and audit trail). Scheduled generation is configured via dvara.flightdeck.compliance.rbi-schedule / .sebi-schedule.
Click the PDF icon to download the compliance report as a formatted PDF. Click Delete to remove a report (requires confirmation).