Agents & MCP
Not included in DVARA Open Source.
The sidebar's Agents section groups every page related to Model Context Protocol server governance and agentic workflow oversight: MCP Servers, Tool Calls, Sessions, Approval Queue, and Analytics. (The Playground is a separate top-level destination beside Dashboard, gated by dvara.flightdeck.playground.enabled.)
MCP servers
Open Agents → MCP Servers in the sidebar.
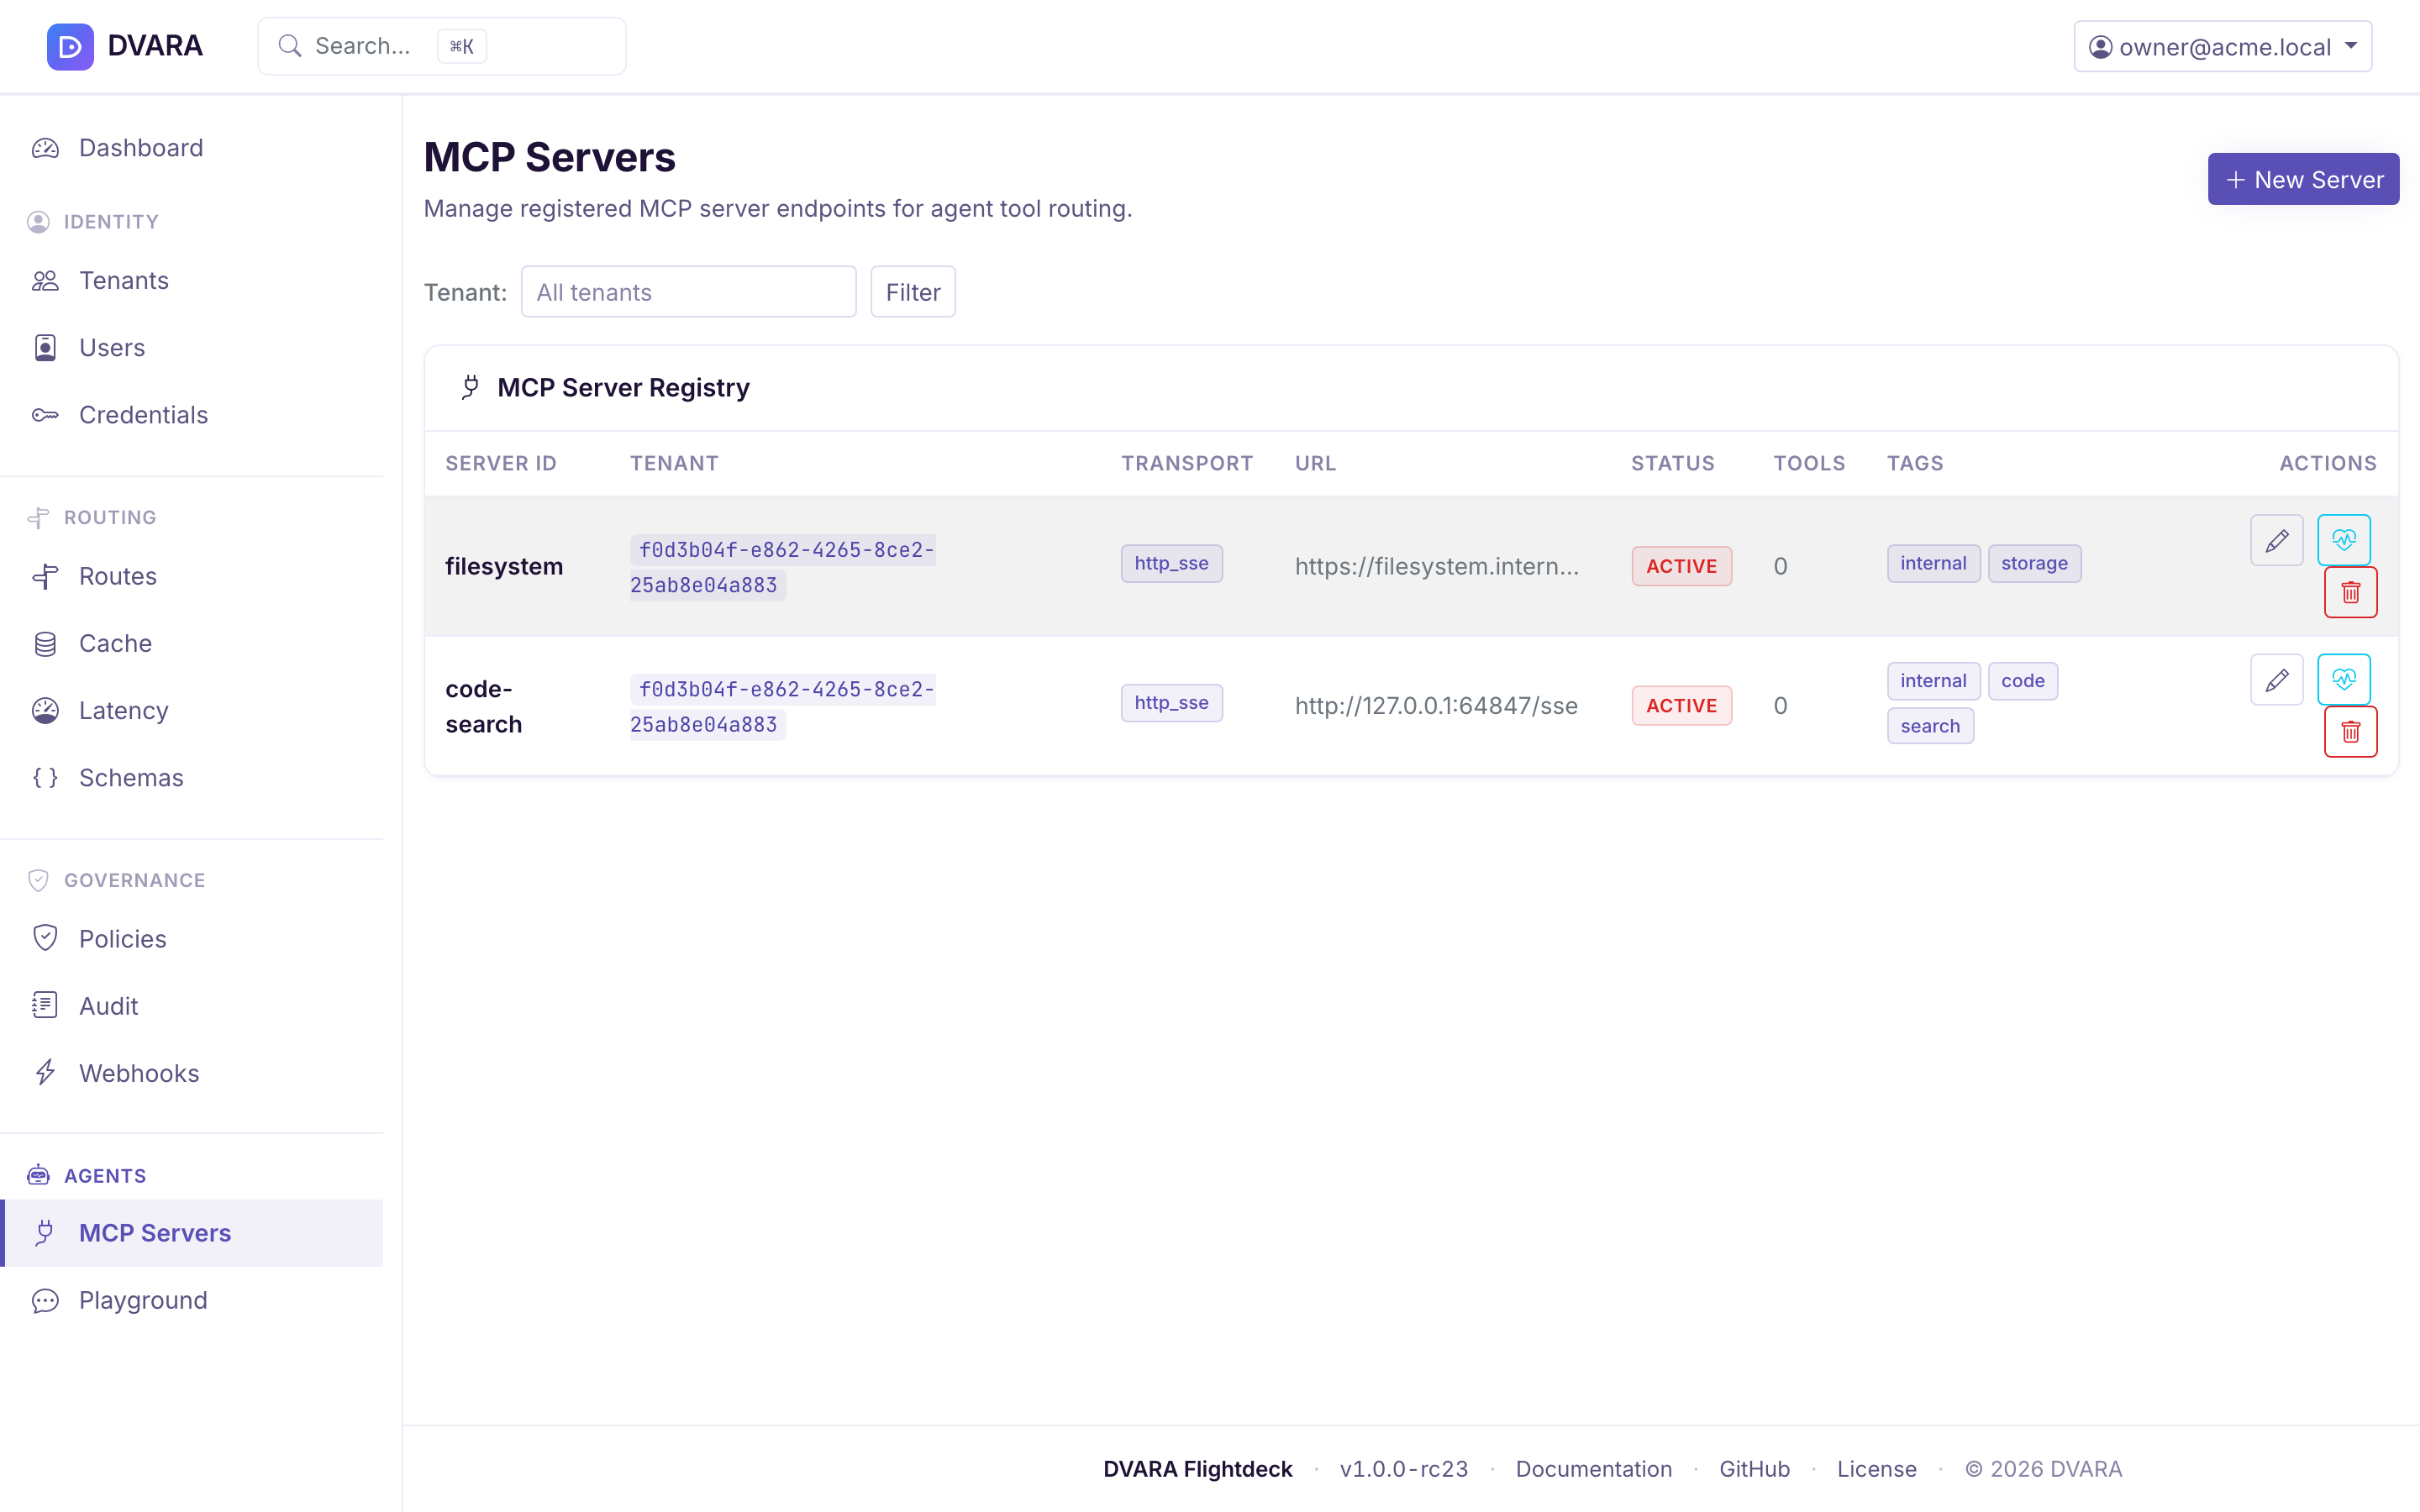
Server list
Lists every registered MCP server with server ID, workspace, transport type, URL, status (color-coded pill — green for ACTIVE, amber for SUSPENDED, red for DISABLED), tool count, tags, and actions. Auto-refreshes every 10 seconds. Use the Workspace dropdown filter to narrow the list.
Create / edit server
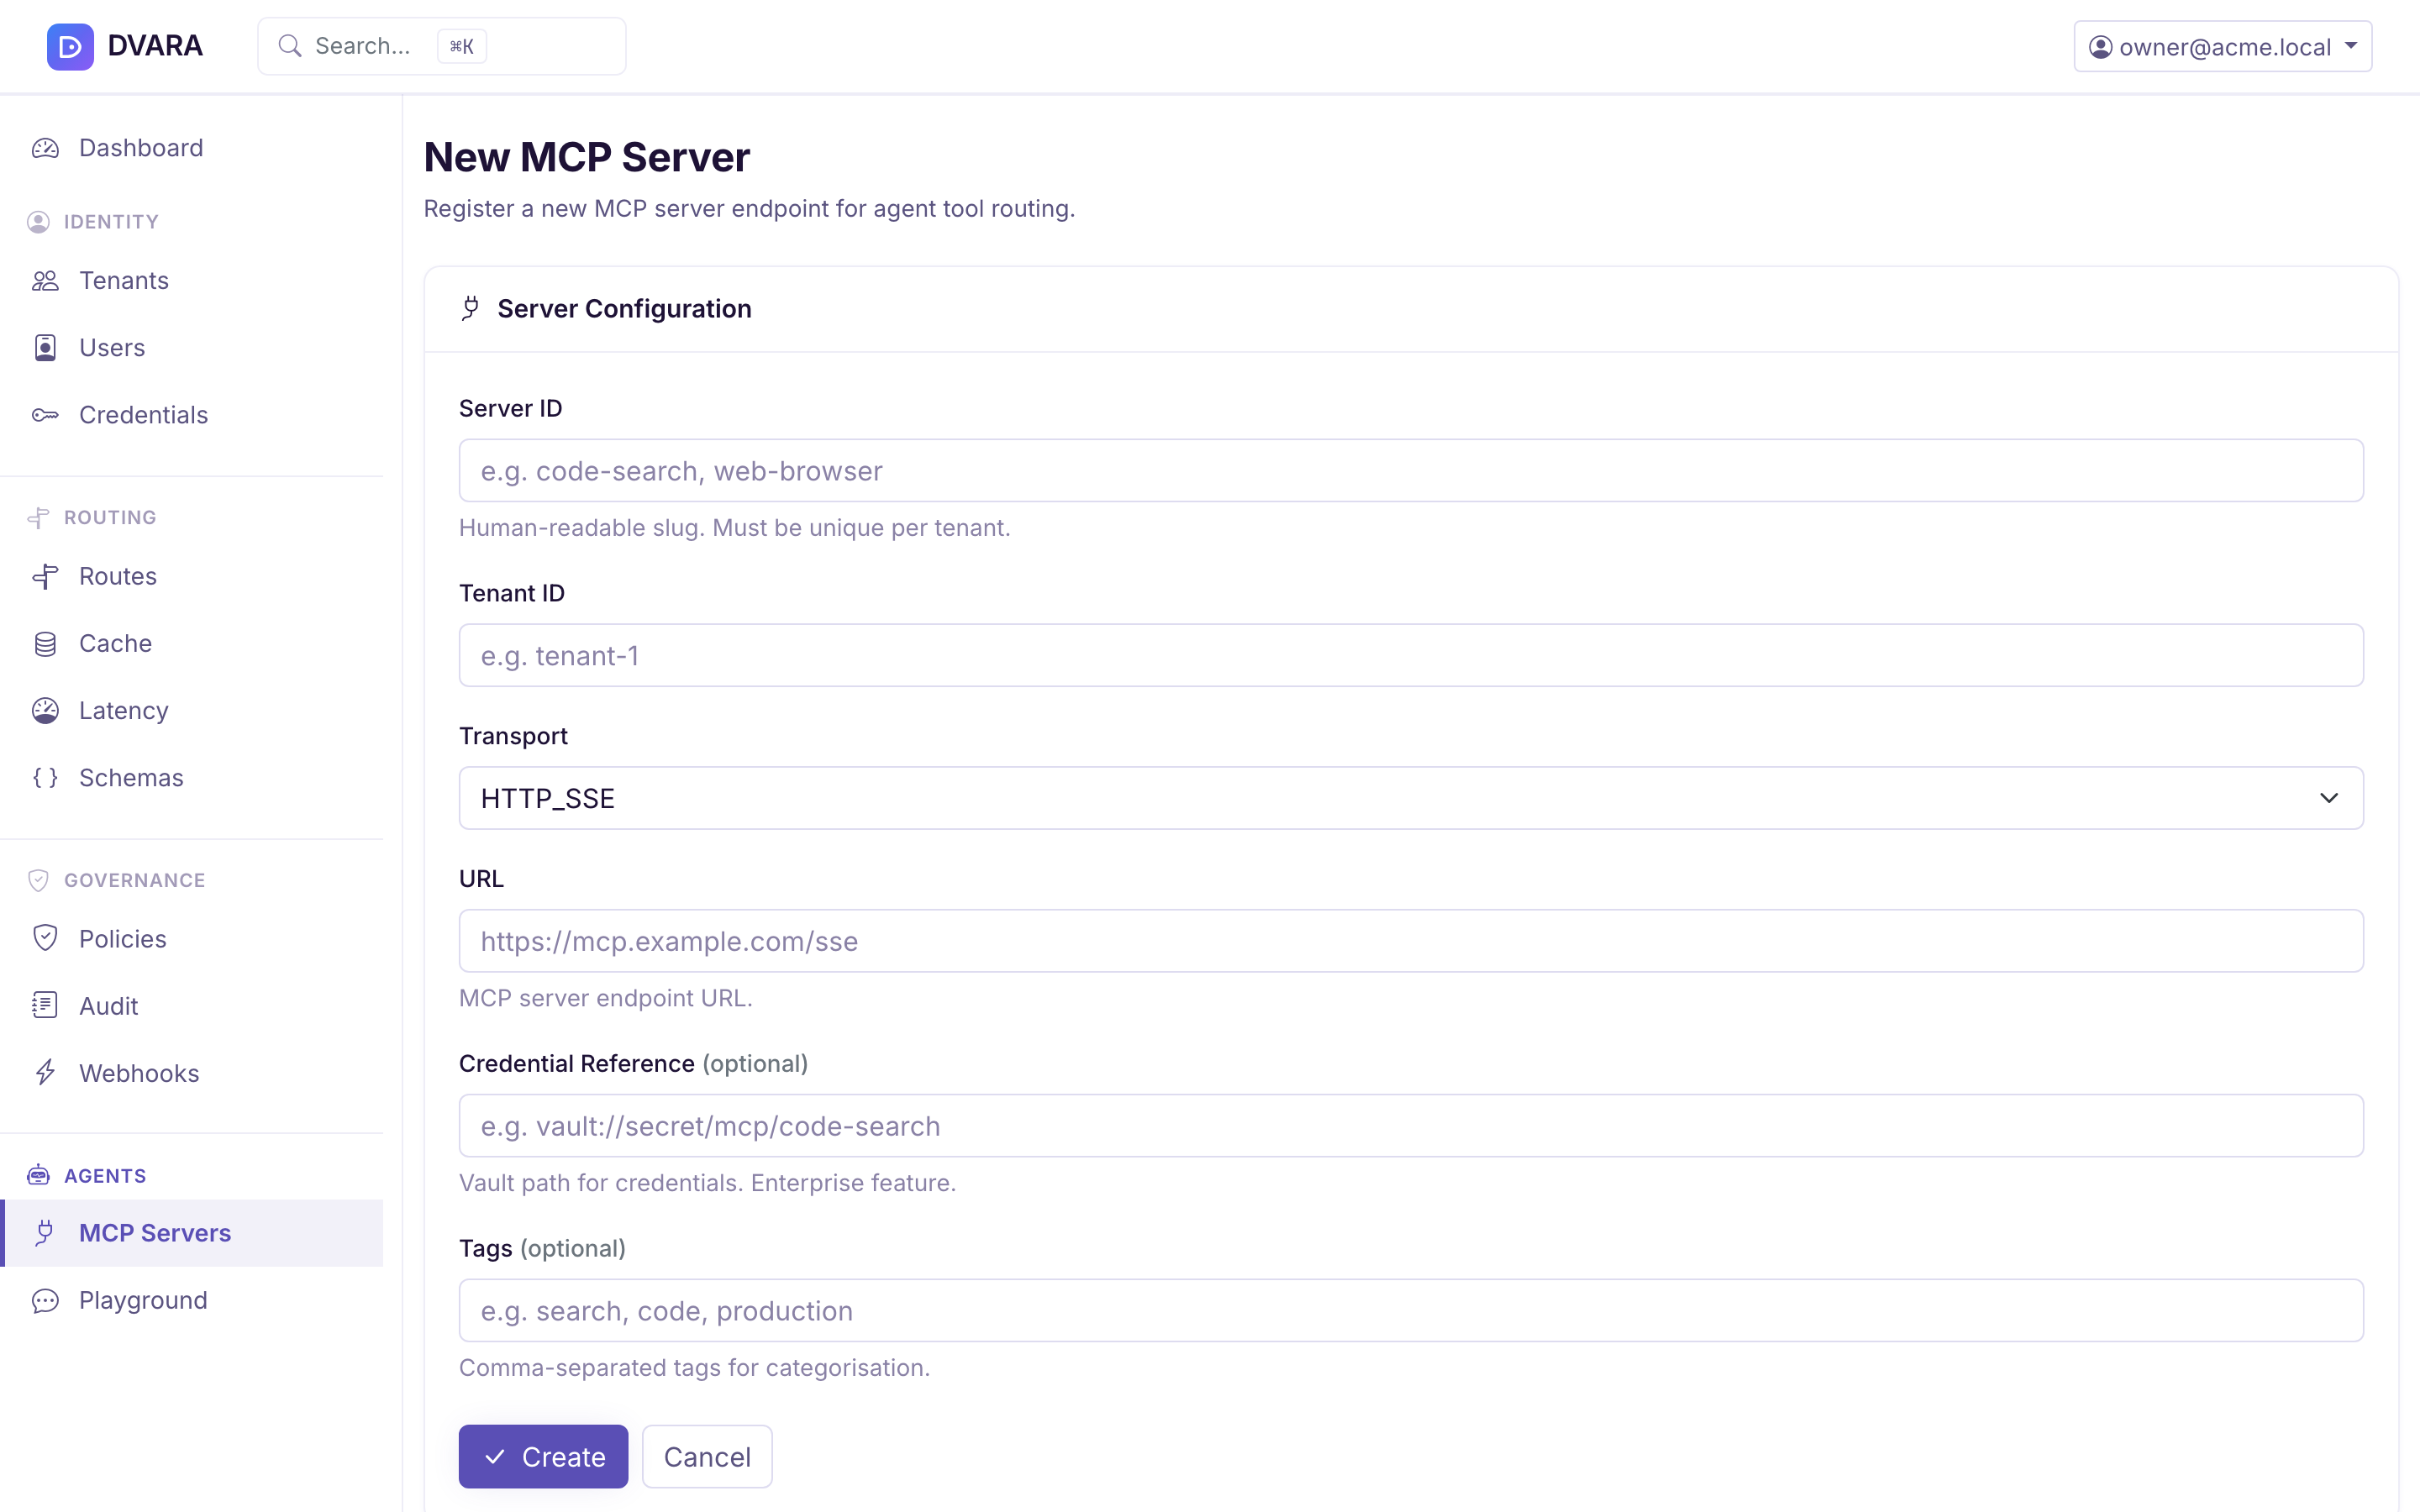
Click New Server to register a new MCP server with:
- Server ID — human-readable slug, unique per workspace (e.g.
code-search,web-browser) - Workspace ID — the workspace this server belongs to (required on create)
- Transport — the protocol used to reach the server:
STREAMABLE_HTTP(native MCP, the modern default),SSE(native MCP over legacy HTTP+SSE),REST(DVARA's bespoke REST shape), orREST_BRIDGE(expose a plain REST/OpenAPI API as governed MCP tools — see below) - URL — MCP server endpoint URL (required). Must be a public endpoint — private, loopback, link-local, and cloud-metadata addresses are rejected at save.
- OpenAPI Spec / Auth Header — shown only when transport is
REST_BRIDGE. The spec (required) is what DVARA synthesizes MCP tools from; the auth header (optional) is forwarded on each bridged upstream call. The header is write-only after save: leave the mask unchanged to keep it or enter a replacement. With an encryption master password set it is encrypted at rest; otherwise startup warns that it remains plaintext. - Credential Ref — the name of a credential stored in this server's workspace. It cannot name a vault path, a platform credential, or another workspace's credential.
- Auth Mode — how the upstream call is authenticated:
STORED(default — DVARA resolves the server's own Credential Ref) orDELEGATED(on-behalf-of — DVARA forwards the caller'sX-DVARA-Delegated-Authorizationtoken so the upstream enforces that end user's permissions; aDELEGATEDserver called without the token is rejected withMCP_DELEGATED_TOKEN_REQUIRED). See Native MCP → Delegated auth. - Tags — comma-separated tags for categorization (optional)
- Status — ACTIVE, SUSPENDED, or DISABLED (edit only)
A Server ID the workspace already uses is refused with mcp_server_duplicate.
From 1.8.4 the refusal shows on the form itself, naming the ID, and every value
you entered stays, except a REST bridge auth header, which is not sent back
because it can hold a token. Before 1.8.4 the reason appeared only in a passing
toast and the form came back empty.
The gateway connects to the MCP server URL server-side — on health
check, on tool sync, and on every tool call routed through the gateway. When a
workspace registers a server through workspace self-service, the URL is validated
at save time: it must be an http/https endpoint that does not resolve
to a loopback, private, link-local, or cloud-metadata address (e.g.
127.0.0.1, 10.0.0.0/8, 192.168.0.0/16, 169.254.169.254). Tool sync in
particular returns the upstream response, so this prevents a workspace using a
registered server as a server-side request forgery primitive to read internal
services or cloud metadata. As defense-in-depth, operators should also run a
network egress policy.
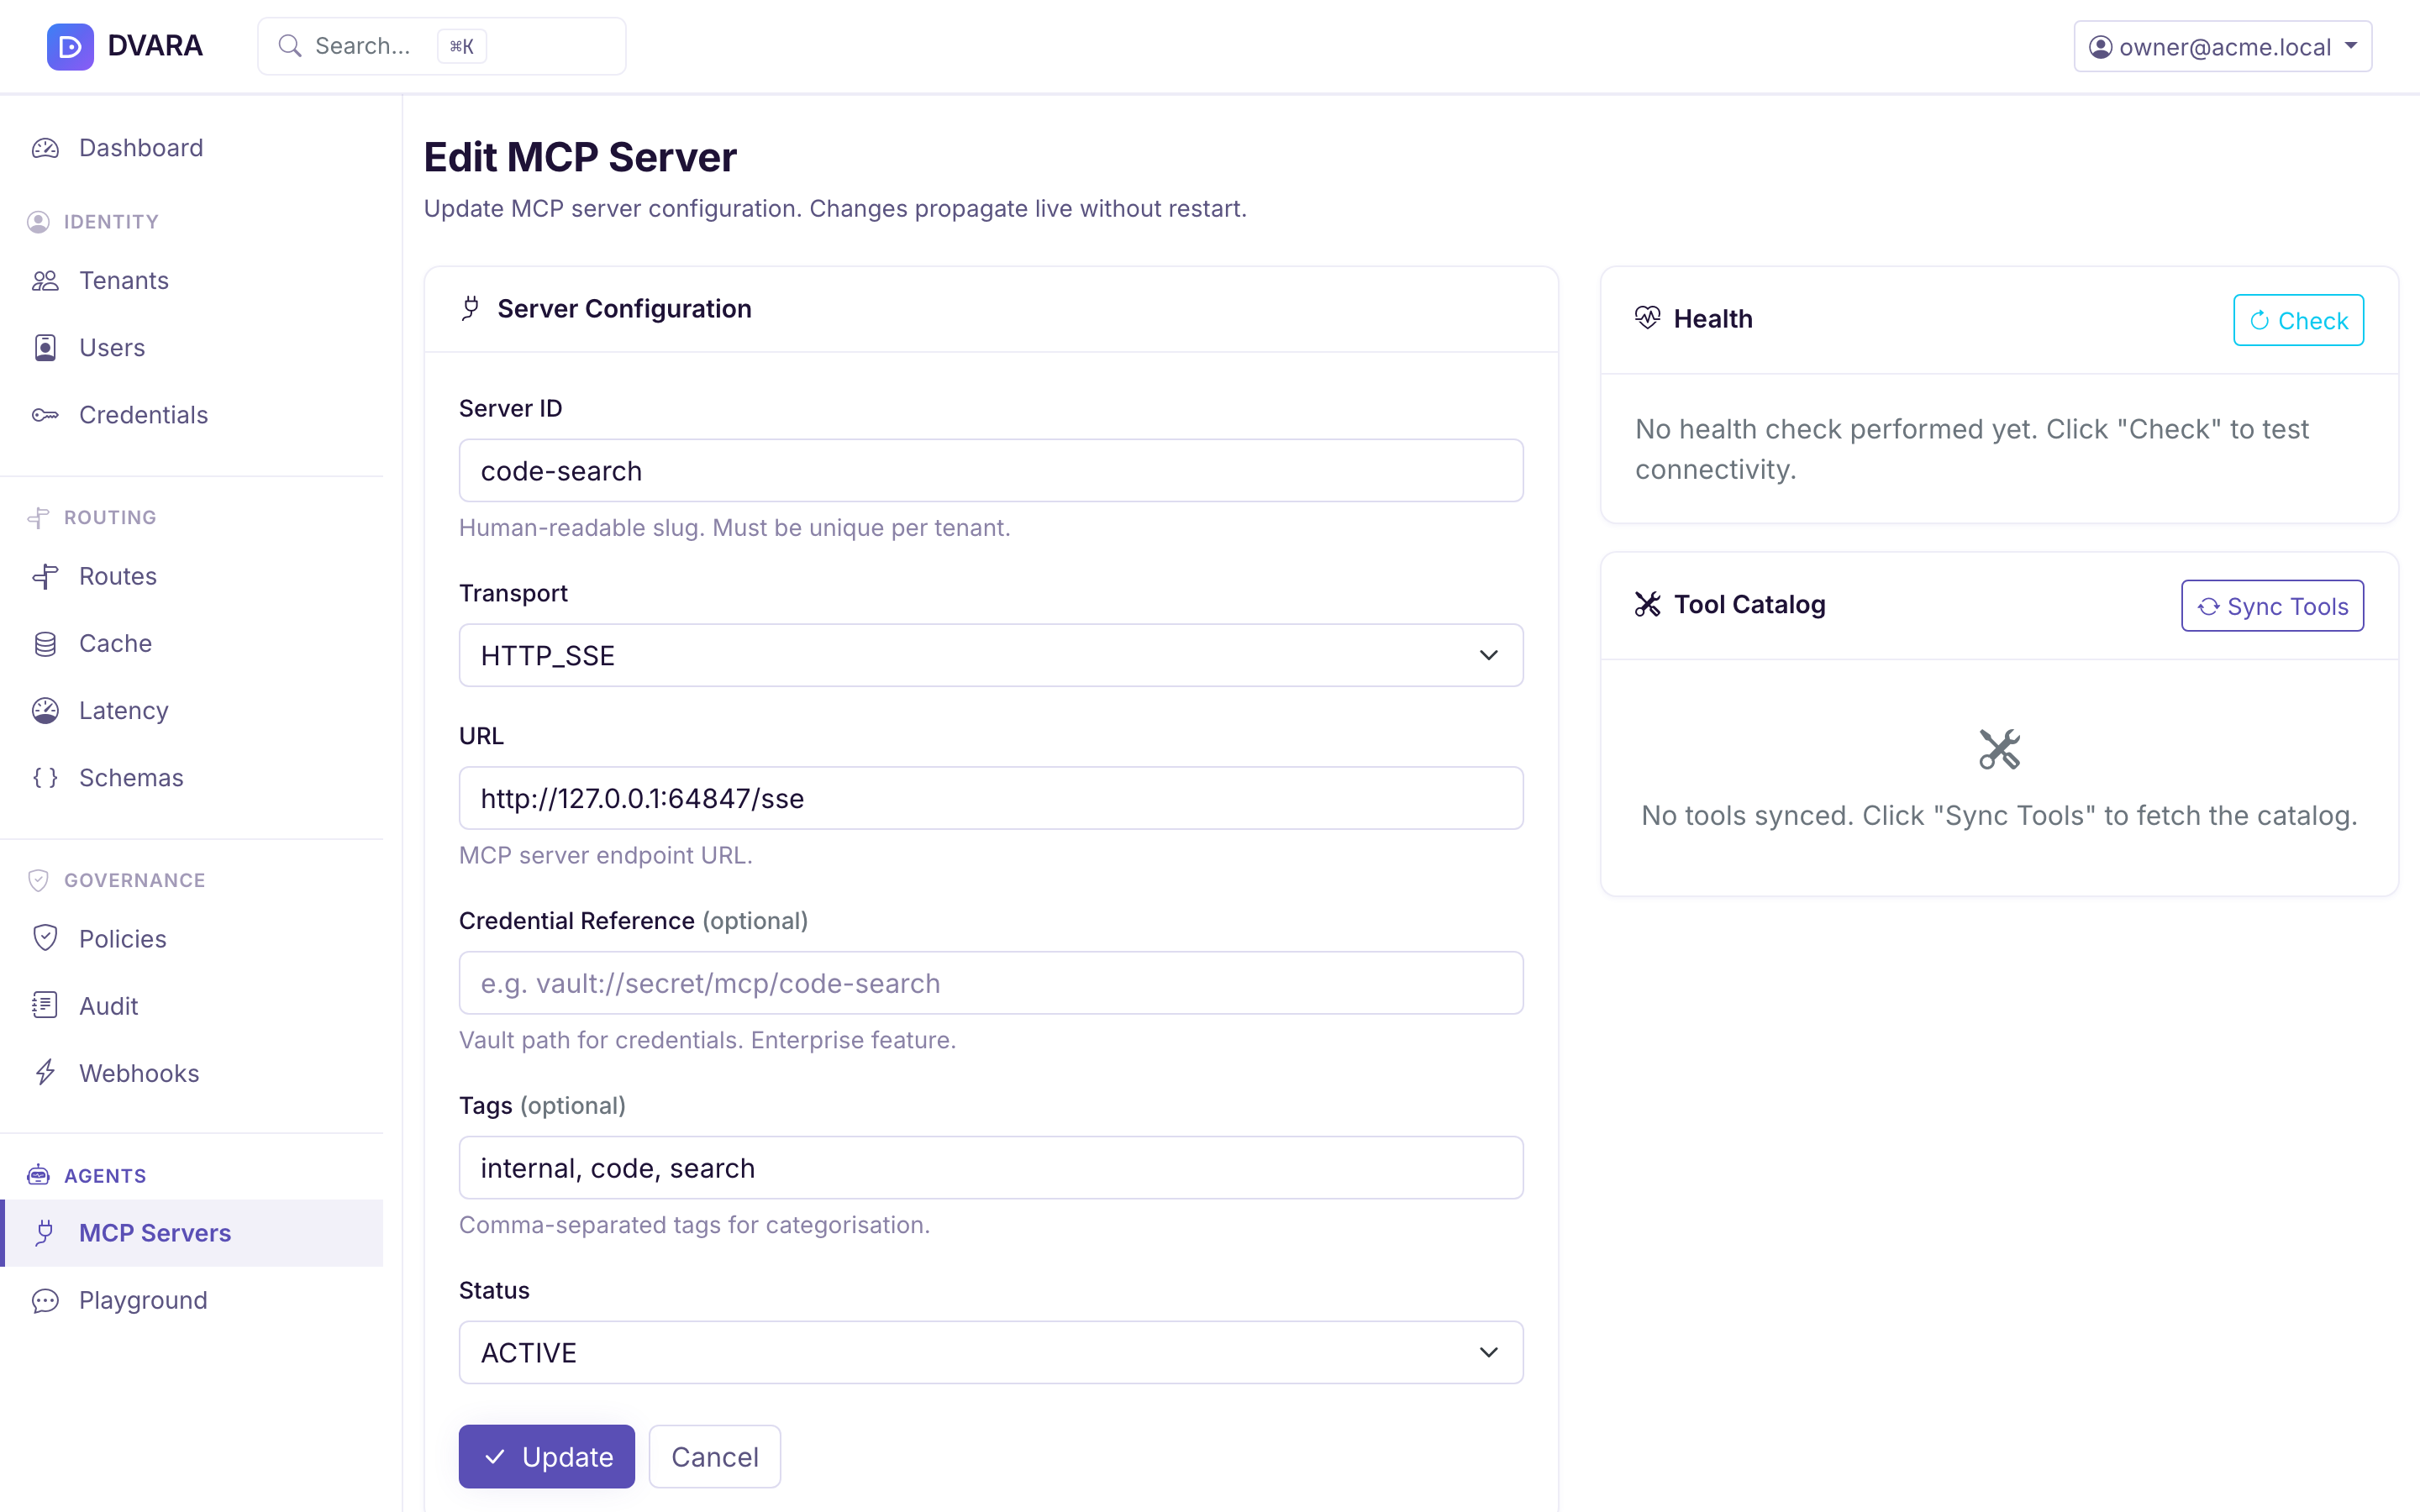
In edit mode, the right panel shows:
- Health Check — click Check Health to test server connectivity. Displays reachable status, HTTP status code, and latency.
- Tool Catalog — table of cached tool definitions (name and description). Click Sync Tools to fetch the latest tool list from the MCP server.
For a new server, save its transport and authentication, run Check Health, then Sync Tools, and only then allow production agents to use it. Health proves the endpoint can be reached; tool sync records the catalog that policies and virtual servers match. Treat a healthy server with a failed or empty sync as incomplete setup.
Tool sync
Click Sync Tools in the edit form to fetch the tool catalog from the MCP server. Required before the approval queue can match rules against tool names.
MCP tool calls
Open Agents → Tool Calls in the sidebar.
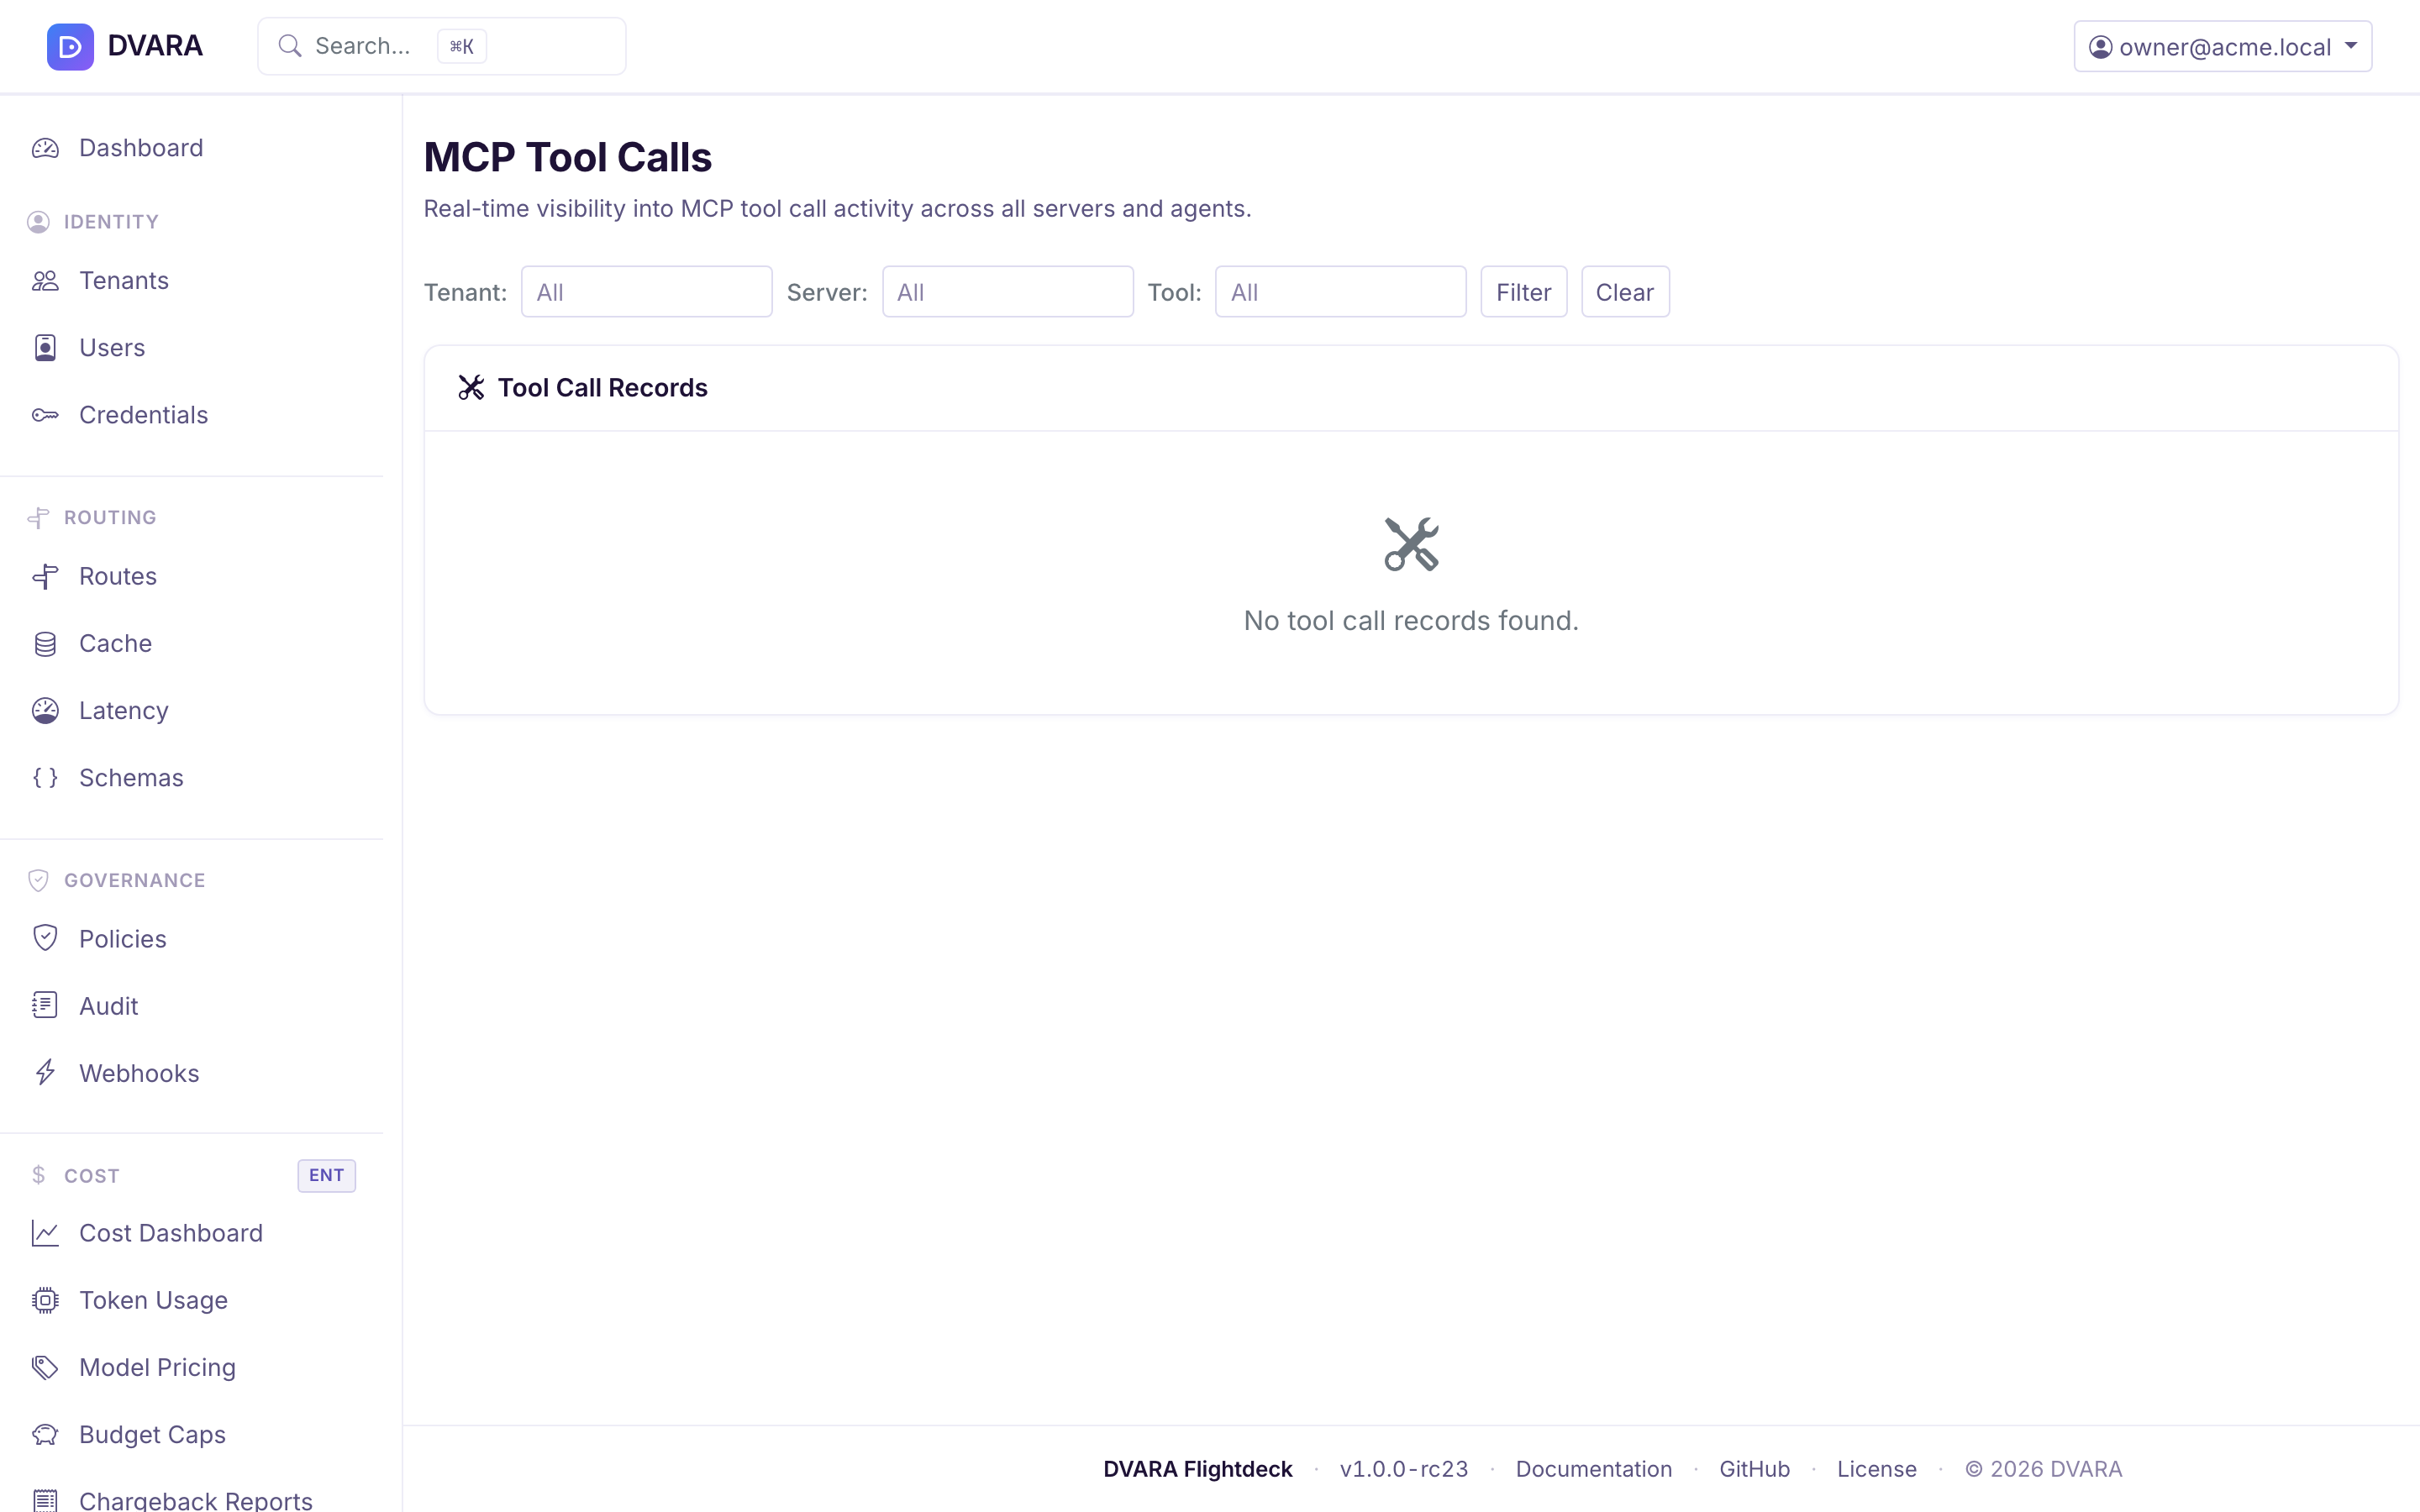
Tool call list
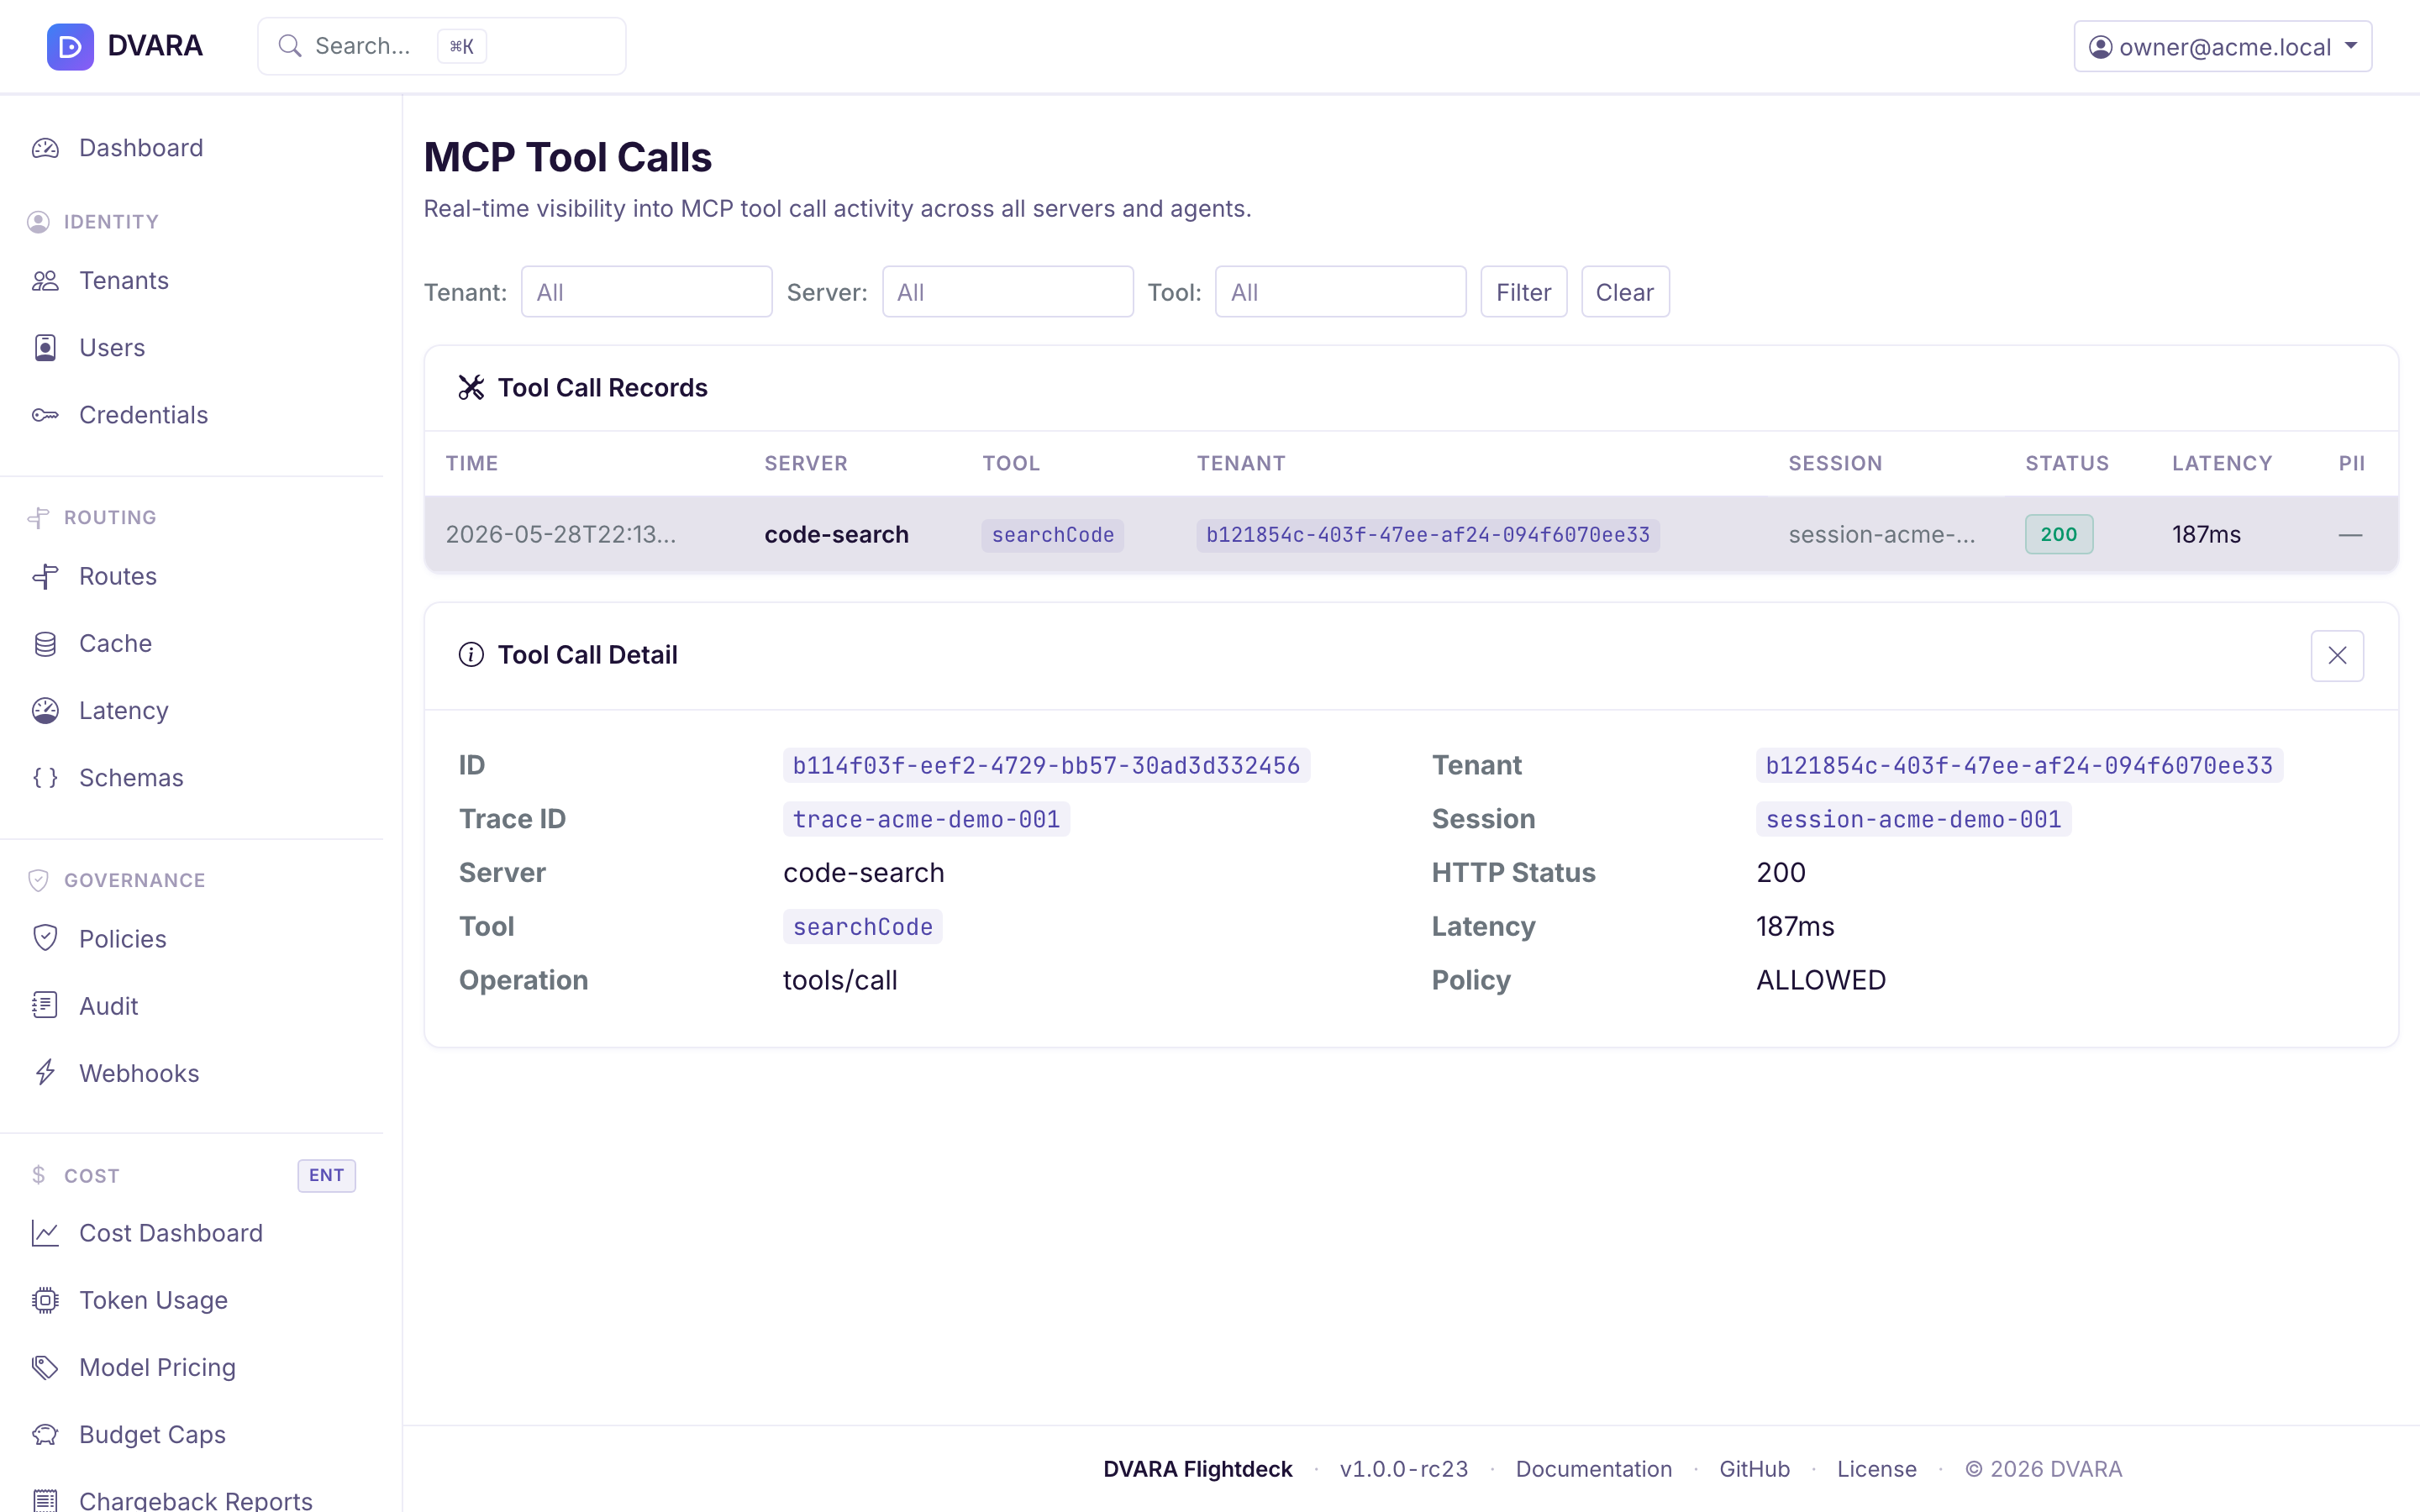
A table of MCP tool call records with timestamp, workspace, session ID, server ID, tool name, operation, HTTP status, latency, policy decision, PII flags, and error info. Auto-refreshes every 5 seconds. Filters: narrow by workspace, session ID, server ID, and tool name.
From 1.8.4 a call that a policy denied is listed too, with policy decision
DENY, status 403 and MCP_POLICY_DENIED. It also appears in the session
timeline. Earlier releases wrote no record for it, so a blocked call was
invisible here.
Tool call detail
Click any row to expand it and view the full tool call record including trace ID, user ID, response bytes, error code, and error message.
Summary view
The summary endpoint aggregates tool call statistics by server and tool, showing total calls, error counts, and average latency per tool.
Agent sessions
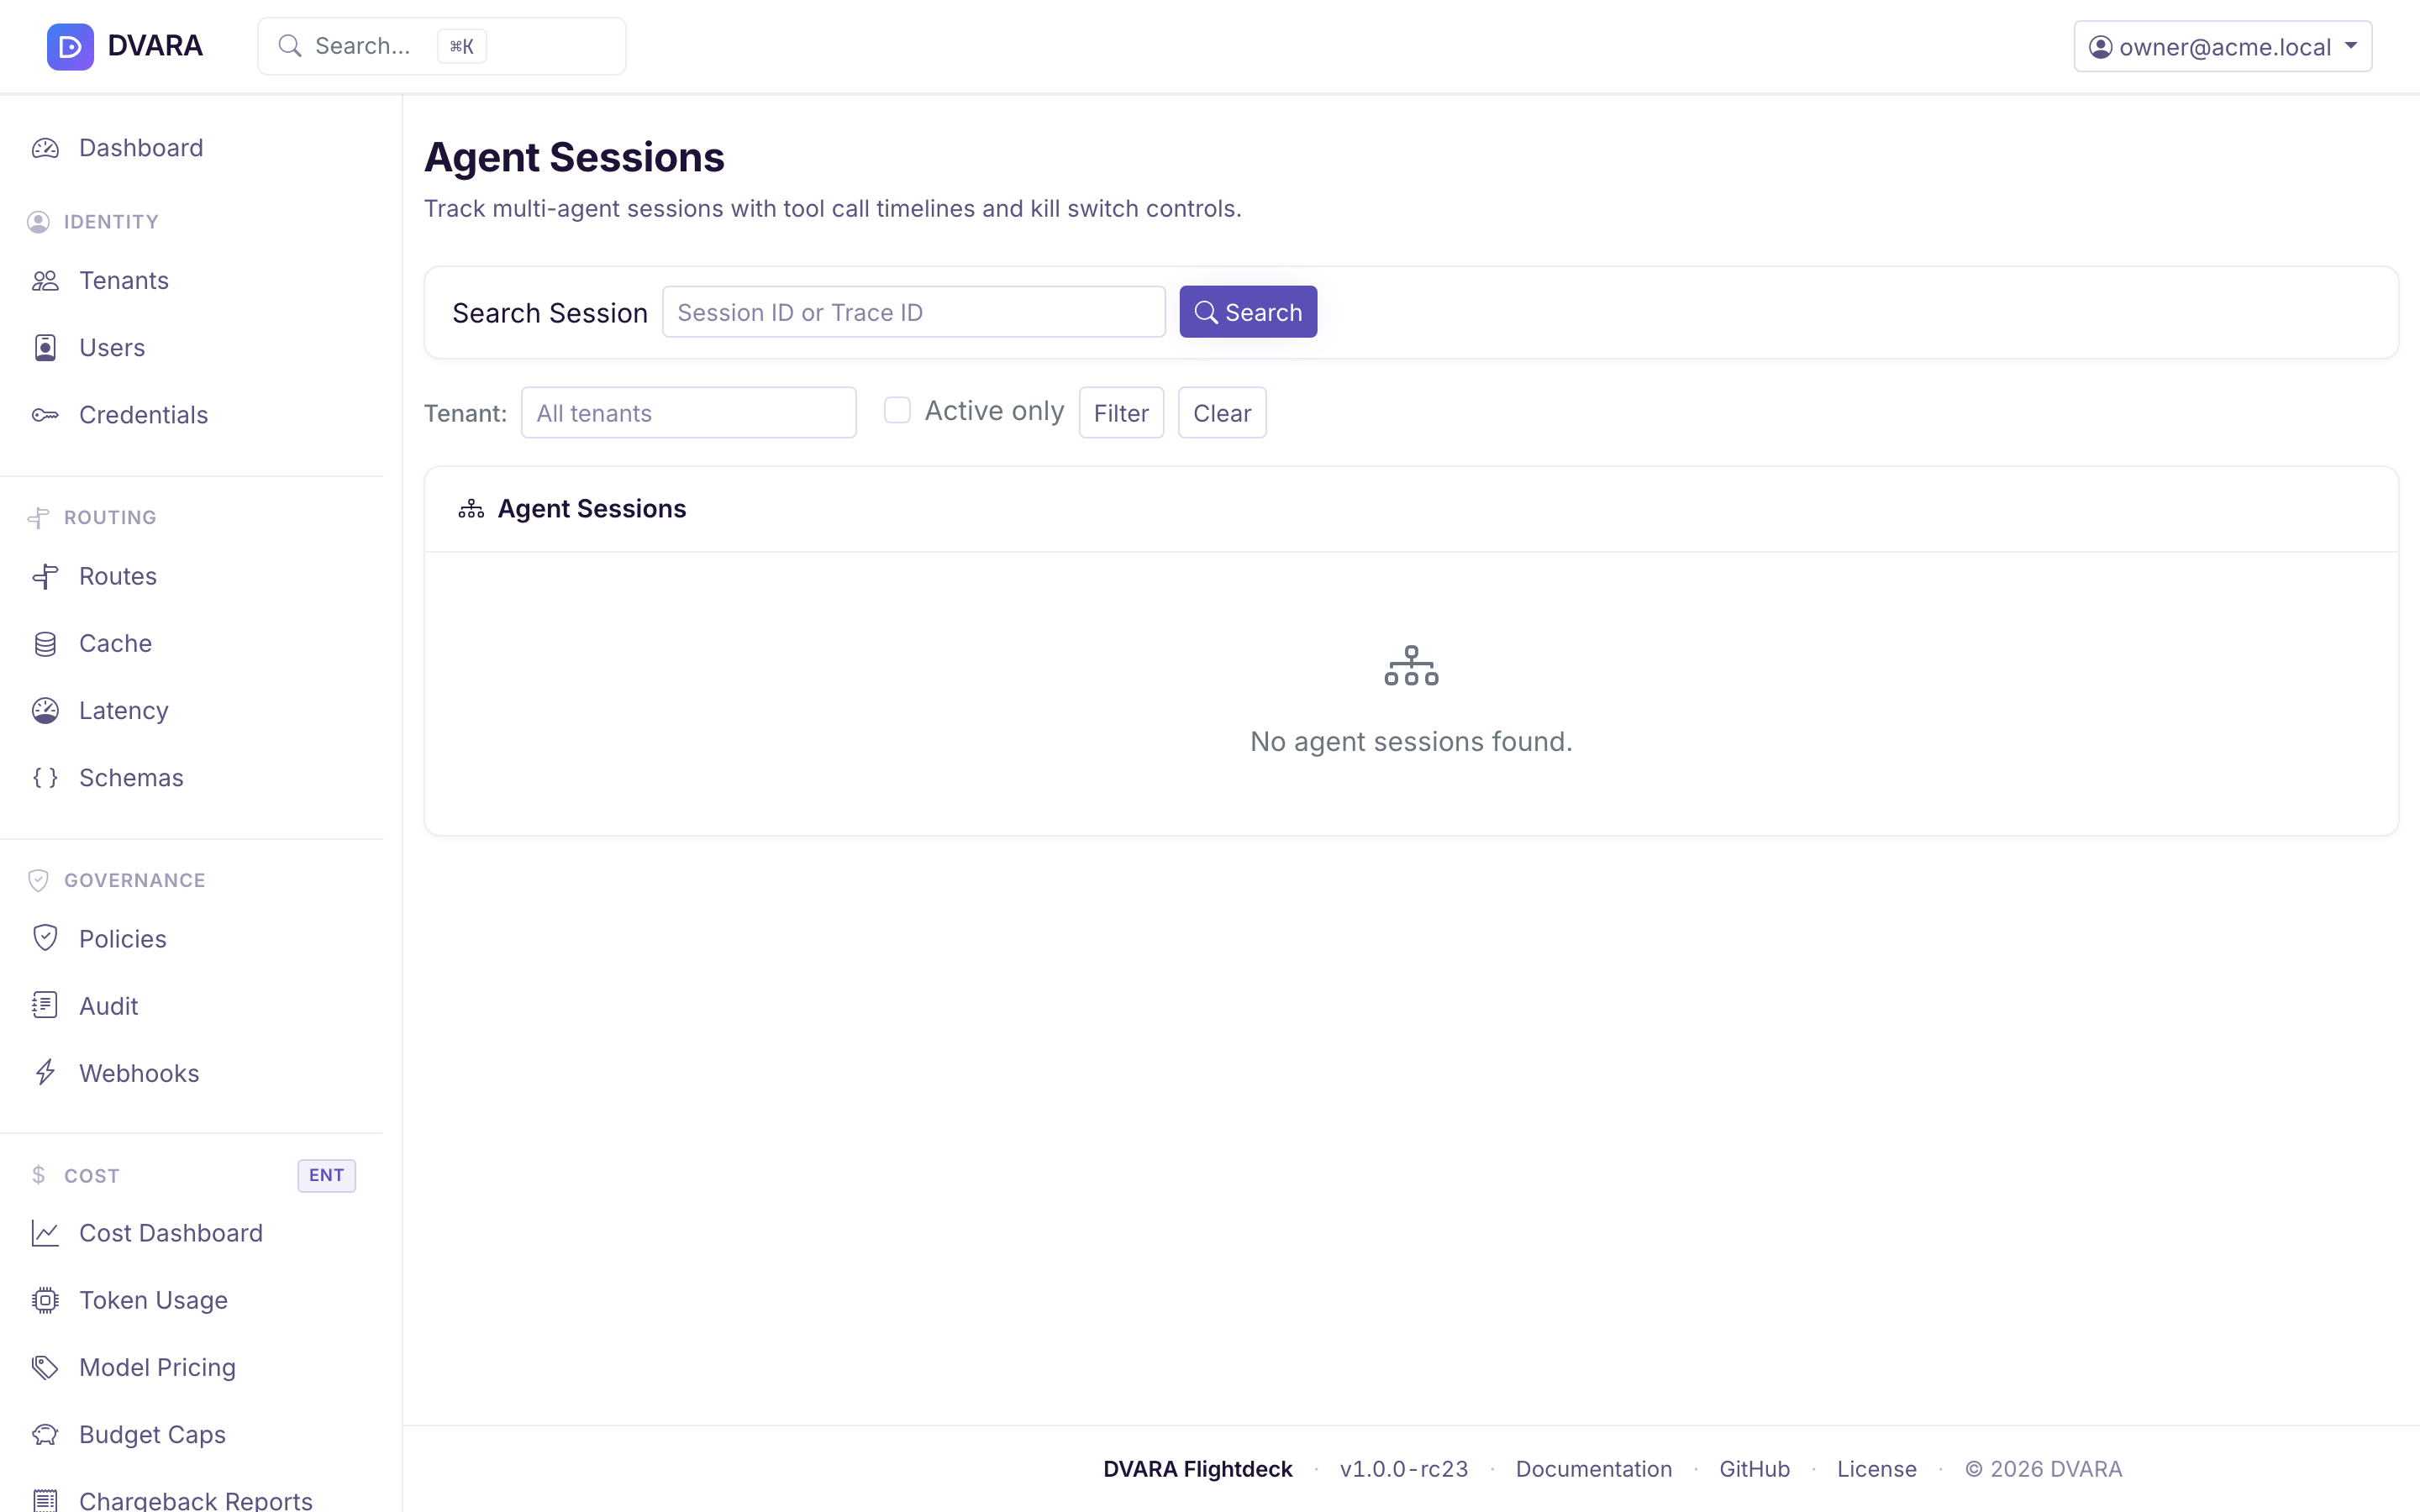
Open MCP → Sessions in the sidebar. The page is titled Agent Sessions.
Session list
Lists every agent session with session ID, workspace, status (active / inactive), tool call count, error count, total latency, distinct servers, distinct tools, first seen, and last seen timestamps. Auto-refreshes every 5 seconds.
Filters:
- Workspace — dropdown filter
- Active — toggle to show only active sessions
- Search — search by session ID
Session detail
Click any session row to navigate to the detail page (/mcp/sessions/{id}), which includes:
Summary stats bar:
- Average latency per tool call
- Error rate (errors / total calls)
- Session duration (first seen → last seen)
- Total response bytes
Distinct tools: a table of all tools invoked in this session with call counts.
Timeline: a chronological timeline of all tool calls in the session, auto-refreshing every 3 seconds. Each entry shows timestamp, server ID and tool name, HTTP status (color-coded), latency, PII badges (if PII detected in args or response), policy decision badge (ALLOW / DENY), and error details.

Kill session
Click Kill Session to terminate an active session. This blocks future tool
calls with that ID in the session's workspace, returning 403 with
code: mcp_session_killed; another workspace using the same caller-supplied ID
is unaffected. Requires confirmation.
From 1.8.5 a kill stops the session on every plane: its model calls, tool calls
and A2A hops, on every Gateway, within 5 seconds, for 24 hours. A model call on
the killed session gets 403 session_killed. A kill stops a session, not an
agent: an agent can start a new session ID. To stop an agent, revoke its API
key. See Stop an agent session.
Kill a session by id
From 1.8.5 the top of the Agent Sessions page has a Kill a session by id
form, for owner and policy-admin. Use it for a session that has no row to
kill from: one seen only on the LLM plane, or one the Gateways have not reported
yet. Pick the workspace, enter the X-Session-Id, and choose Kill session.
The kill covers every plane, like the one above, and is audited as
AGENT_SESSION_KILLED with scope: all_planes.
A session ID two workspaces use
A session ID is the client's choice, so two workspaces can use the same one. From 1.8.5 a link that names no workspace, for an ID more than one workspace uses, opens the list of those sessions with a message, so you can choose the one you meant. Links from the session lists carry the workspace. The A2A session page reads only the hops of the workspace its link names, and checks the kill for that workspace.
JSON export
Click Export JSON to download the full session record with all tool calls as a JSON file — handy for post-incident analysis or sharing with security teams.
Approval queue
Open Governance → Approvals in the sidebar; the page is the Approval Queue. The sidebar item carries a live red badge with the pending count, refreshed every 5 seconds.
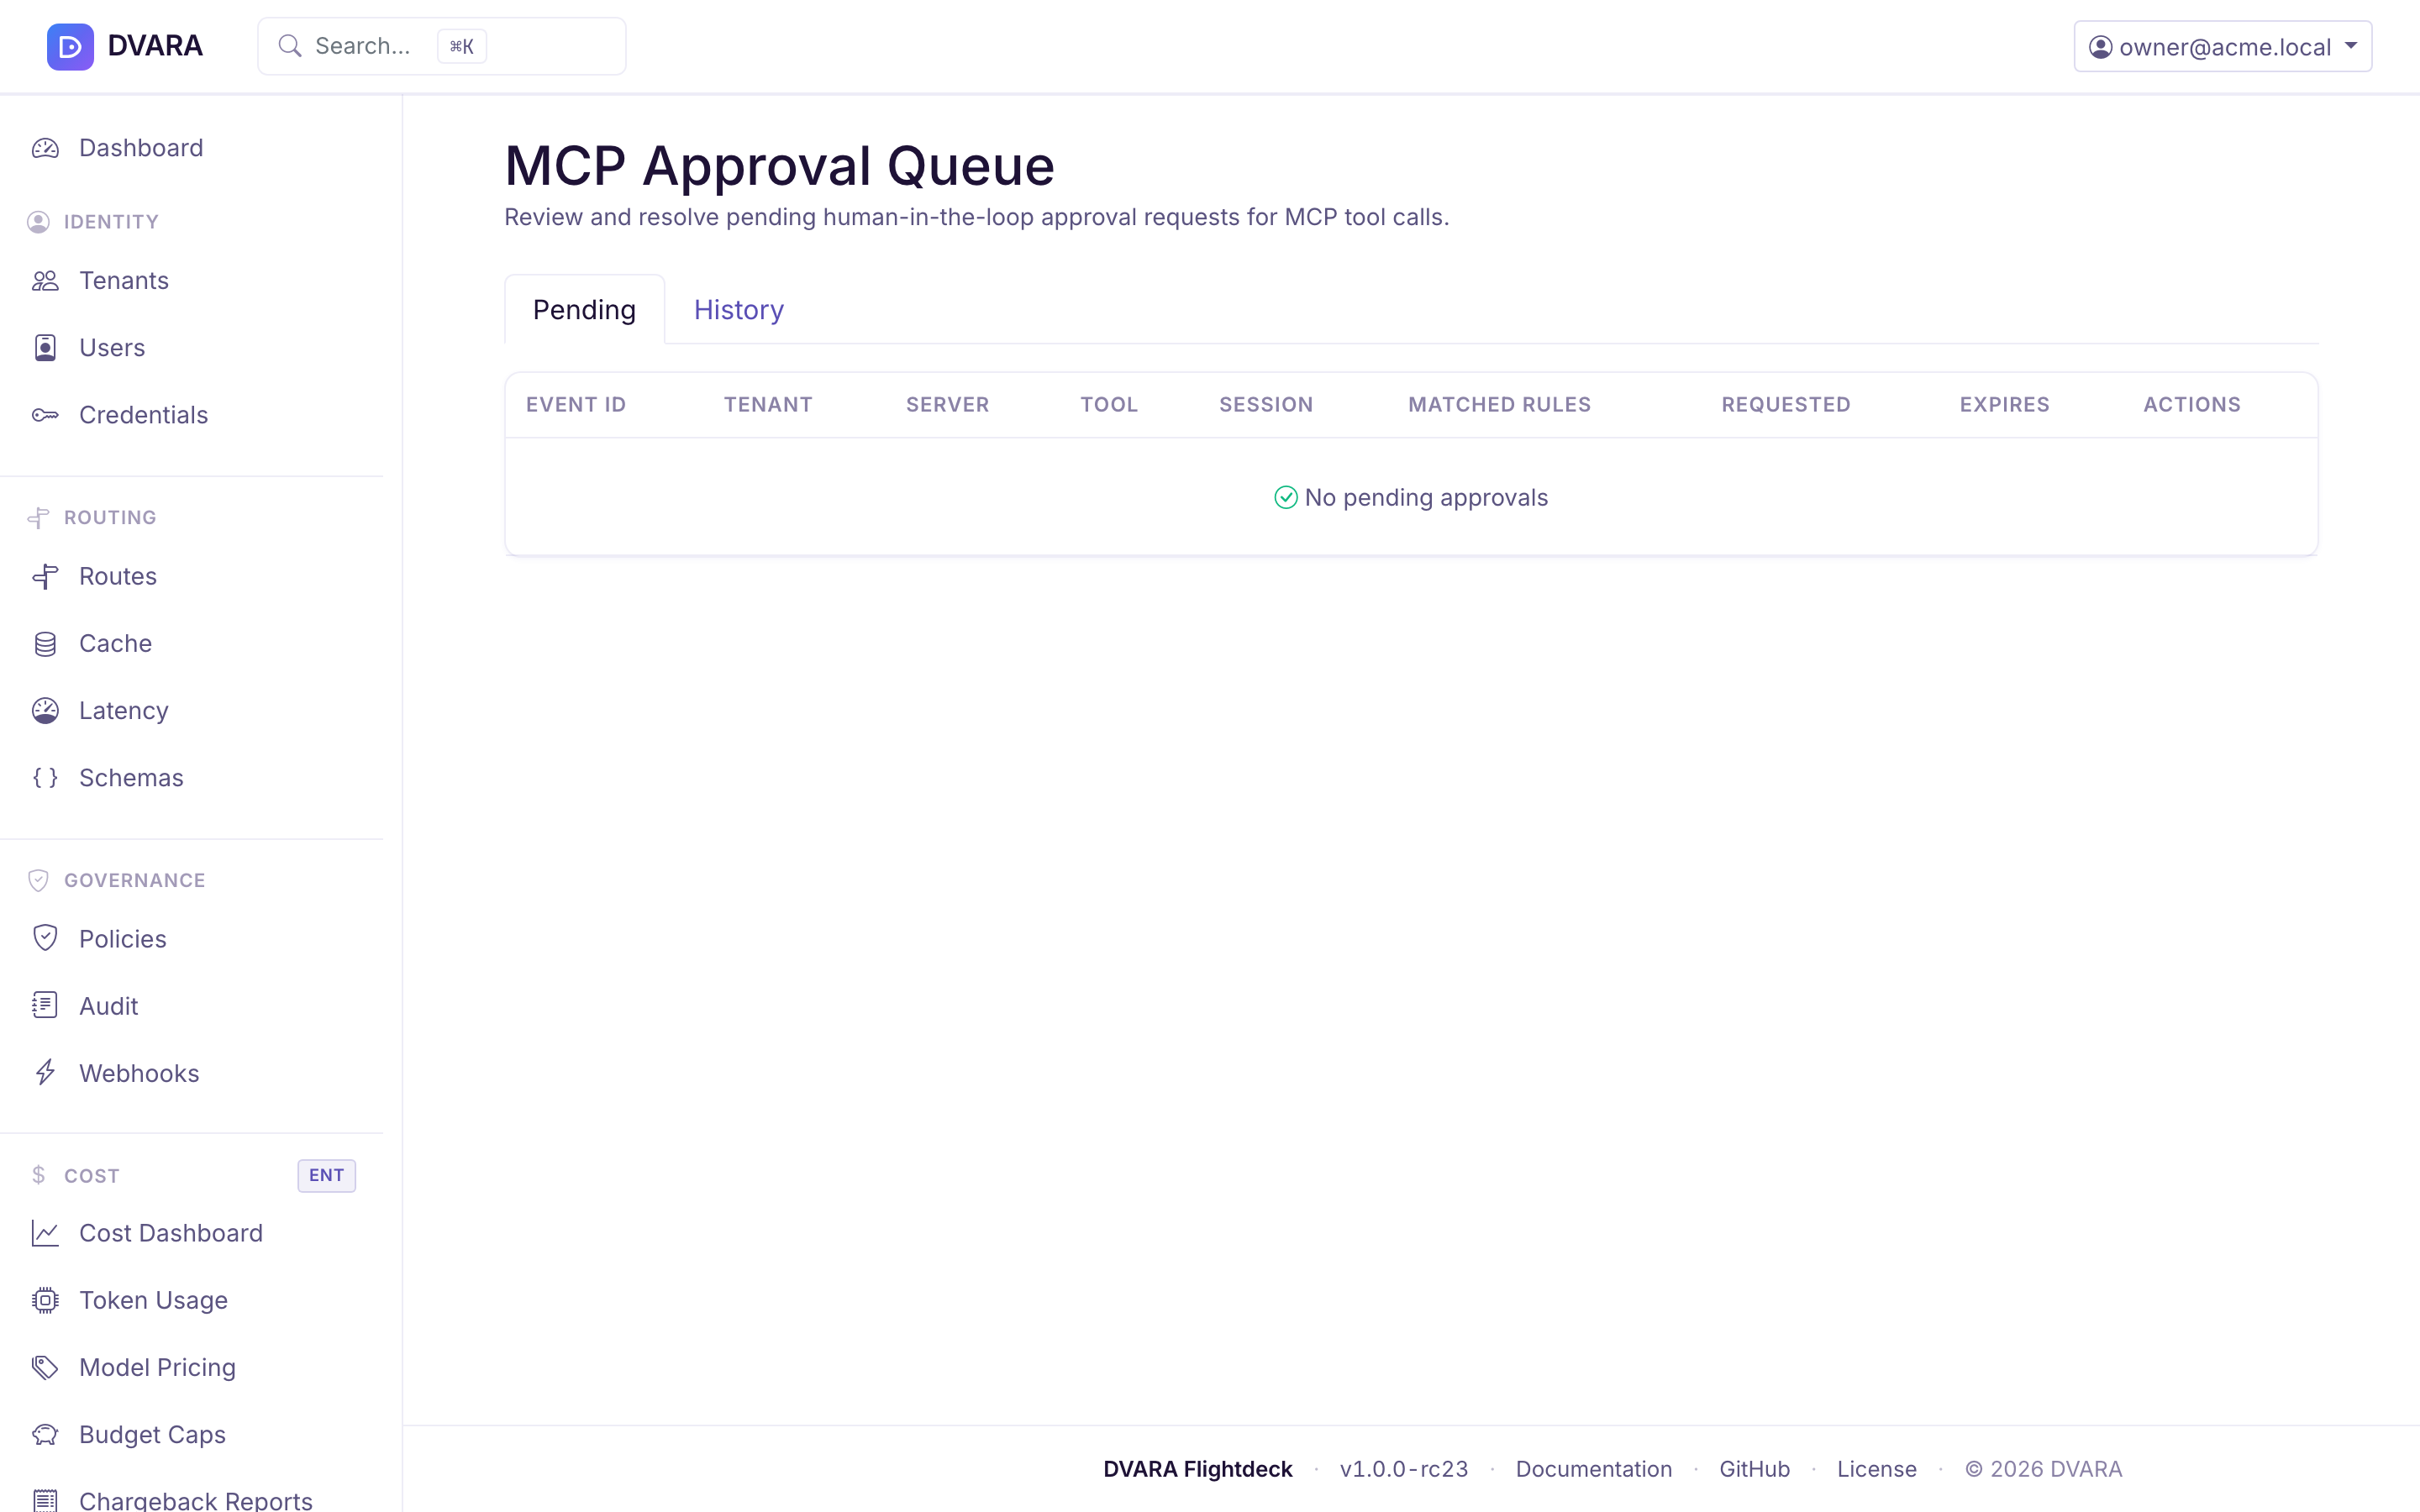
The approval queue is the human-in-the-loop gate for sensitive MCP tool calls. When a tool call matches an approval rule (configured by setting approval.required-tools or approval.required-servers in the workspace metadata), the request blocks until an admin approves or denies it, or the configured timeout elapses.
Pending tab
Lists pending approval requests with event ID, workspace, server ID, tool name, session ID, user ID, matched rules, requested time, and expires-at time. Auto-refreshes every 3 seconds. Each row has Approve and Deny buttons — clicking either resolves the pending request and unblocks the waiting tool call.
History tab
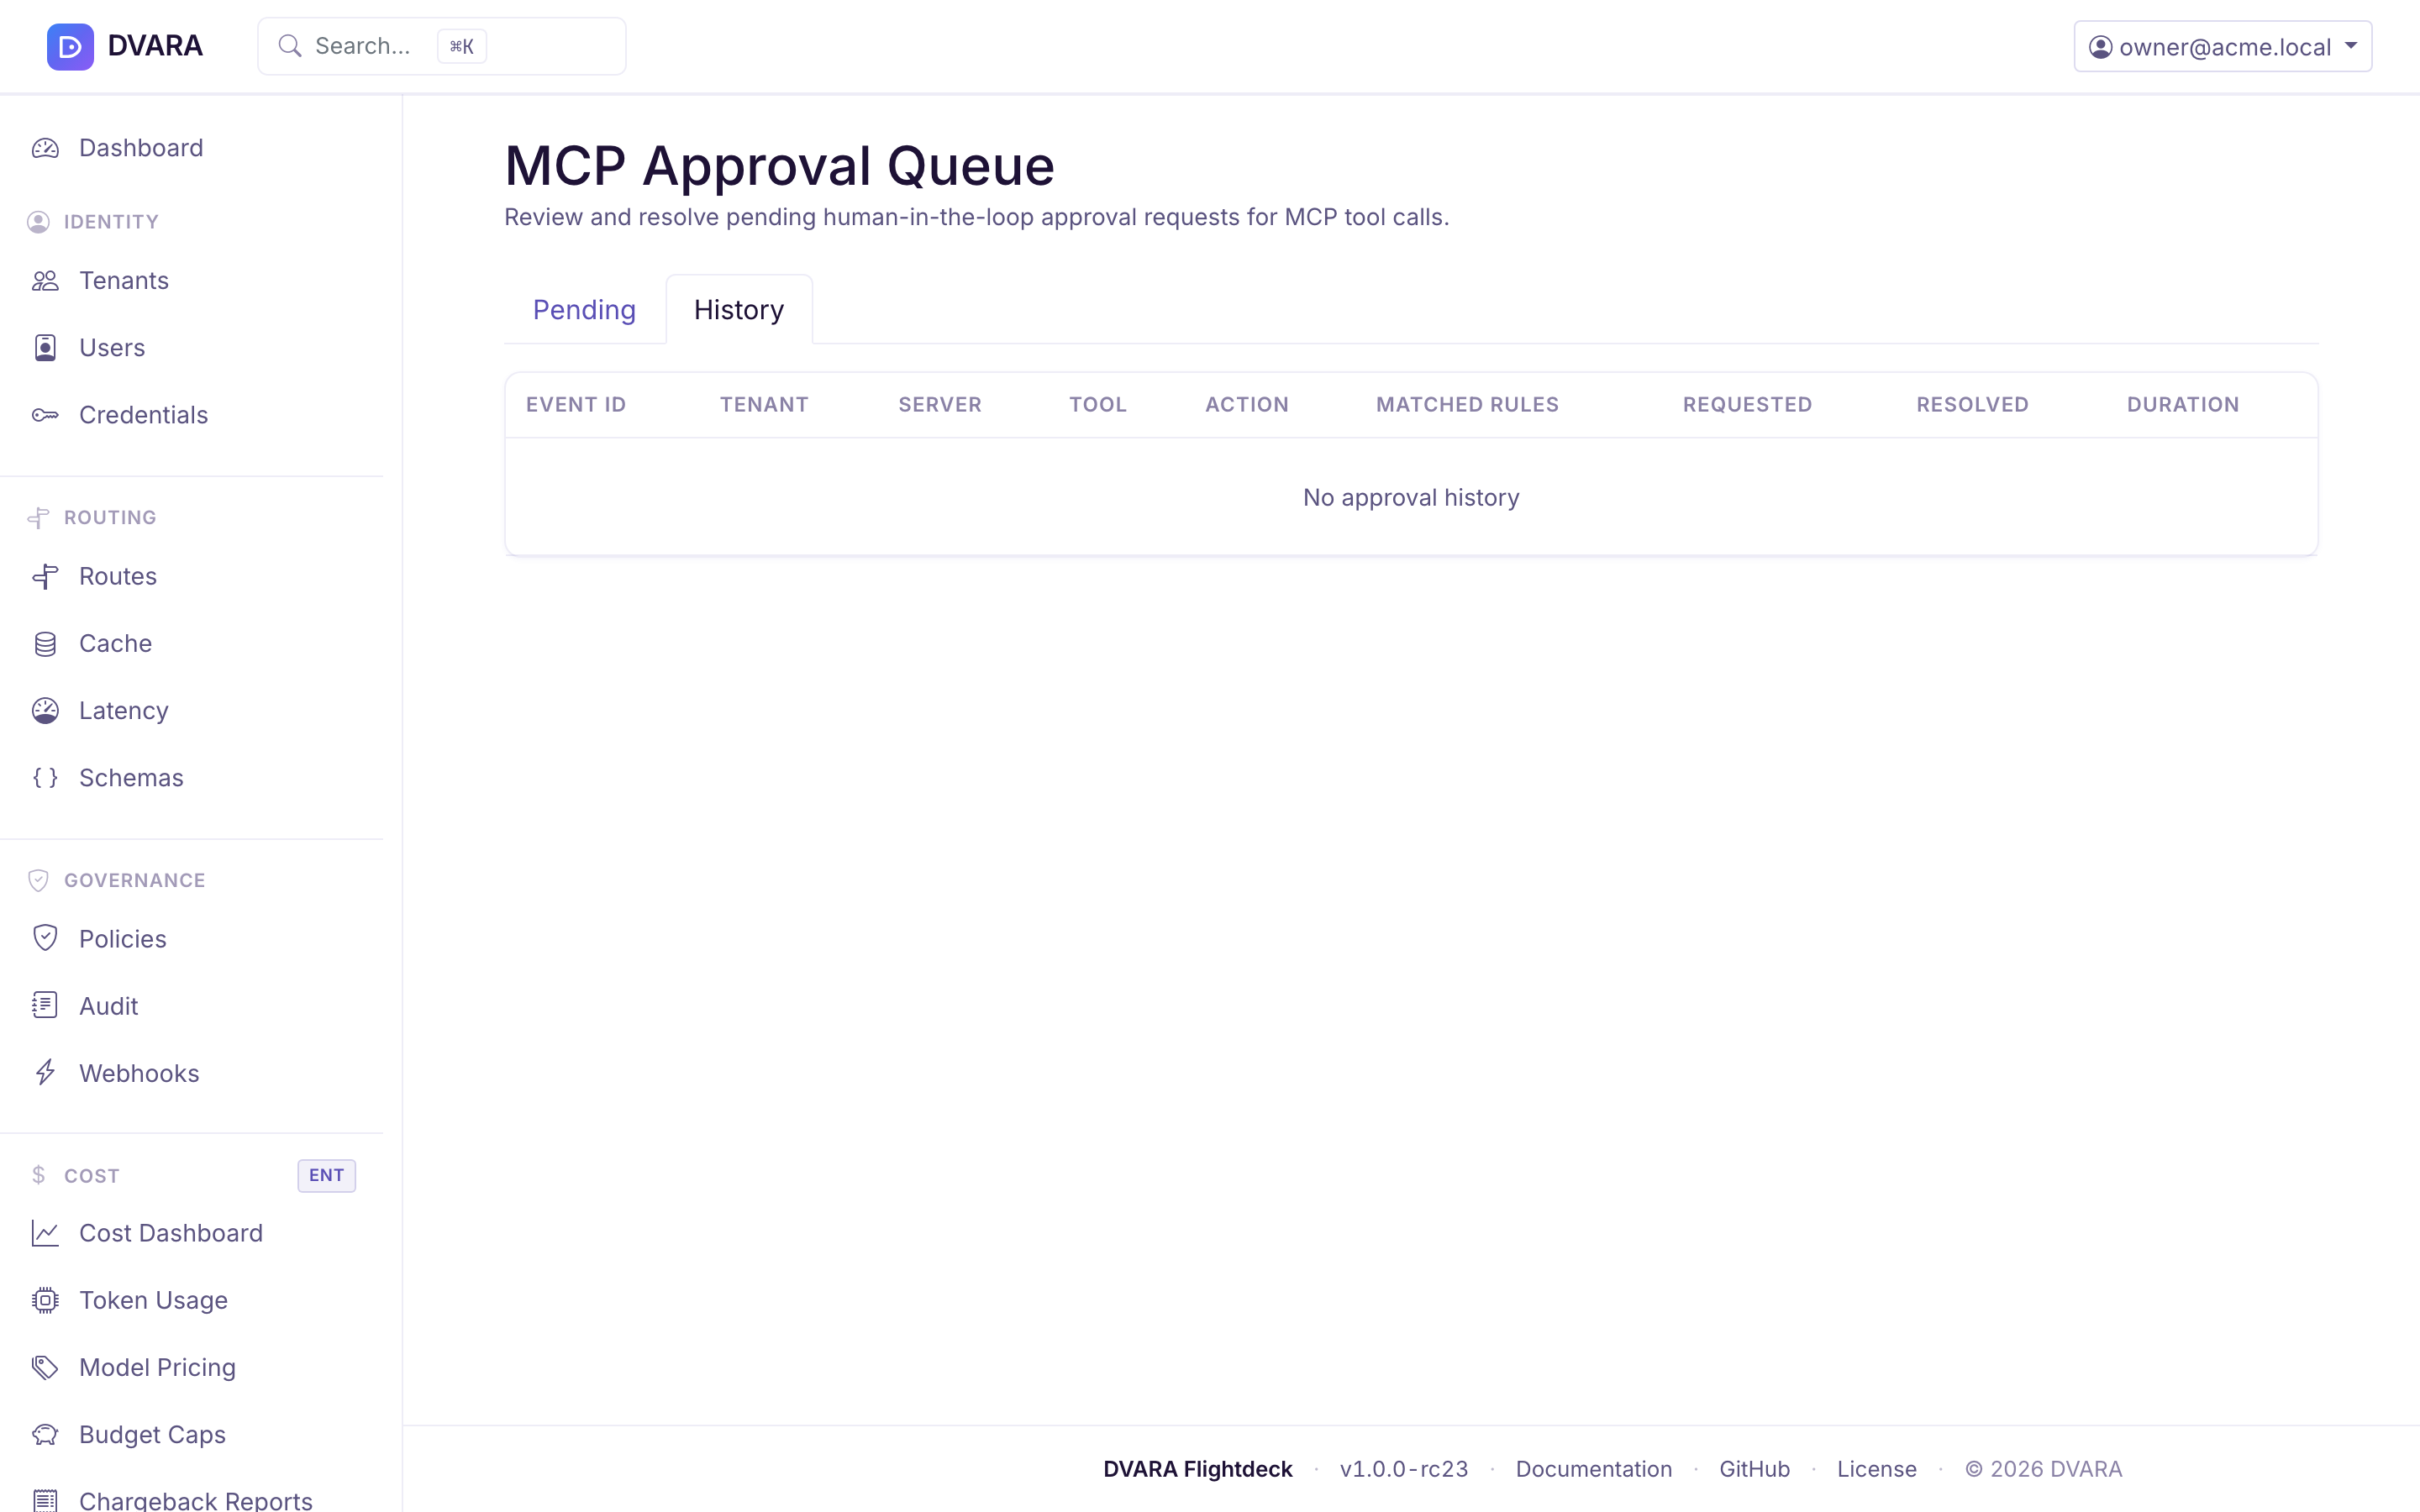
Lists resolved approvals with event ID, workspace, server ID, tool name, action (approve / deny, color-coded badge), requested time, resolved time, and elapsed time. Auto-refreshes every 10 seconds.
Nav badge
The Approval Queue navigation item displays a live badge count of pending approvals, updated every 5 seconds. No reason to keep the page open — glance at the badge.
Analytics dashboard
Open Agents → Analytics in the sidebar.
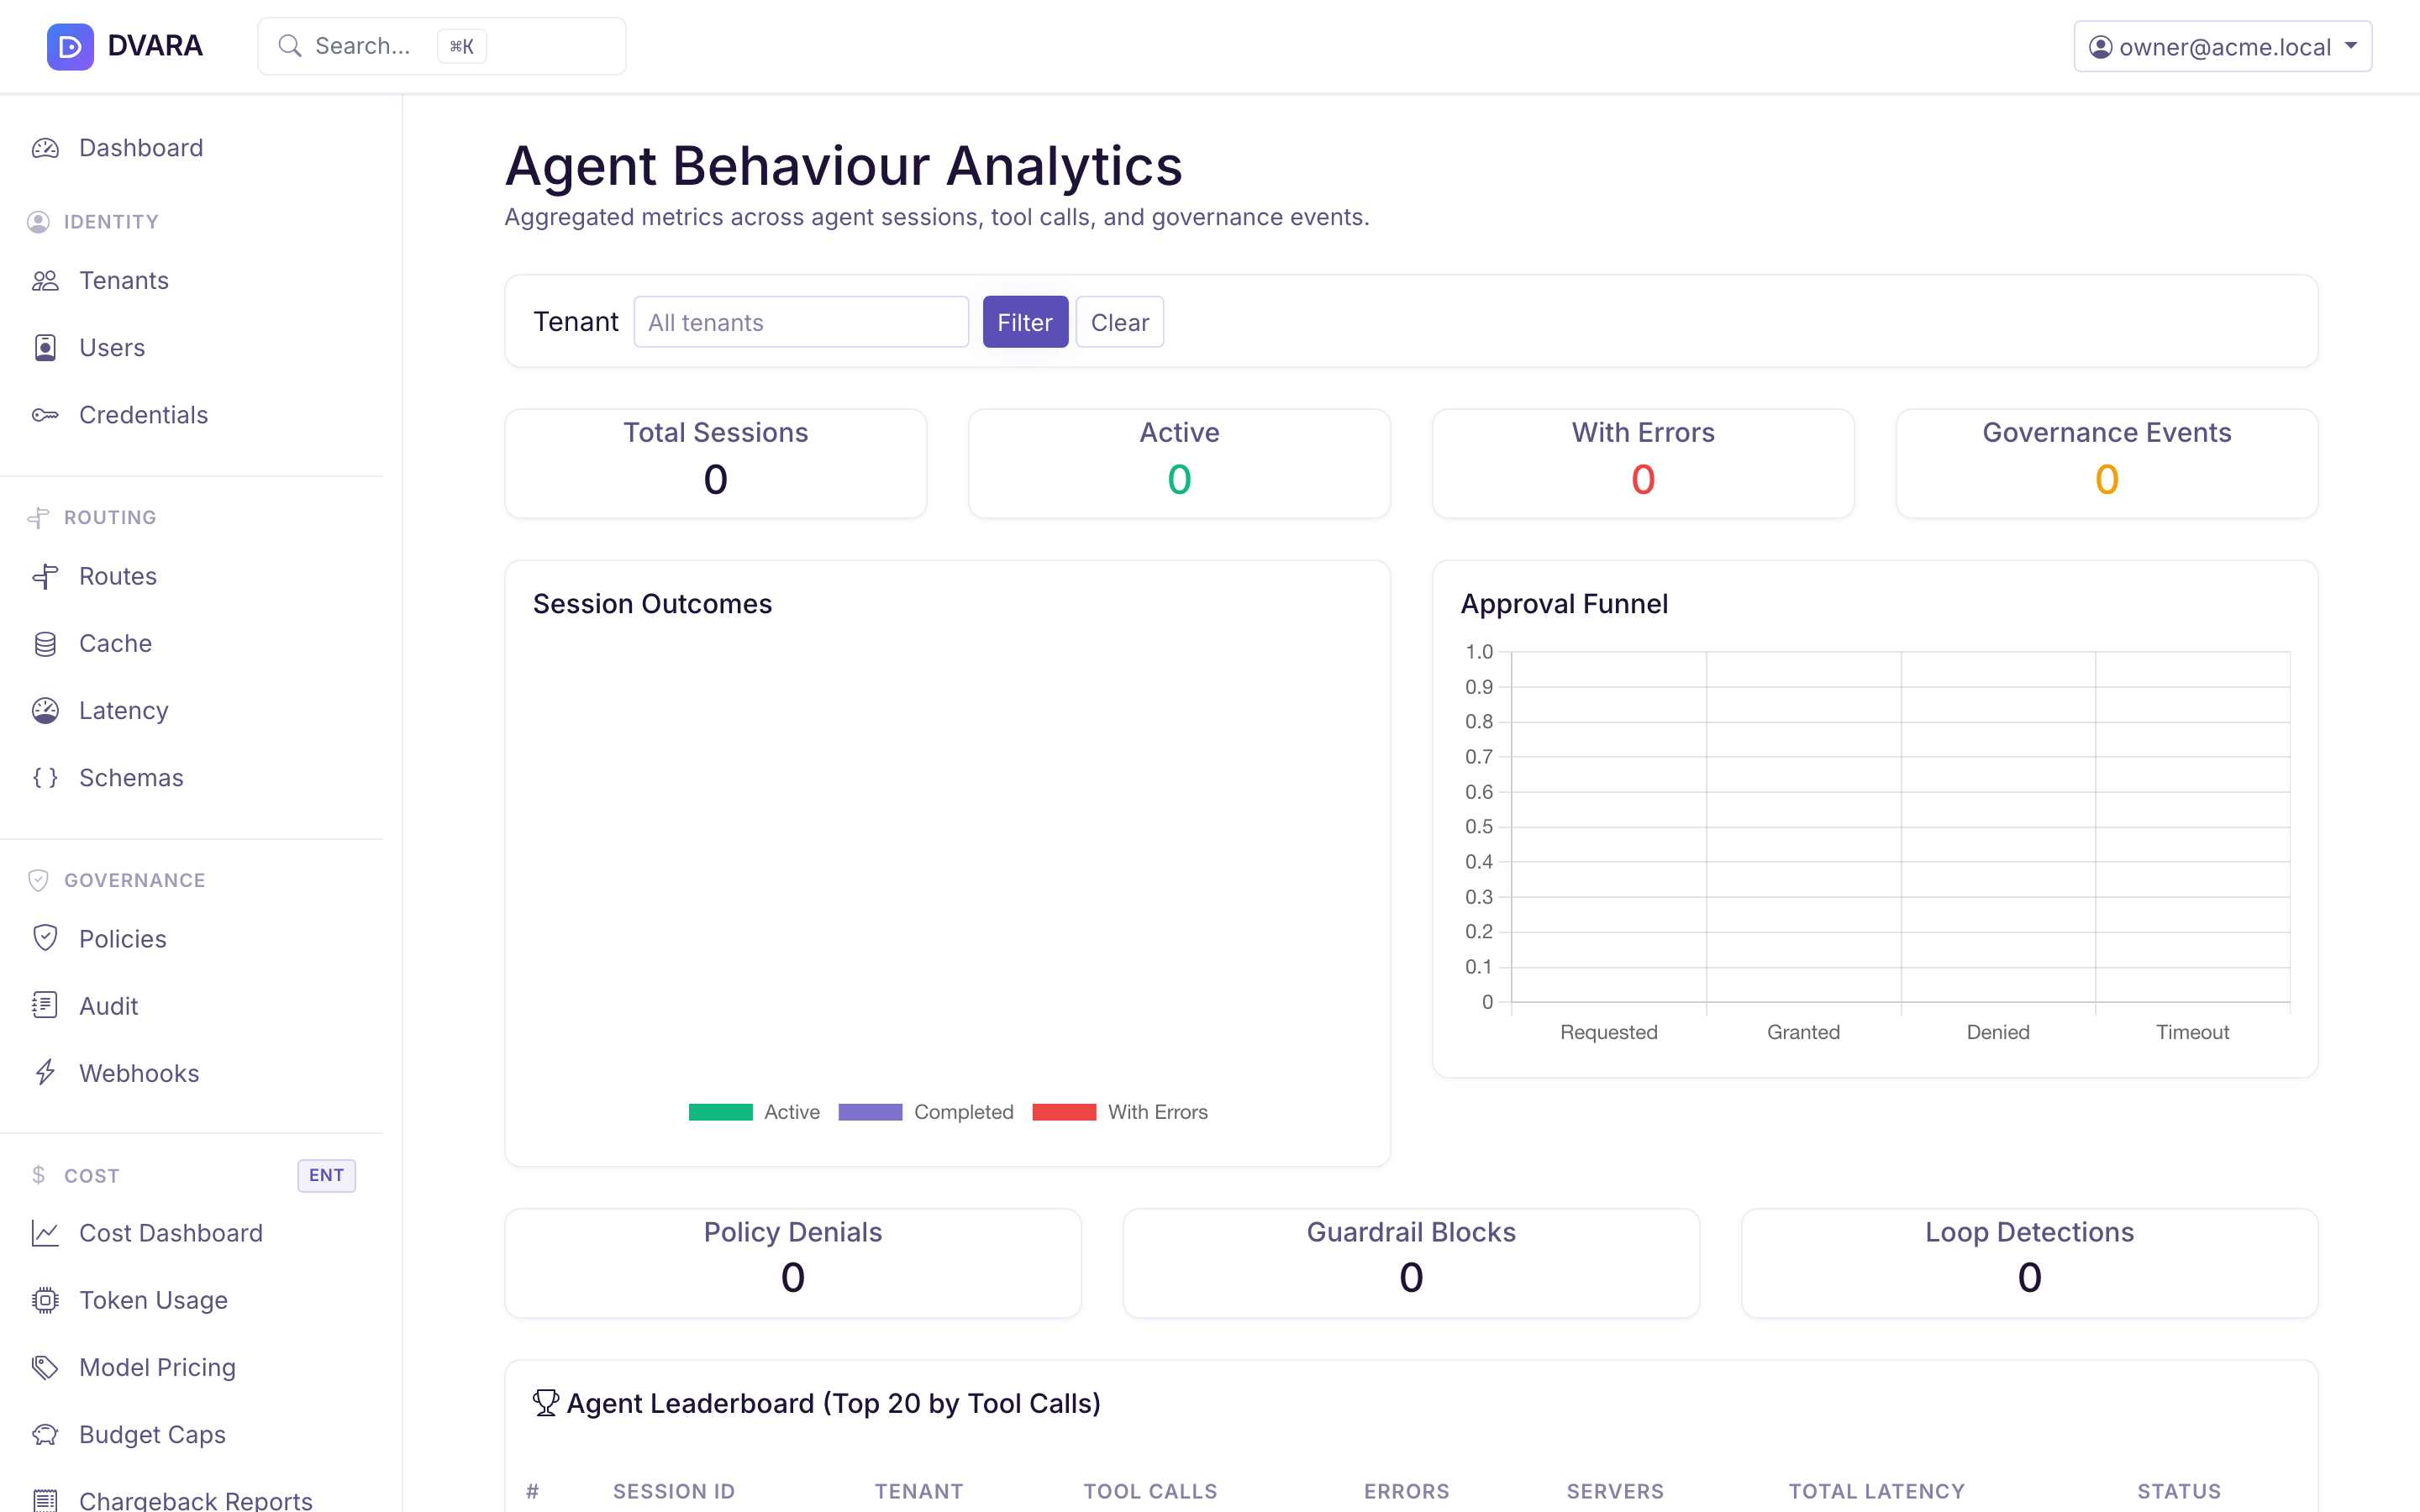
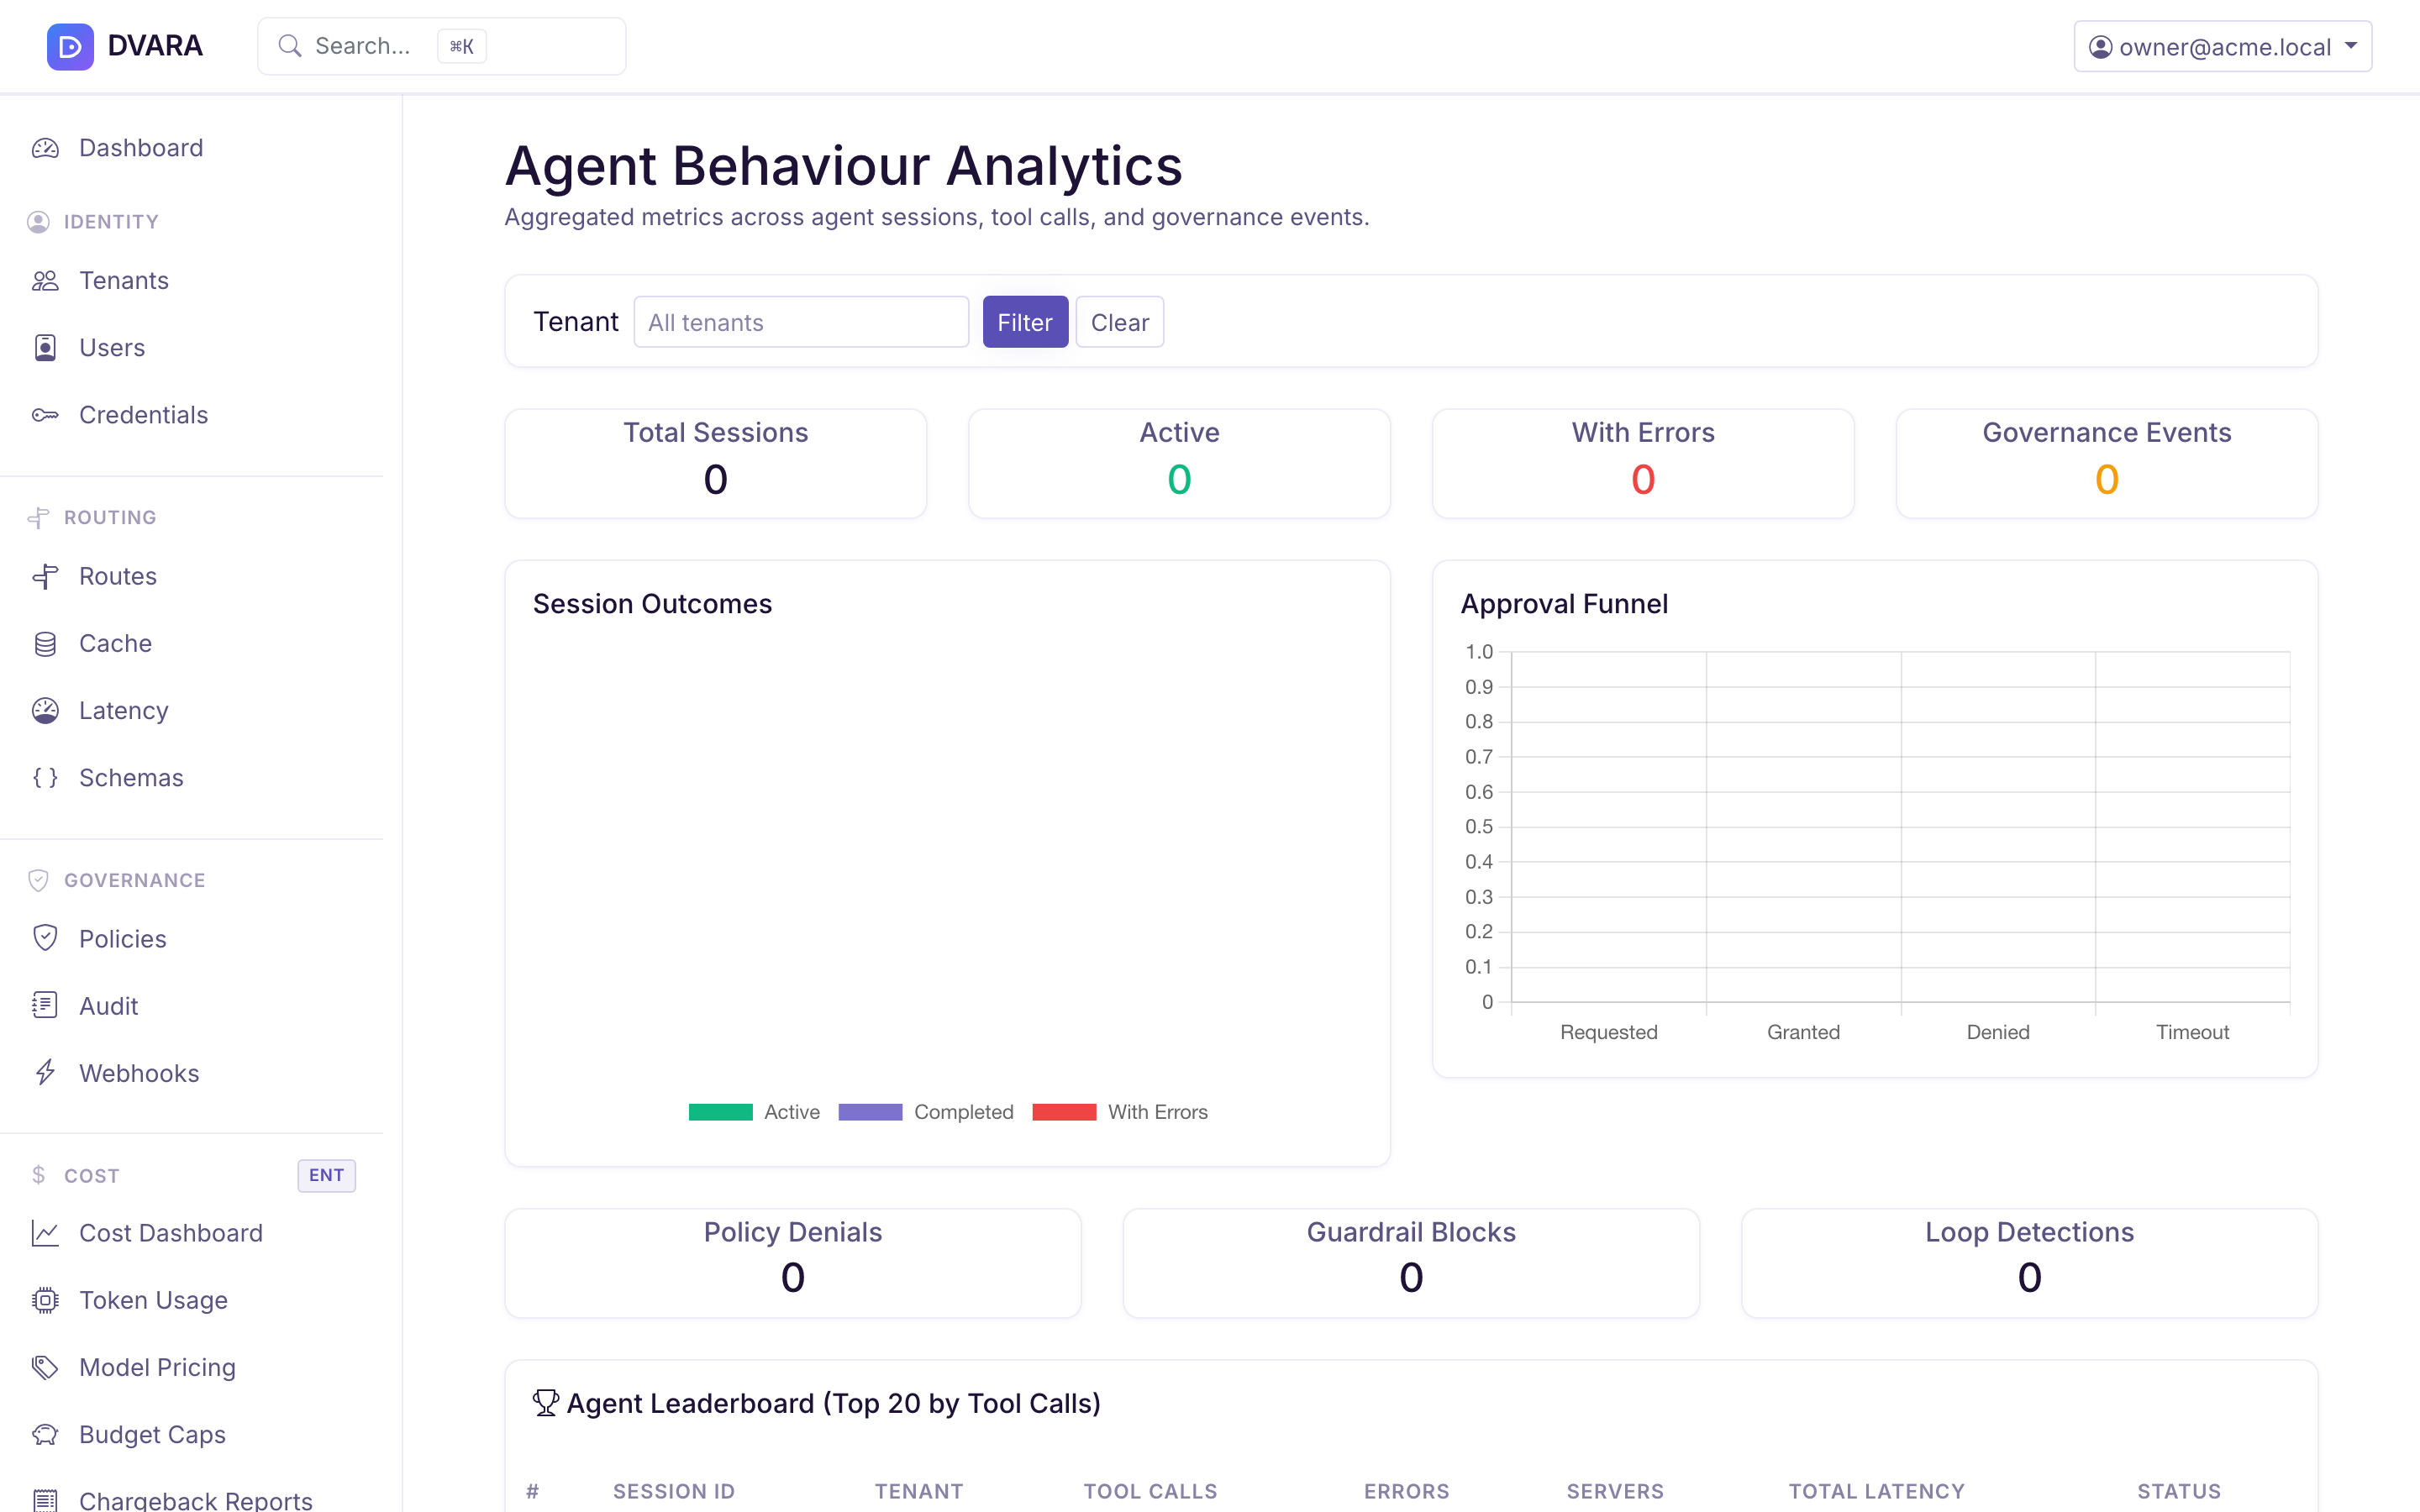
The analytics dashboard provides aggregate insights into agent behavior across all sessions.
Summary cards
Four top-level stats: total sessions, total tool calls, overall error rate, and average session duration.
Session outcomes
A donut chart showing the distribution of session outcomes (completed, killed, timed out, errored).
Approval funnel
A bar chart showing the approval pipeline: requested, approved, denied, timed out.
Agent leaderboard
A table of the top 20 sessions ranked by tool call count, showing session ID, workspace, tool calls, errors, distinct tools, and duration. Auto-refreshes every 10 seconds.
Tool call heatmap
A server-by-tool matrix showing call counts as a heatmap. Helps identify which tools are most heavily used on which servers. Auto-refreshes every 10 seconds.
Policy firing frequency
Shows how often different policy rules are triggered across agent sessions — useful for spotting noisy rules or unused guardrails.
Investigate an alert and export evidence
Start with the alert's workspace, session ID, server, tool, and time. Filter MCP → Tool calls, open the refusal or error, then follow its session to see the calls before and after it. Use Analytics to separate upstream failures from policy and approval outcomes. Export the session JSON and the matching audit window when you need a portable evidence bundle; exports contain recorded metadata and outcomes, not credential material.