Cost Management
Not included in DVARA Open Source.
The Open Source runtime does not serve budget caps, pricing management, chargeback, forecasting, or POST /v1/budget/estimate.
The sidebar's Cost section groups six FinOps surfaces: the live cost dashboard, token usage telemetry, model pricing, budget caps, chargeback reports, and compliance reports.
Cost dashboard
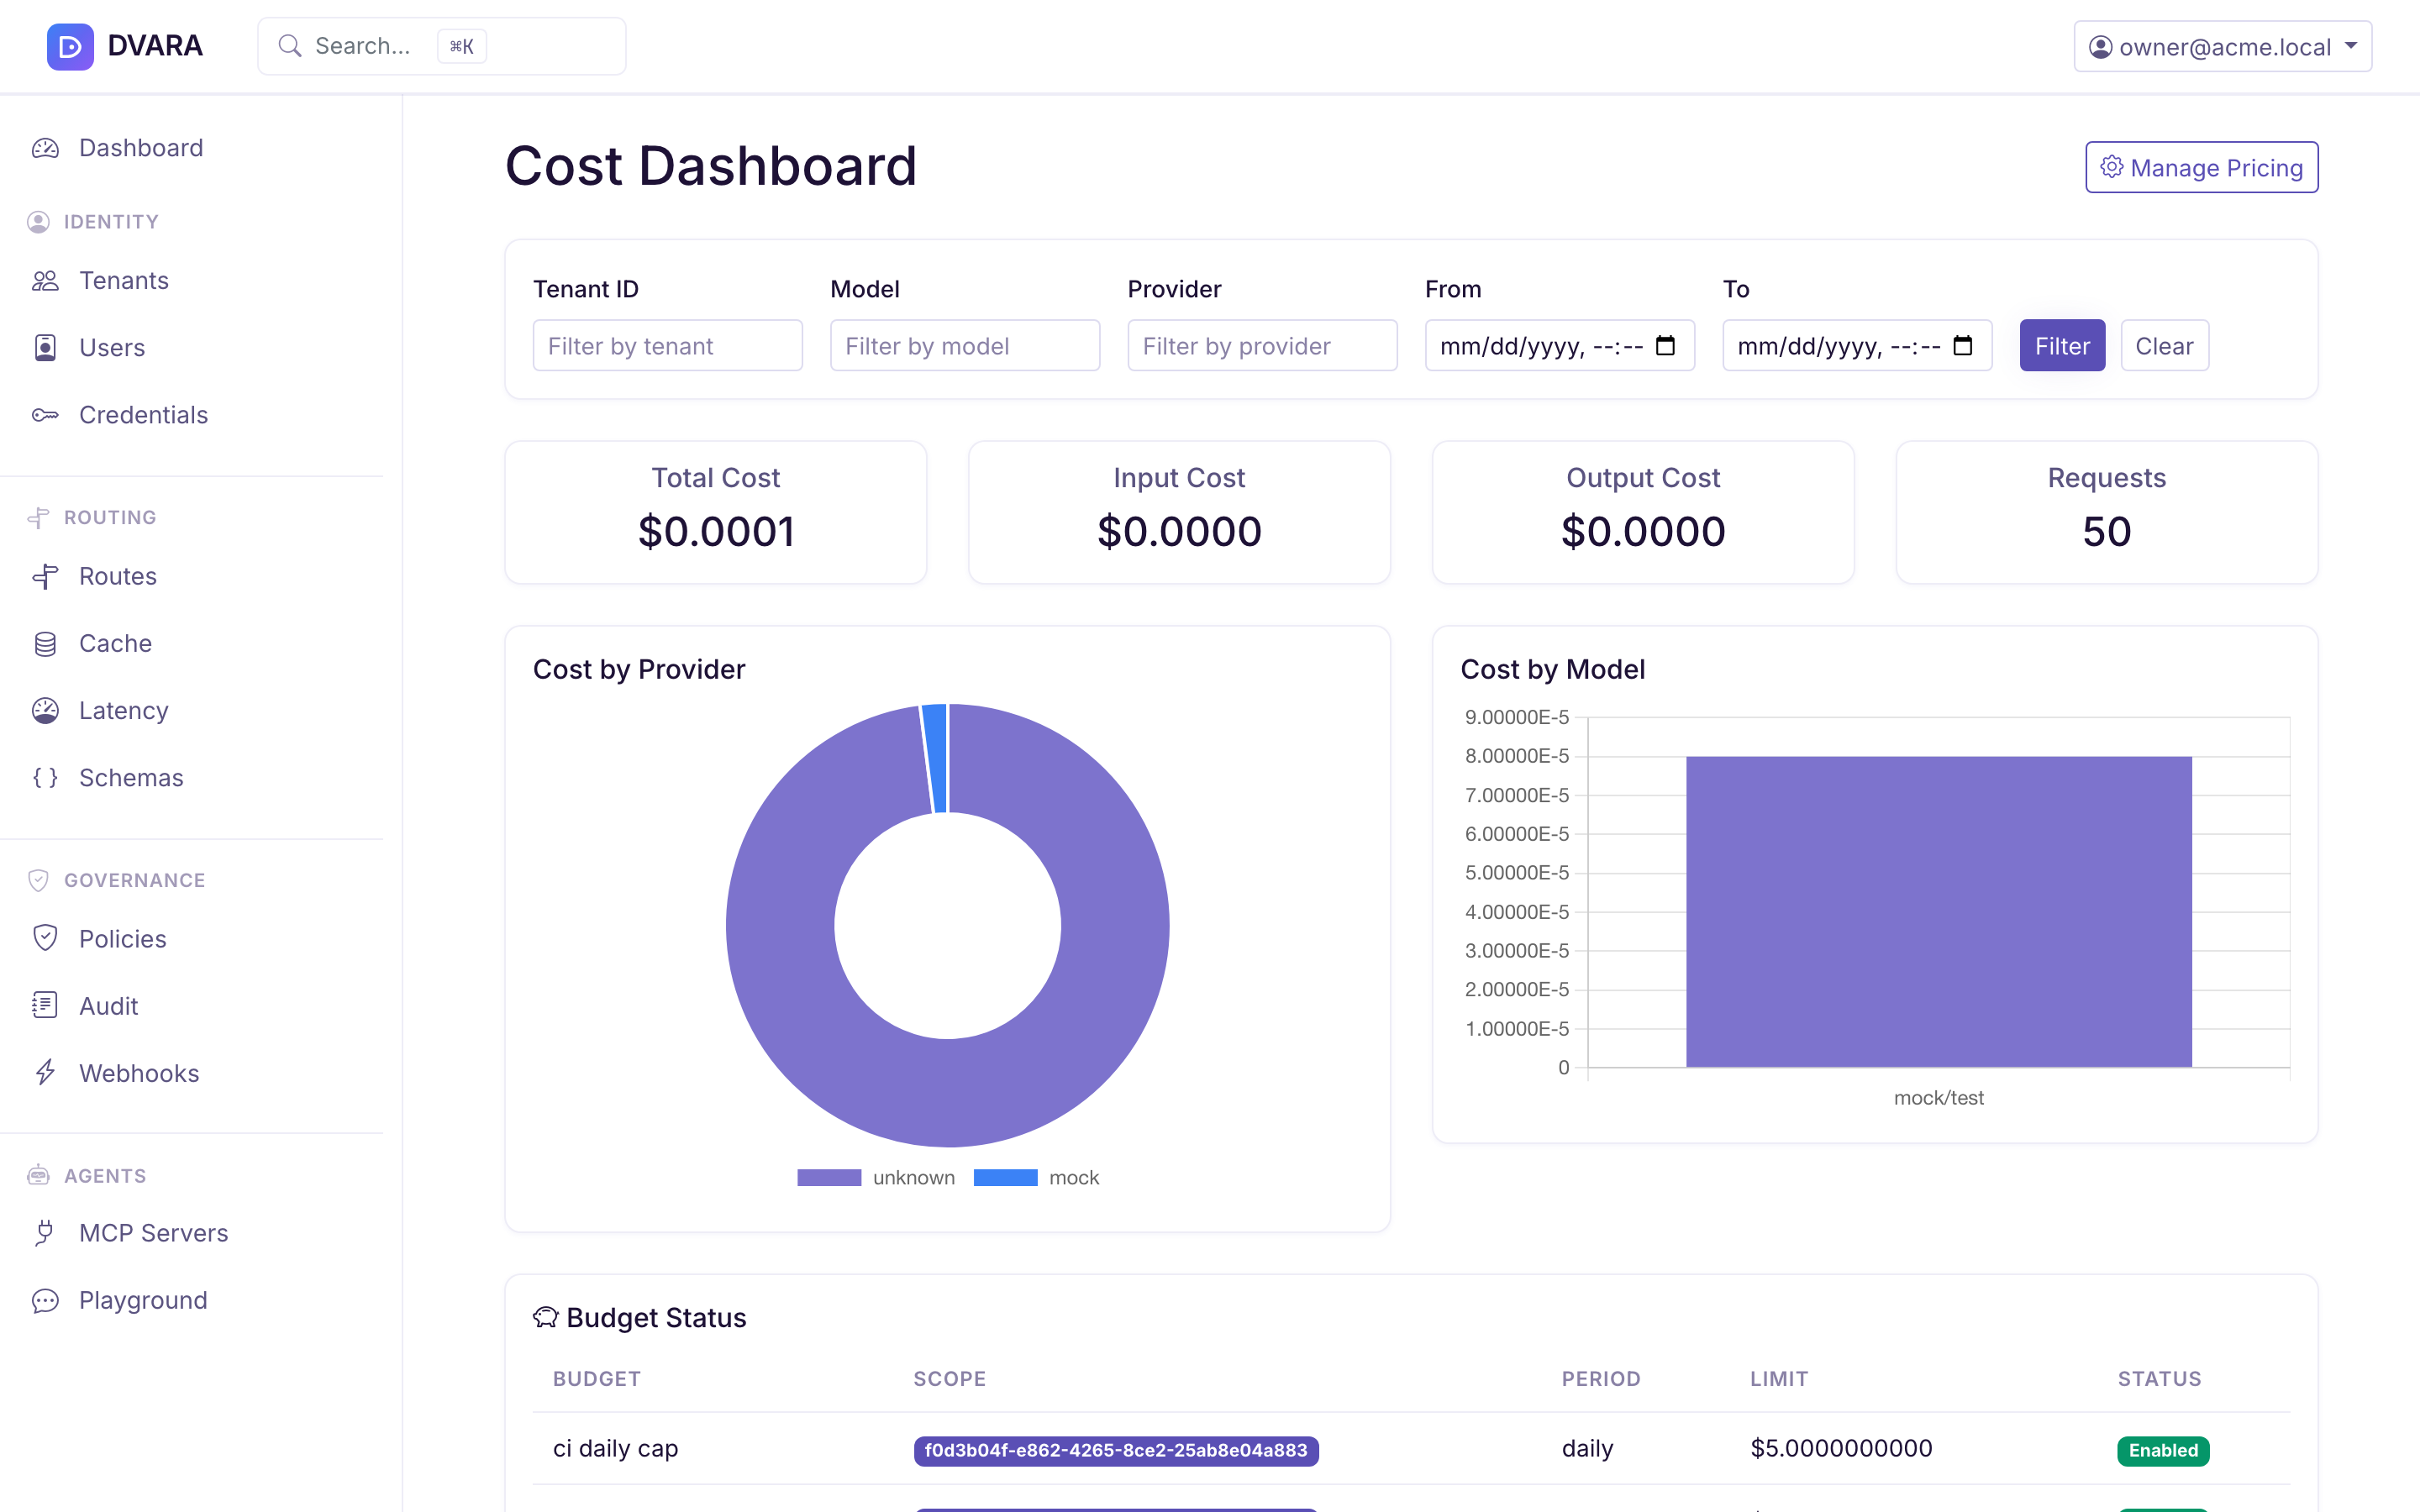
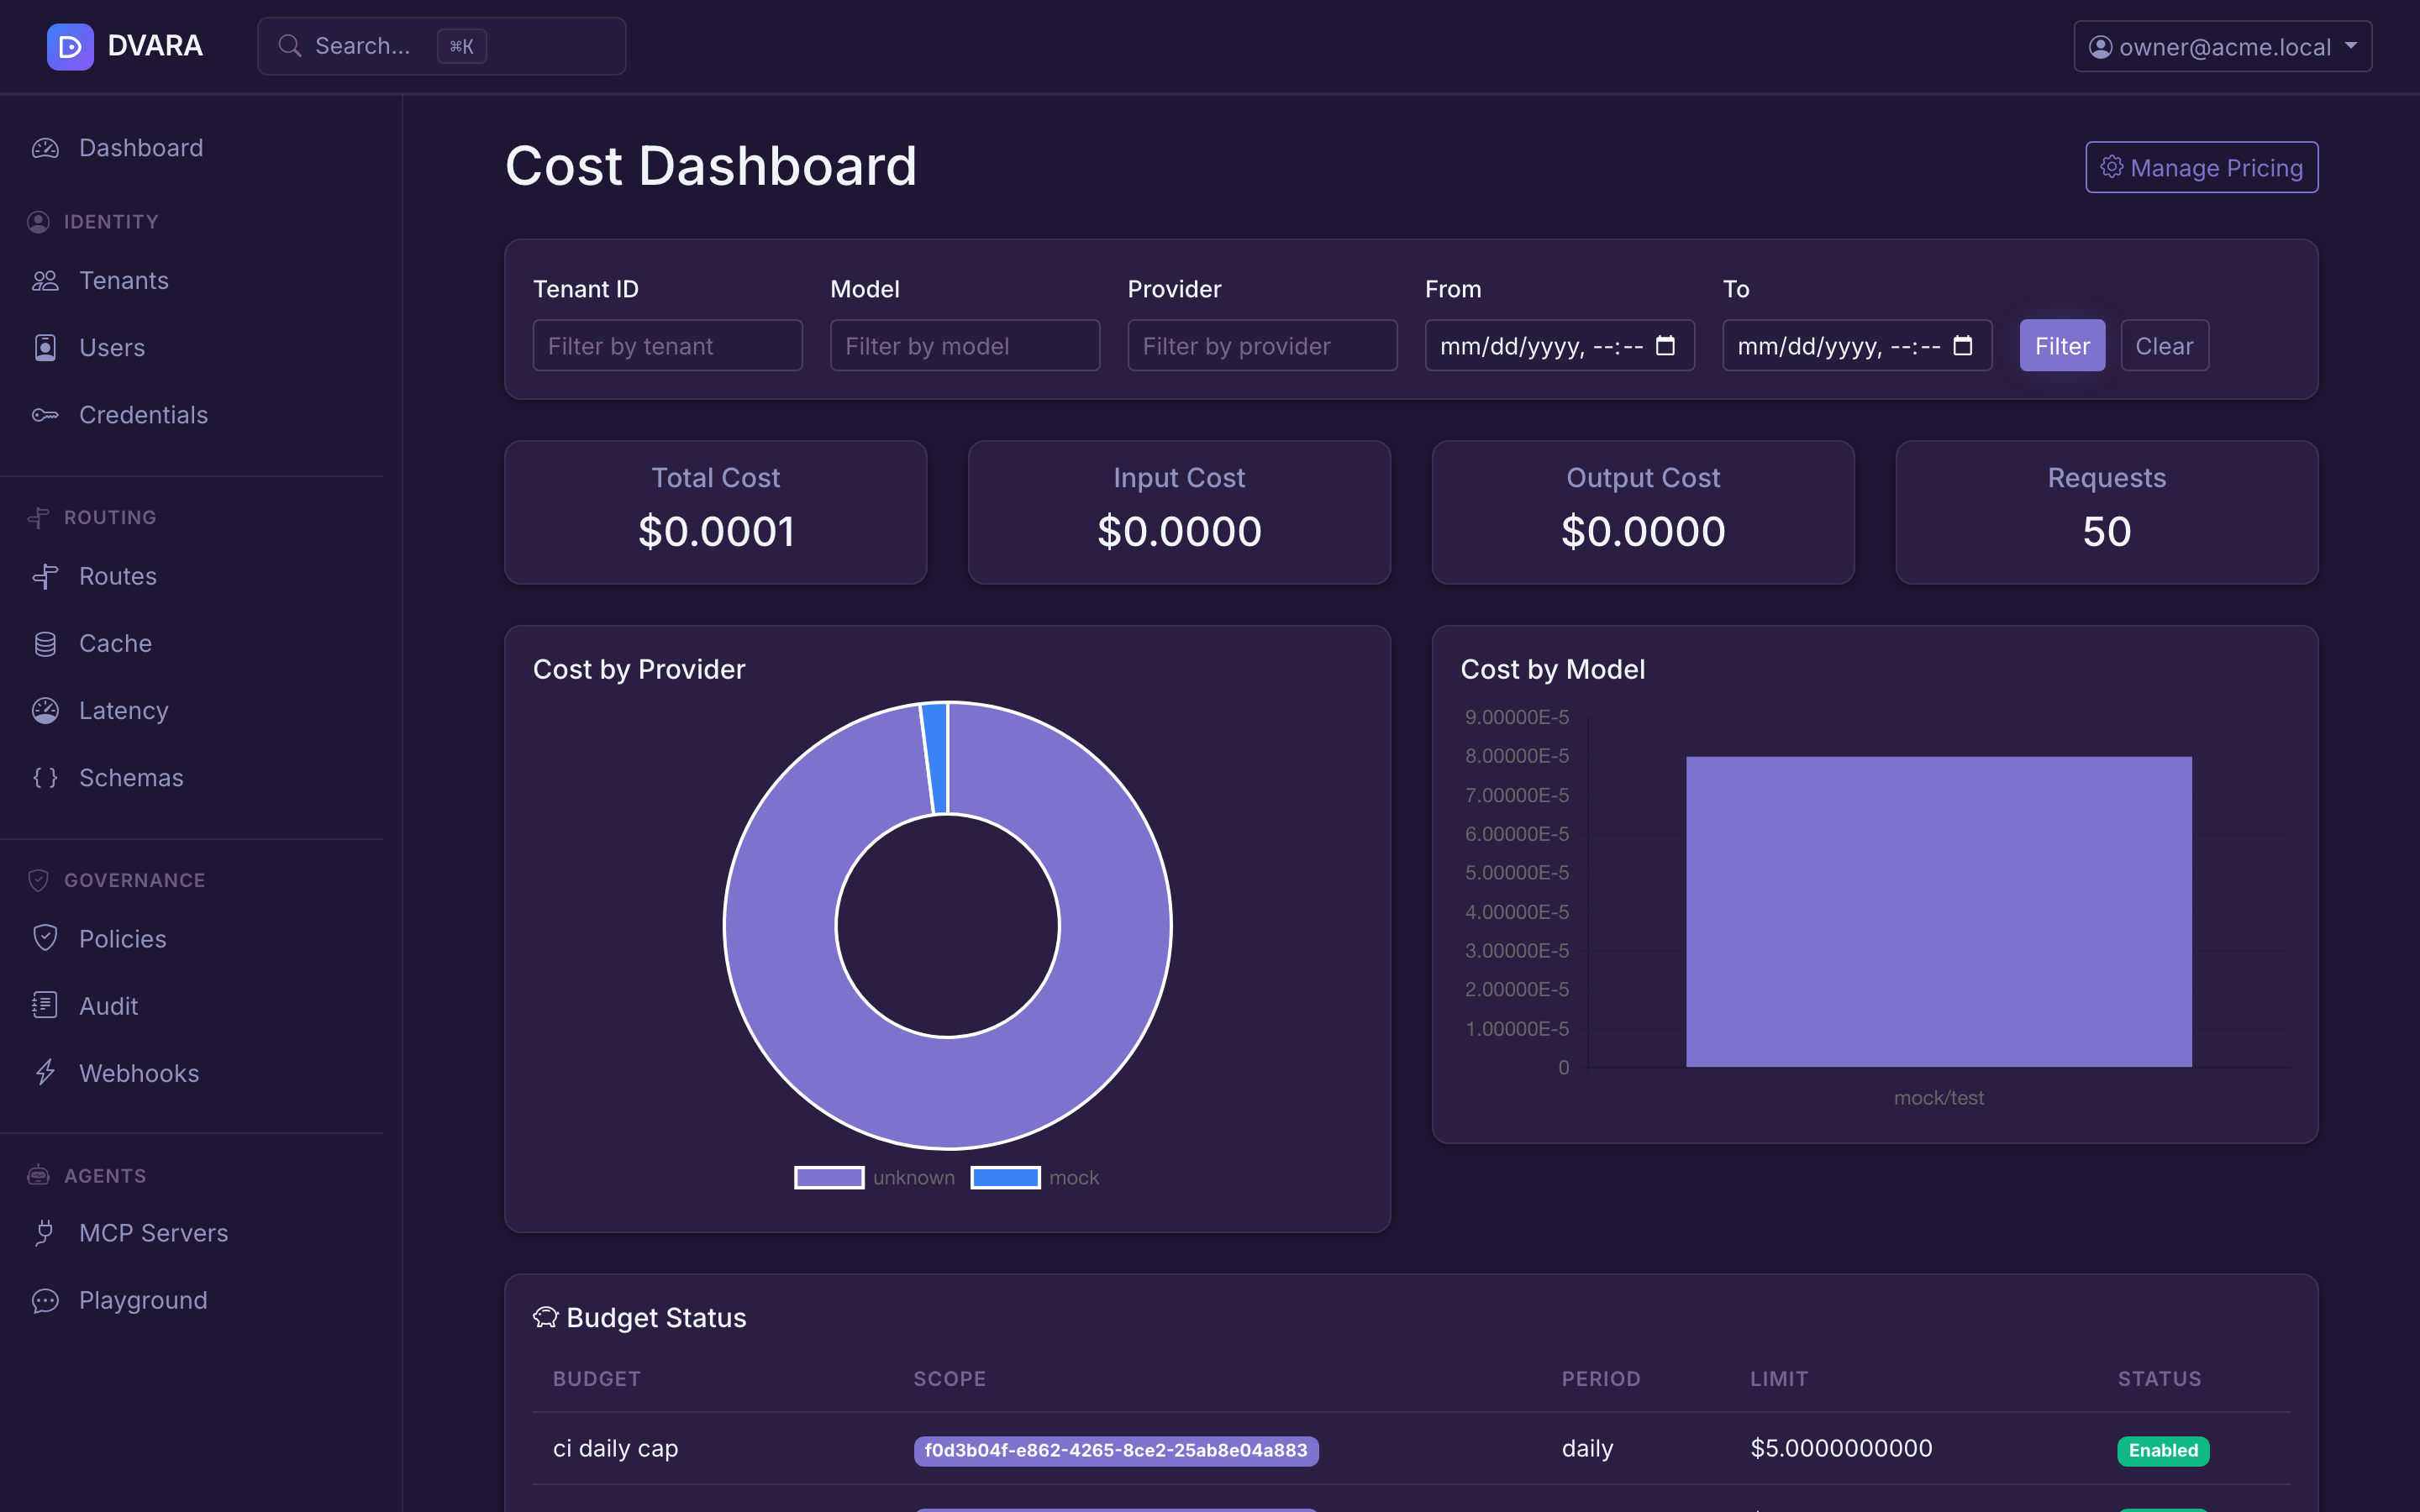
Open Cost → Cost Dashboard in the sidebar.
Cost records
A table of cost records with workspace, model, provider, input / output tokens, input / output cost, total cost, and timestamp. DVARA also stores the opaque API-key ID on each record, but this table does not display it; use the Token Usage tab of Cost → Cost Dashboard when you need per-key attribution. Auto-refreshes every 5 seconds.
Filters: narrow by workspace, model, provider, and date range.
From 1.8.4 a From or To date the page cannot read, such as not-a-date or 08/17/2026, is refused on that field, and the message stays under it. No rows are listed and no totals, charts or tag spend are shown until you fix the date. The 5-second refresh keeps the date as typed, so it cannot bring the rows back. The Spend by tag CSV answers such a date with a 400 that names it. Before 1.8.4 the page dropped an unreadable date and listed and totalled the whole history.
Summary cards
Aggregated totals at the top of the page: total cost, total requests, total input tokens, total output tokens. From 1.8.5 the page also shows how many of the input tokens were cached reads and cache writes, and how many of the output tokens were reasoning. See Price cached and reasoning tokens.
Charts
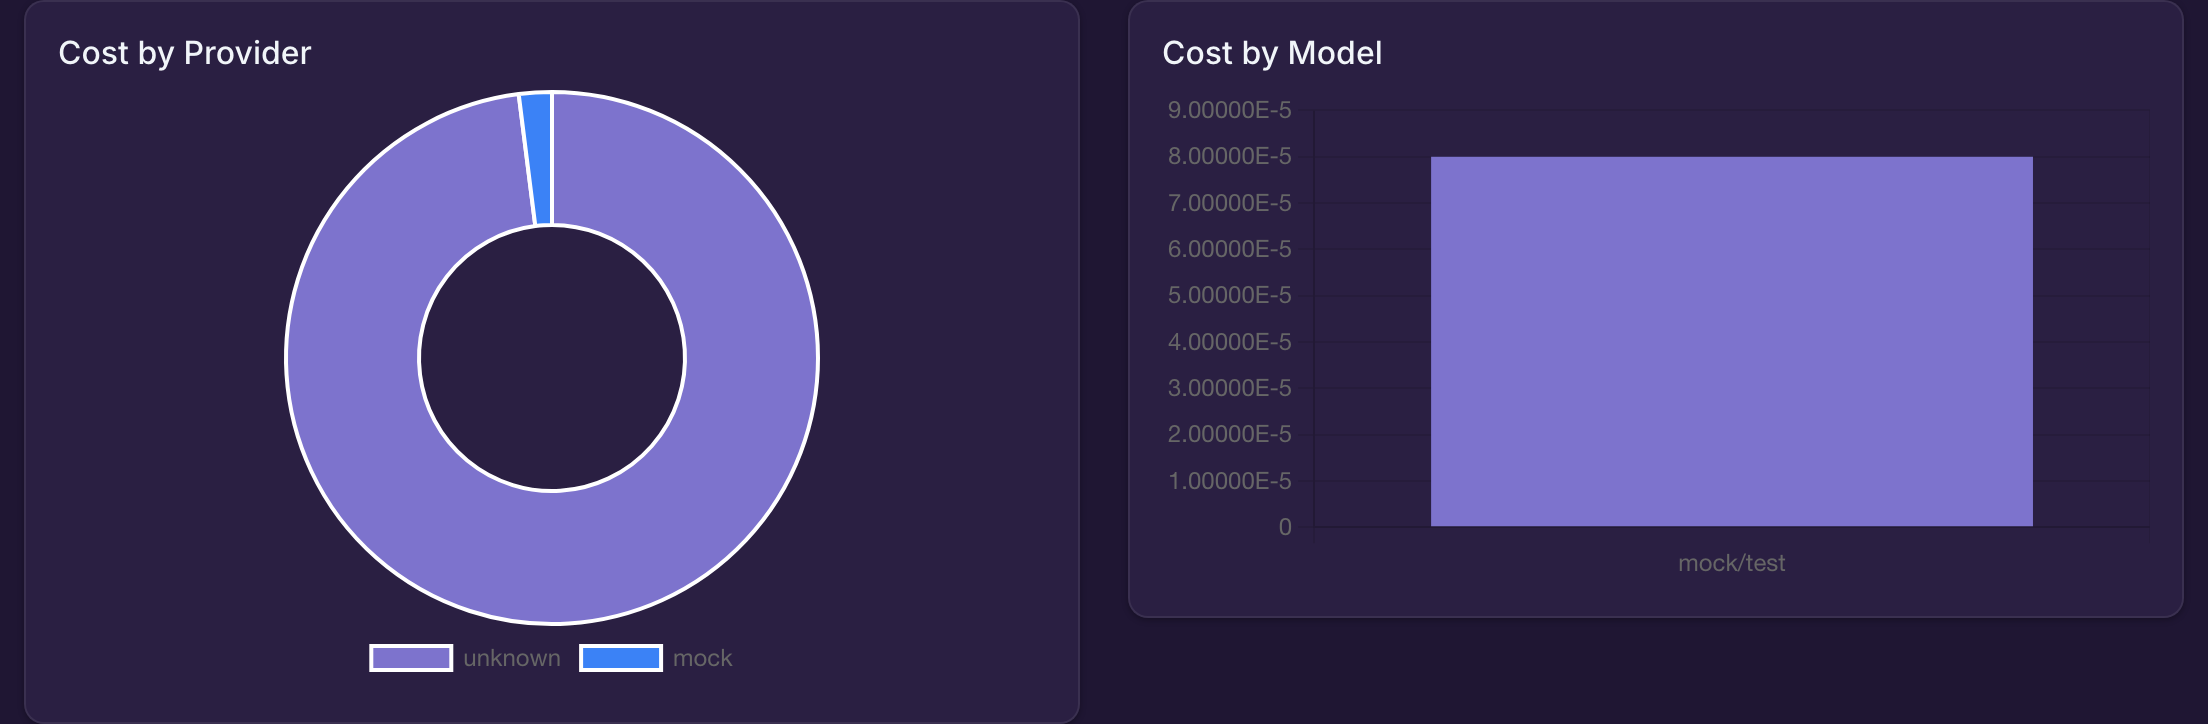
Two interactive visualizations:
- Cost by Provider — donut chart breaking down total spend by provider
- Cost by Model — horizontal bar chart showing spend per model
What a soft-limit crossing actually does
Crossing a soft limit writes a BUDGET_CAP_SOFT audit event. That is the whole delivery mechanism, and the rest follows from it:
- There is no email. Nothing in the budget path sends mail. To be notified, subscribe a webhook to
BUDGET_CAP_SOFT— it is a supported webhook event type — and the webhook retry and delivery-log behaviour then applies, the same as any other event. - Deduplication is a per-budget cooldown,
dvara.llm-gateway.finops.soft-alert-cooldown-minutes, default 60. Inside the window the crossing is silently skipped rather than re-emitted.
It is held in memory in the enforcer, so each replica keeps its own. A fleet of N pods can emit up to N alerts per cooldown window for one budget, and a restart clears the memory — so a rolling deploy can produce another. Size an on-call rule for that, or dedupe on budget_id downstream.
BUDGET_CAP_HARD is emitted the same way and is likewise a subscribable webhook event.
Budget status panel
Shows active budget caps with current spend vs. limit progress bars. Color-coded: green under the soft limit, amber at the soft limit, red at the hard limit.
Forecast cards
Shows 7-day trailing cost forecasts per model with projected month-end spend and trend indicators (increasing / decreasing / stable).
Anomaly alerts
Lists detected cost anomalies with workspace, model, current daily rate vs. baseline, deviation percentage, and detection timestamp. The threshold is configurable globally via dvara.llm-gateway.finops.anomaly-threshold-pct and per-workspace by setting cost.anomaly-threshold-pct in the workspace metadata.

Spend grouped by tag
The chargeback question — which team spent this — answered from the cost dashboard's tagKey filter. Supply a tag key and the page groups spend by that tag's values.
Opt-in by key, with no default, because tags are workspace-defined: there is no key DVARA can guess, so there is no panel until you name one. The grouping respects the page's workspace filter, so a scoped view reports that workspace's spend rather than the fleet's.
Credential Forensics
Cost → Cost Dashboard → Token Usage → By credential (/token-usage/by-credential, owner only) answers the reverse lookup: which workspaces sent traffic under this provider credential.
This is the page an abuse report sends you to. A provider tells you a key of yours is generating traffic they object to; on a shared or BYOK-mixed install, this is what turns that key back into a list of workspaces. Owner-only because it deliberately crosses workspace boundaries.
Token Usage page
Export the billing-grade monthly true-up with an owner or billing-admin Flightdeck session:
curl --fail --location --cookie "$DVARA_FLIGHTDECK_COOKIE" \
  "https://<flightdeck-host>/token-usage/export?workspace_id=<workspace-id>&month=2026-09&format=csv" \
  --output token-usage-2026-09.csv
month uses YYYY-MM; format is csv or json. workspace_id scopes the export to one workspace.
From 1.8.5 the export adds cached_input_tokens, cache_write_tokens and
reasoning_tokens: after its old totals, and as the last three columns of each
model row. A reader keyed on column position keeps working.
From 1.8.6 it also gives governed_calls: LLM requests, MCP tool calls and A2A
hops added together for the month, the number a licence agreement's volume and
over-use are measured against. It is the last summary line of the CSV, and
governedCalls in the JSON. Every install counts, with or without a licence.
For per-request token detail — the raw records underneath the dollar aggregates — open Cost → Cost Dashboard in the sidebar and choose the Token Usage tab. The page carries a filter form (workspace, API key, model, date range) that drives a summary KPI card (input / output / total tokens, request count, average tokens-per-request; from 1.8.5 also cached-input, cache-write and reasoning tokens) and a records table (newest first, key name and public prefix, plus an estimated-flag tooltip on rows where the upstream didn't return exact counts). Pagination caps at 1000/page; default 50.
The persisted value behind that label is the key's opaque ID, not its bearer
secret or display prefix. The same ID connects token usage, cost records,
per-key budgets, access logs, audit evidence, analytics, and chargeback exports.
An unauthenticated request is attributed to anonymous. You can filter Token
Usage with the visible prefix when it belongs to exactly one key in the selected
workspace; Flightdeck resolves that prefix to the ID before it searches.
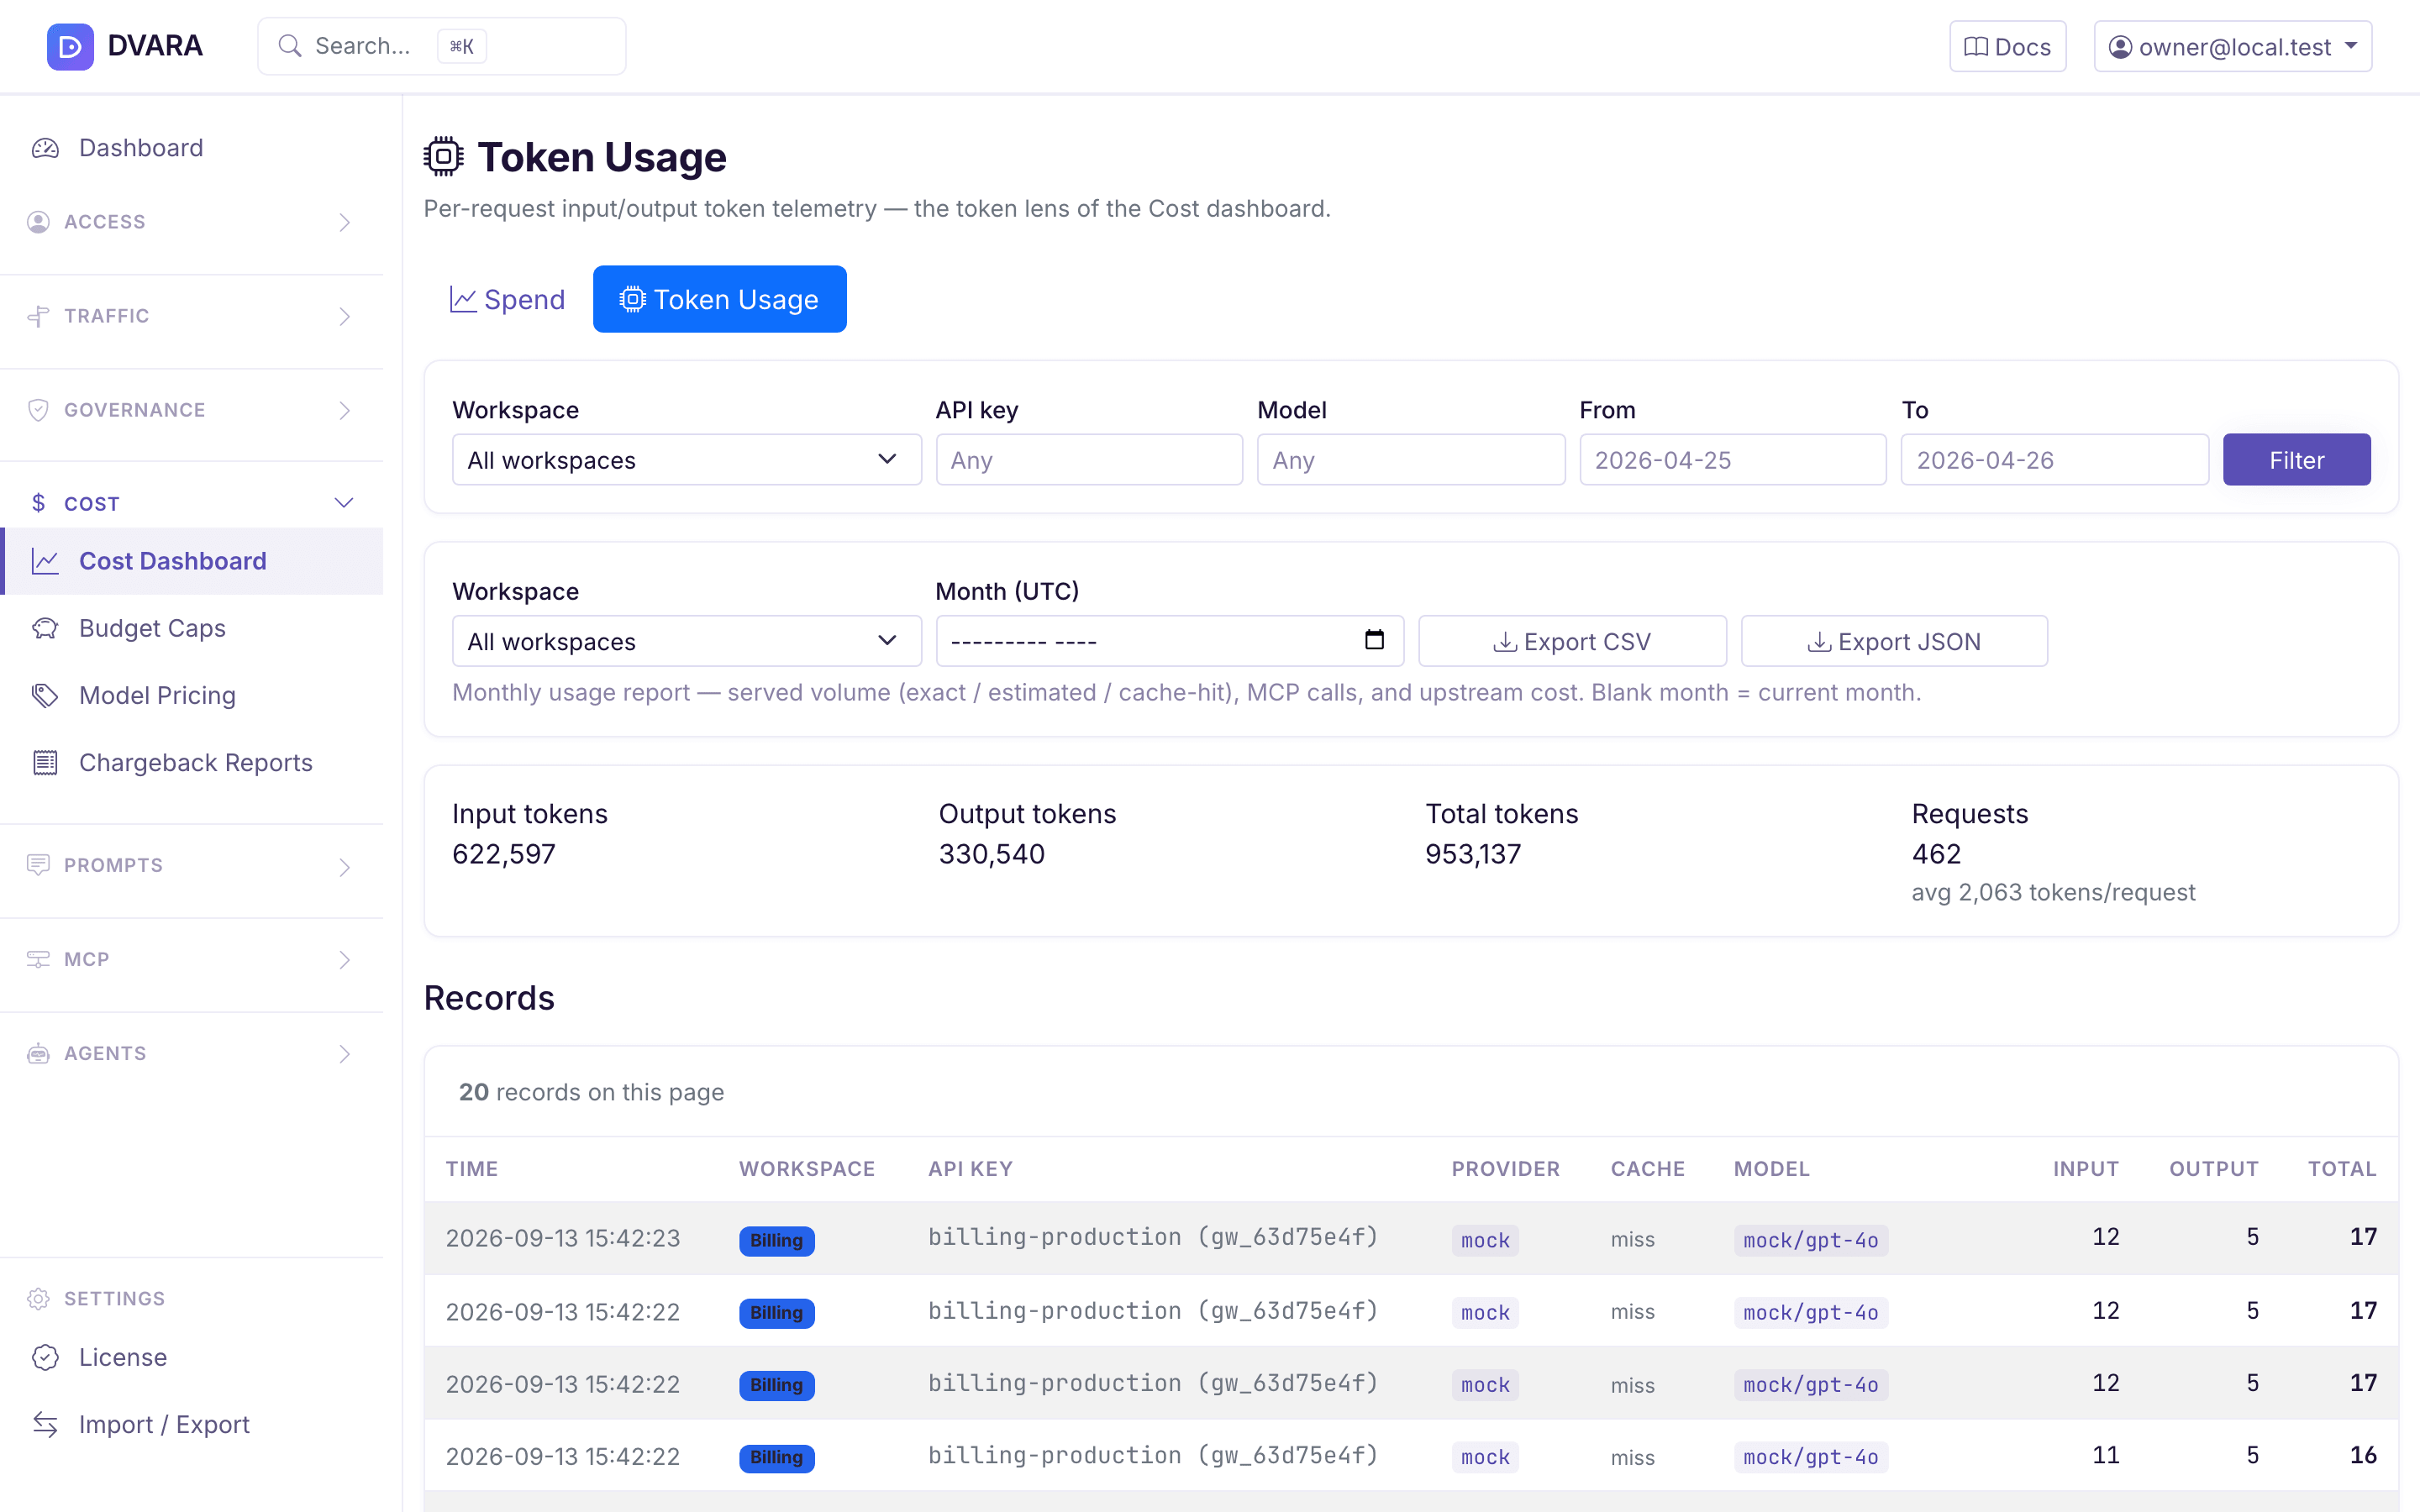
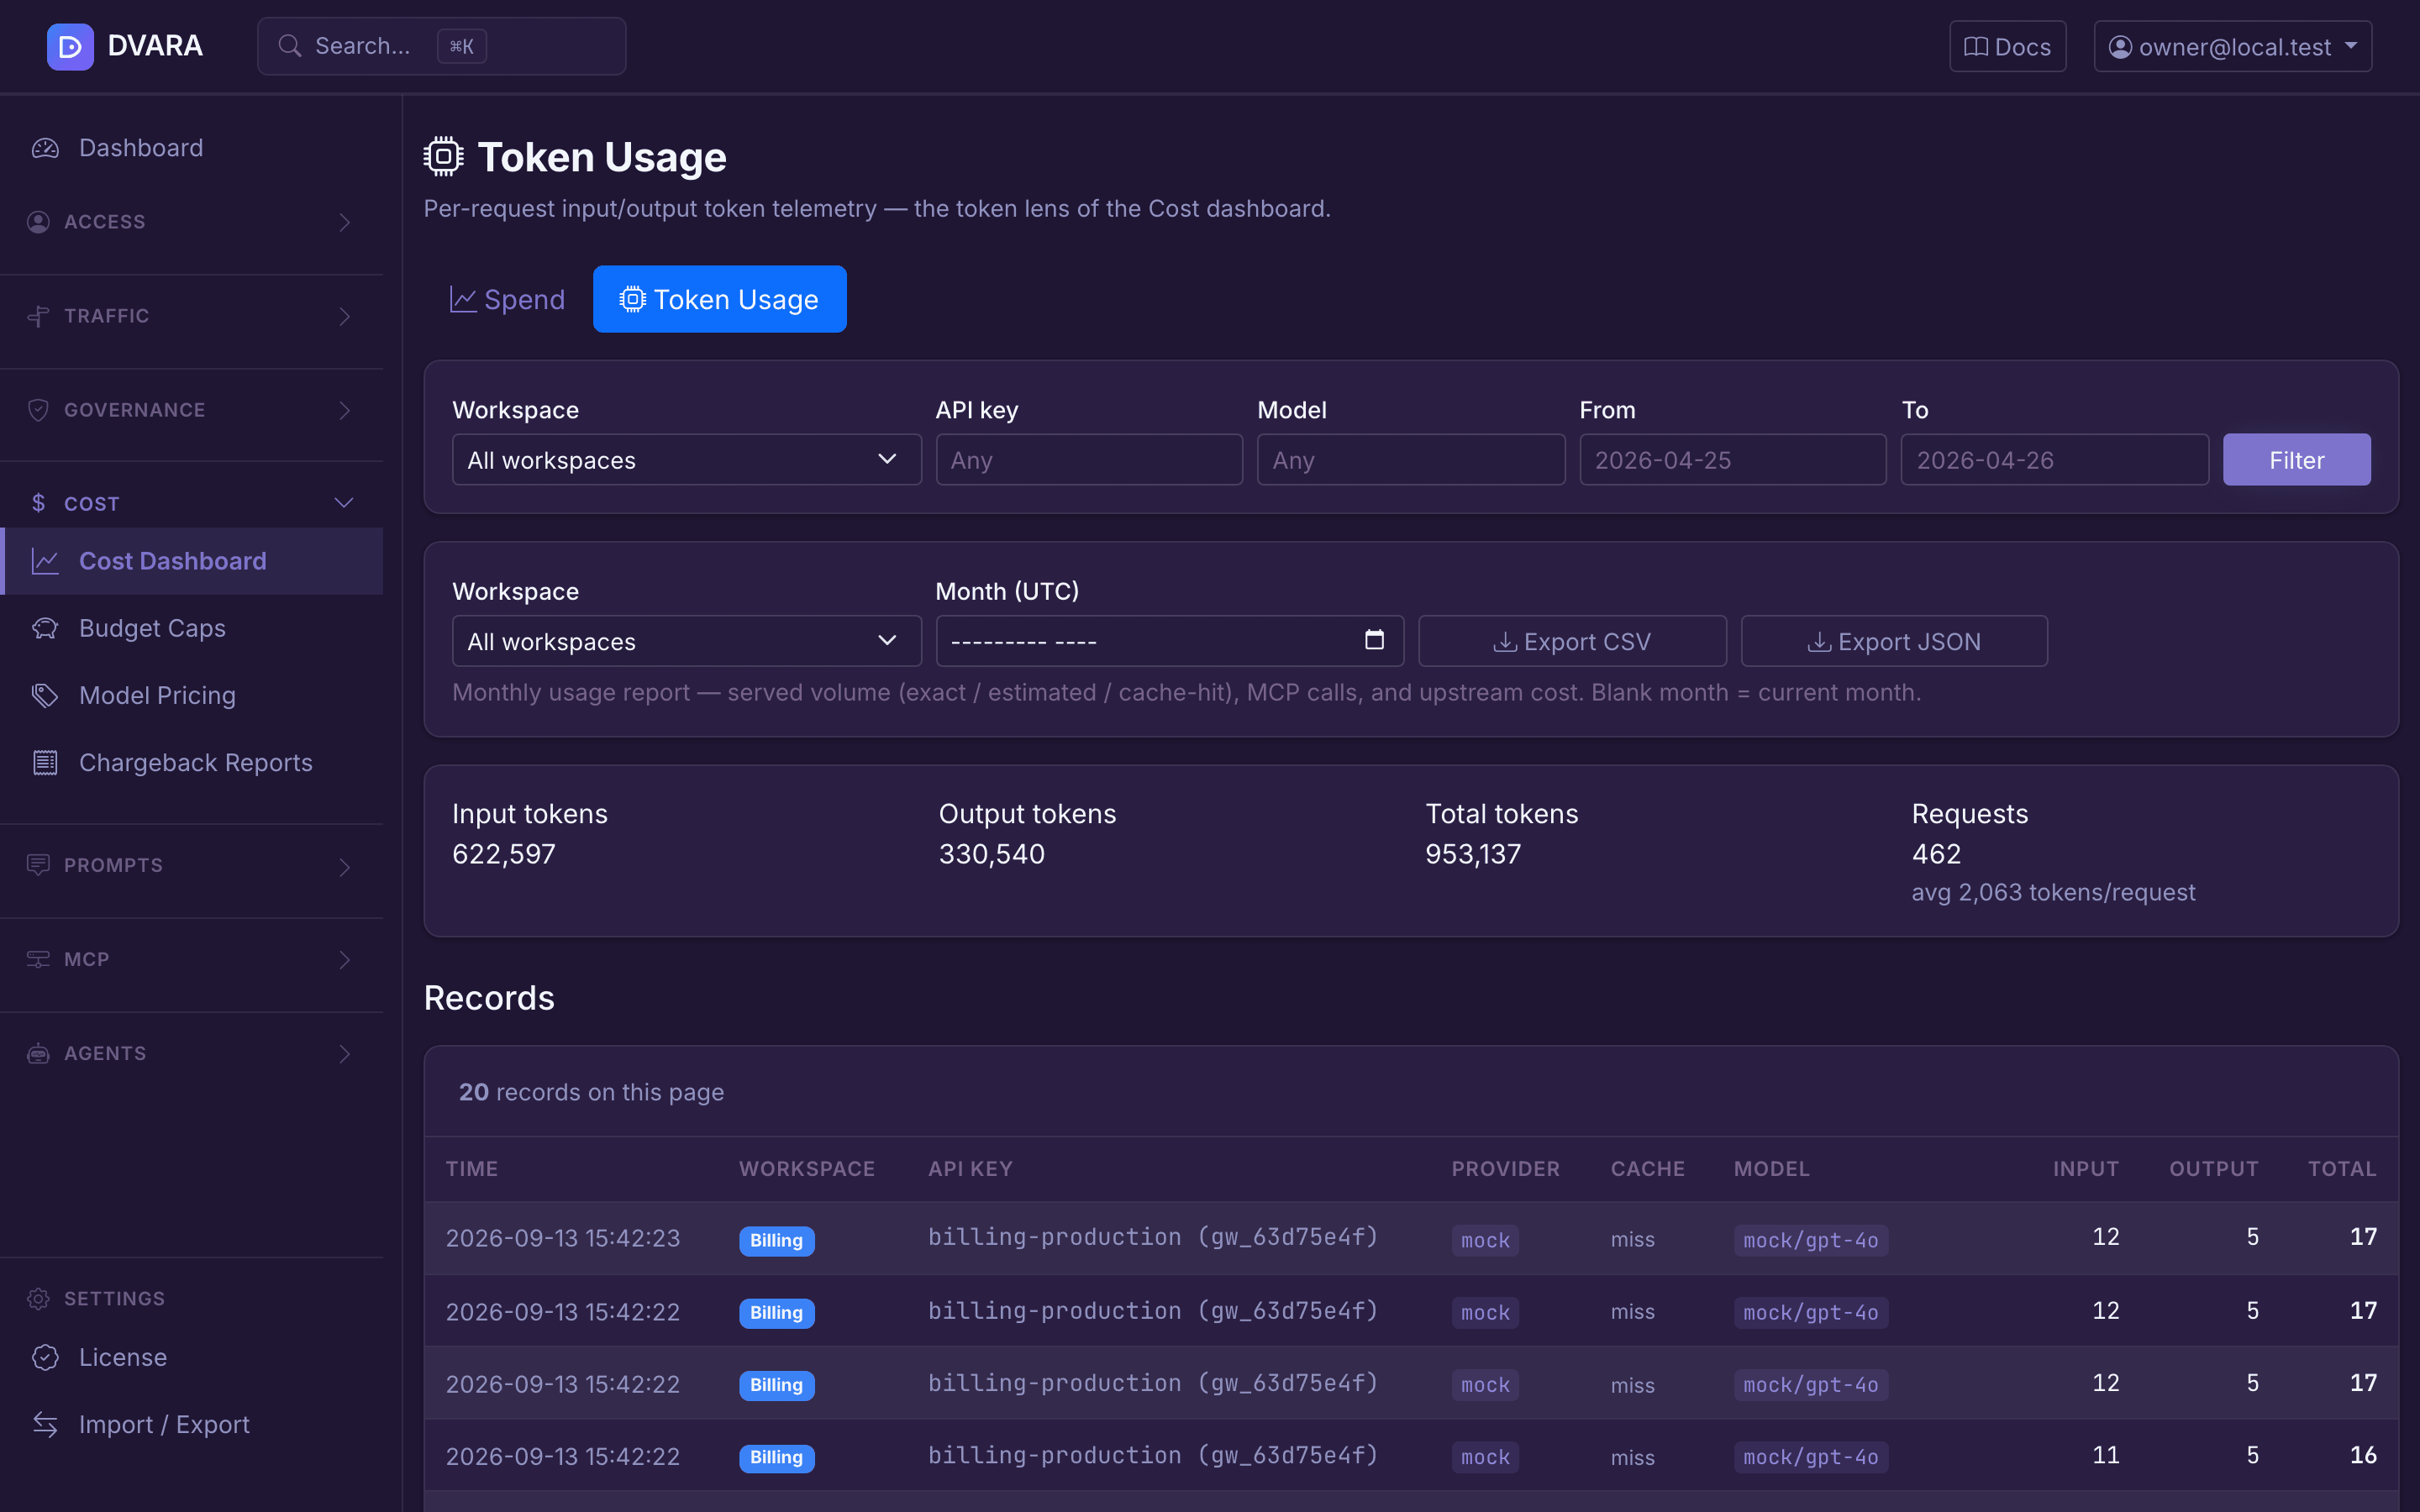
The Cost Dashboard is the dollar lens of the same data — tokens rolled up with pricing into spend figures grouped by workspace / model / provider / time range. Use the Cost Dashboard for spend visibility and budgets; use the Token Usage page for pricing audits, cost-per-token analysis, or reconciling a disputed workspace invoice.
Use the visible workspace, API-key, model, and date filters on this page to
narrow the list and summary. From 1.8.4 an unreadable From or To date is
refused on the field, and nothing is listed or totalled; before, the page
silently showed the whole history. The monthly export takes a month and
already refused a bad one. The former Automation API was removed in 1.7.0;
there is no supported administrative REST endpoint for these reports.
Model pricing
Open Cost → Model Pricing in the sidebar.
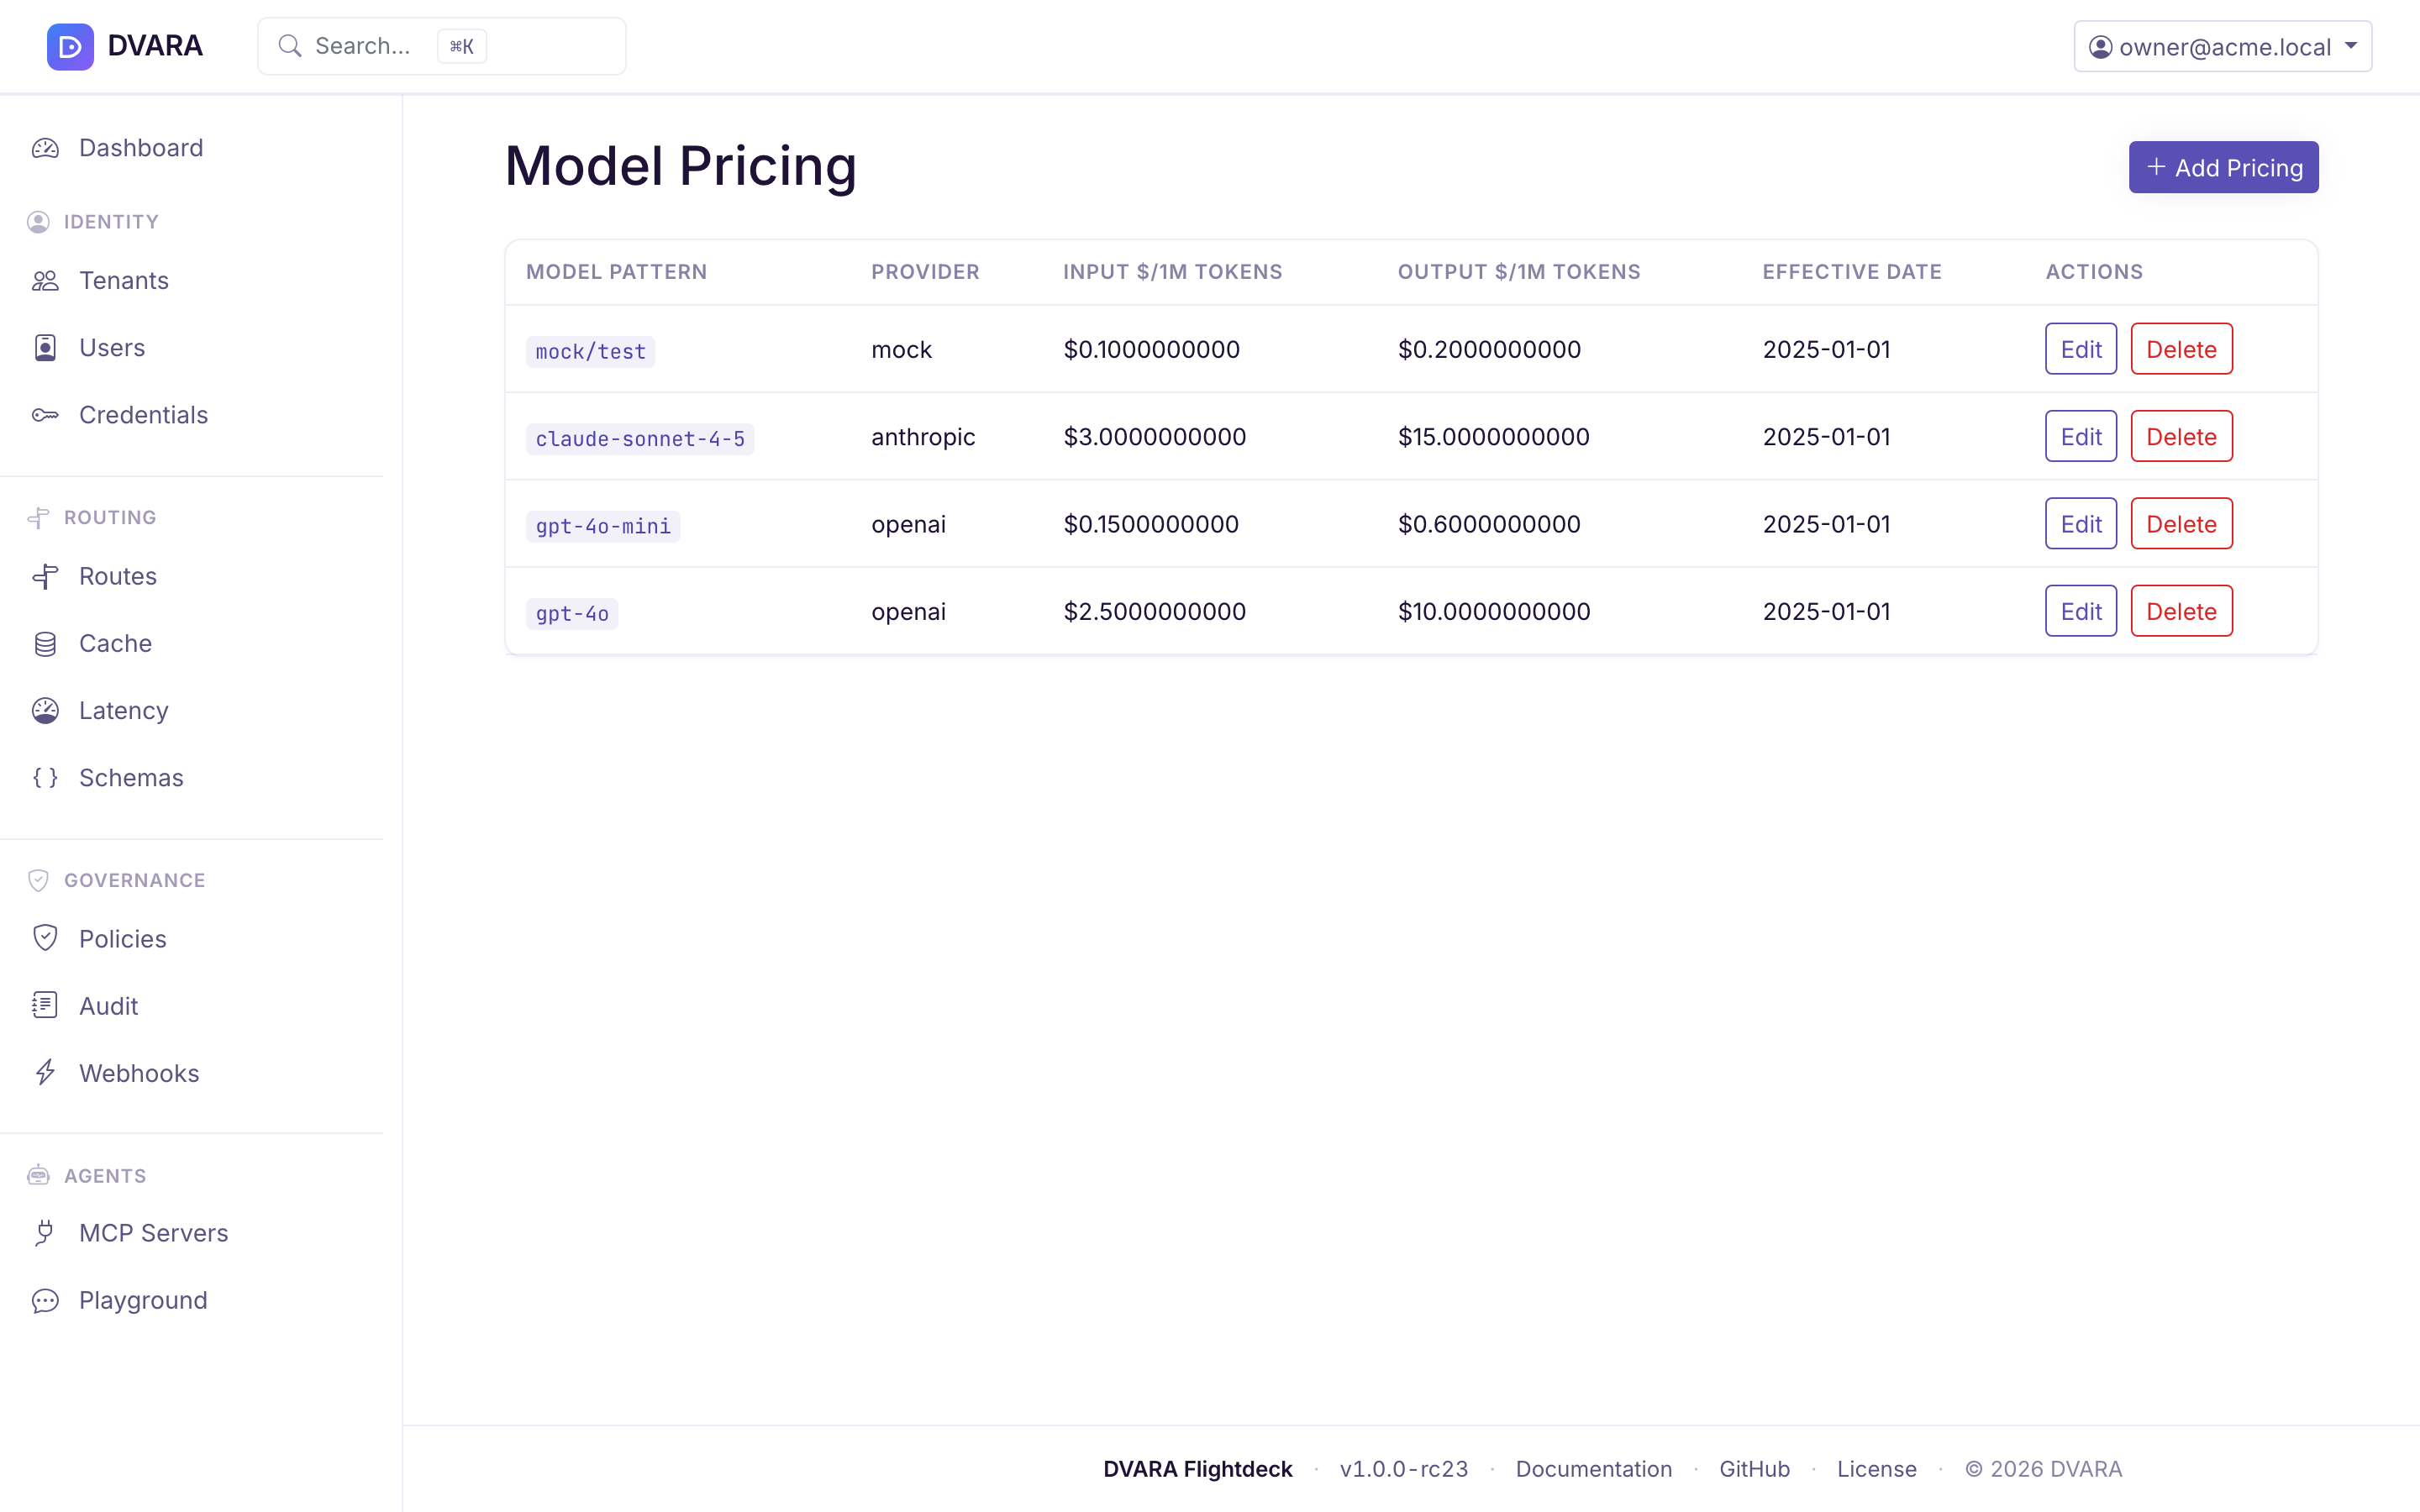
Pricing list
Lists every pricing entry with model pattern (glob), provider, input price per million tokens, output price per million tokens, effective date, and row actions. From 1.8.4, a cached, cache-write or reasoning rate that is set shows in small text under the input or output price.
Create / edit pricing
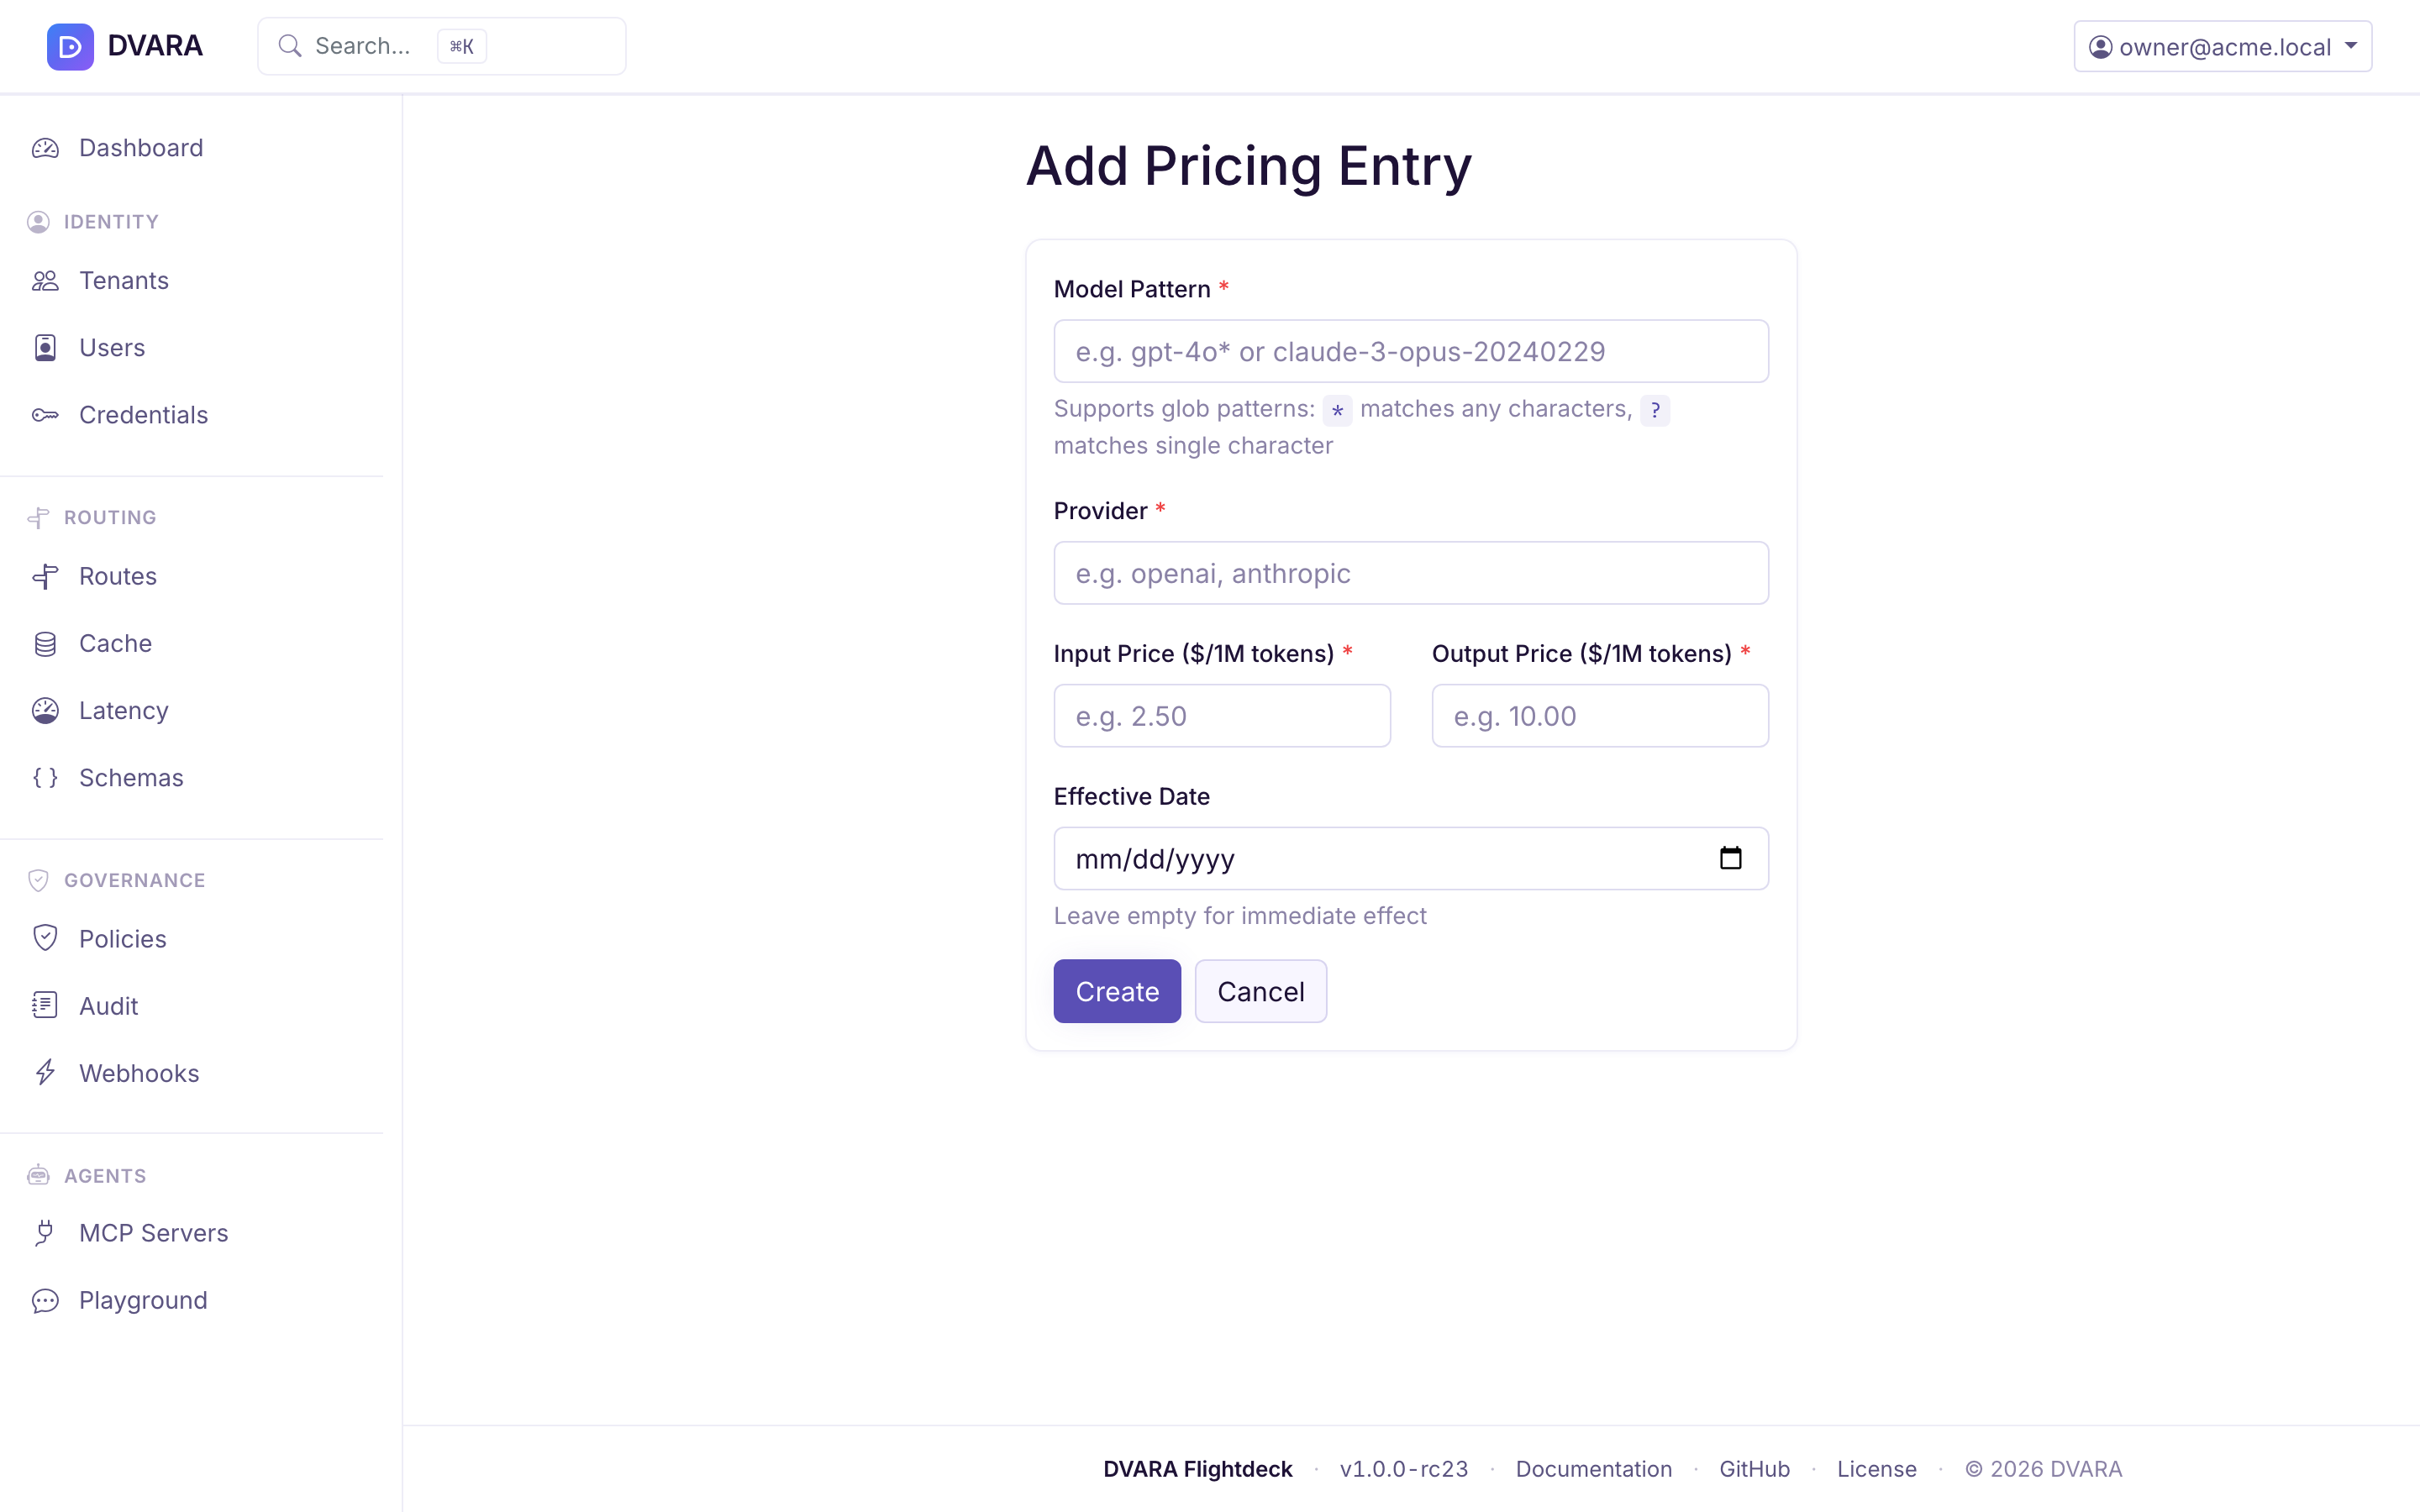
Click New Pricing to create an entry with:
- Model Pattern — glob pattern (e.g.
gpt-4o*,claude-3-sonnet*) - Provider — optional provider scope
- Input Price / Million — USD per 1 M input tokens
- Output Price / Million — USD per 1 M output tokens
- Cached Input Price, Cache Write Price, Reasoning Price (from 1.8.4, optional) — USD per 1 M input tokens read from the provider's prompt cache, input tokens written to it, and output tokens the model spends reasoning
- Effective Date — when this pricing takes effect
Click Delete to remove a pricing entry. Requires confirmation.
Price cached and reasoning tokens
From 1.8.4 the gateway reads how many input tokens came from the provider's prompt cache, how many were written to it, and how many output tokens went to reasoning. See the usage block. Providers price these differently: a cache read costs about a tenth of the input price, a cache write costs more than the input price, and a reasoning token costs the output price.
A call is priced in parts. Cached input tokens use the Cached Input Price, cache-write tokens use the Cache Write Price, and the rest of the input uses the Input Price. Reasoning tokens use the Reasoning Price, and the rest of the output uses the Output Price. An empty field charges those tokens at the plain input or output price, so an existing price row costs exactly what it did before 1.8.4. The rates reach gateways with the rest of the configuration, and a pricing change records the new rates in its audit event.
Usage and cost records store the cached-input, cache-write and reasoning counts. Records from before 1.8.4 read as zero. From 1.8.5 the reports show them: the Token Usage summary card, the Cost Dashboard, the monthly usage export, the chargeback model summary and its CSV, and the workspace Usage and chargeback pages. Each part is inside its input or output total, so no total changes. The pages say the parts cover only calls since the upgrade to 1.8.4. The per-model breakdown leaves out gateway cache hits, whose tokens are already counted once as cache-hit tokens. Before 1.8.5 the reports showed only the input and output totals.
Anthropic and Bedrock report cache reads and writes outside their input count, and Gemini did not count thinking tokens. From 1.8.4 these are included, so a call that uses prompt caching or thinking records more tokens than it did before. That matches what the provider bills.
How a price is chosen
DVARA considers only prices whose effective date is today or earlier. An exact
model name beats a glob; among globs, the more specific pattern wins; a tie uses
the later effective date. For example, a future gpt-4o* price remains dormant
until its date while today's exact gpt-4o-mini price continues to apply. A new
effective price is visible within
dvara.llm-gateway.finops.pricing-cache-ttl-seconds (default 60). Existing
cost records are not recalculated.
Budget caps
Open Cost → Budget Caps in the sidebar.
Budget caps govern spend in dollars. The Enterprise tier catalogue separately defines monthly LLM, MCP, and A2A governed-call quotas and whether a tier blocks at its hard cap.
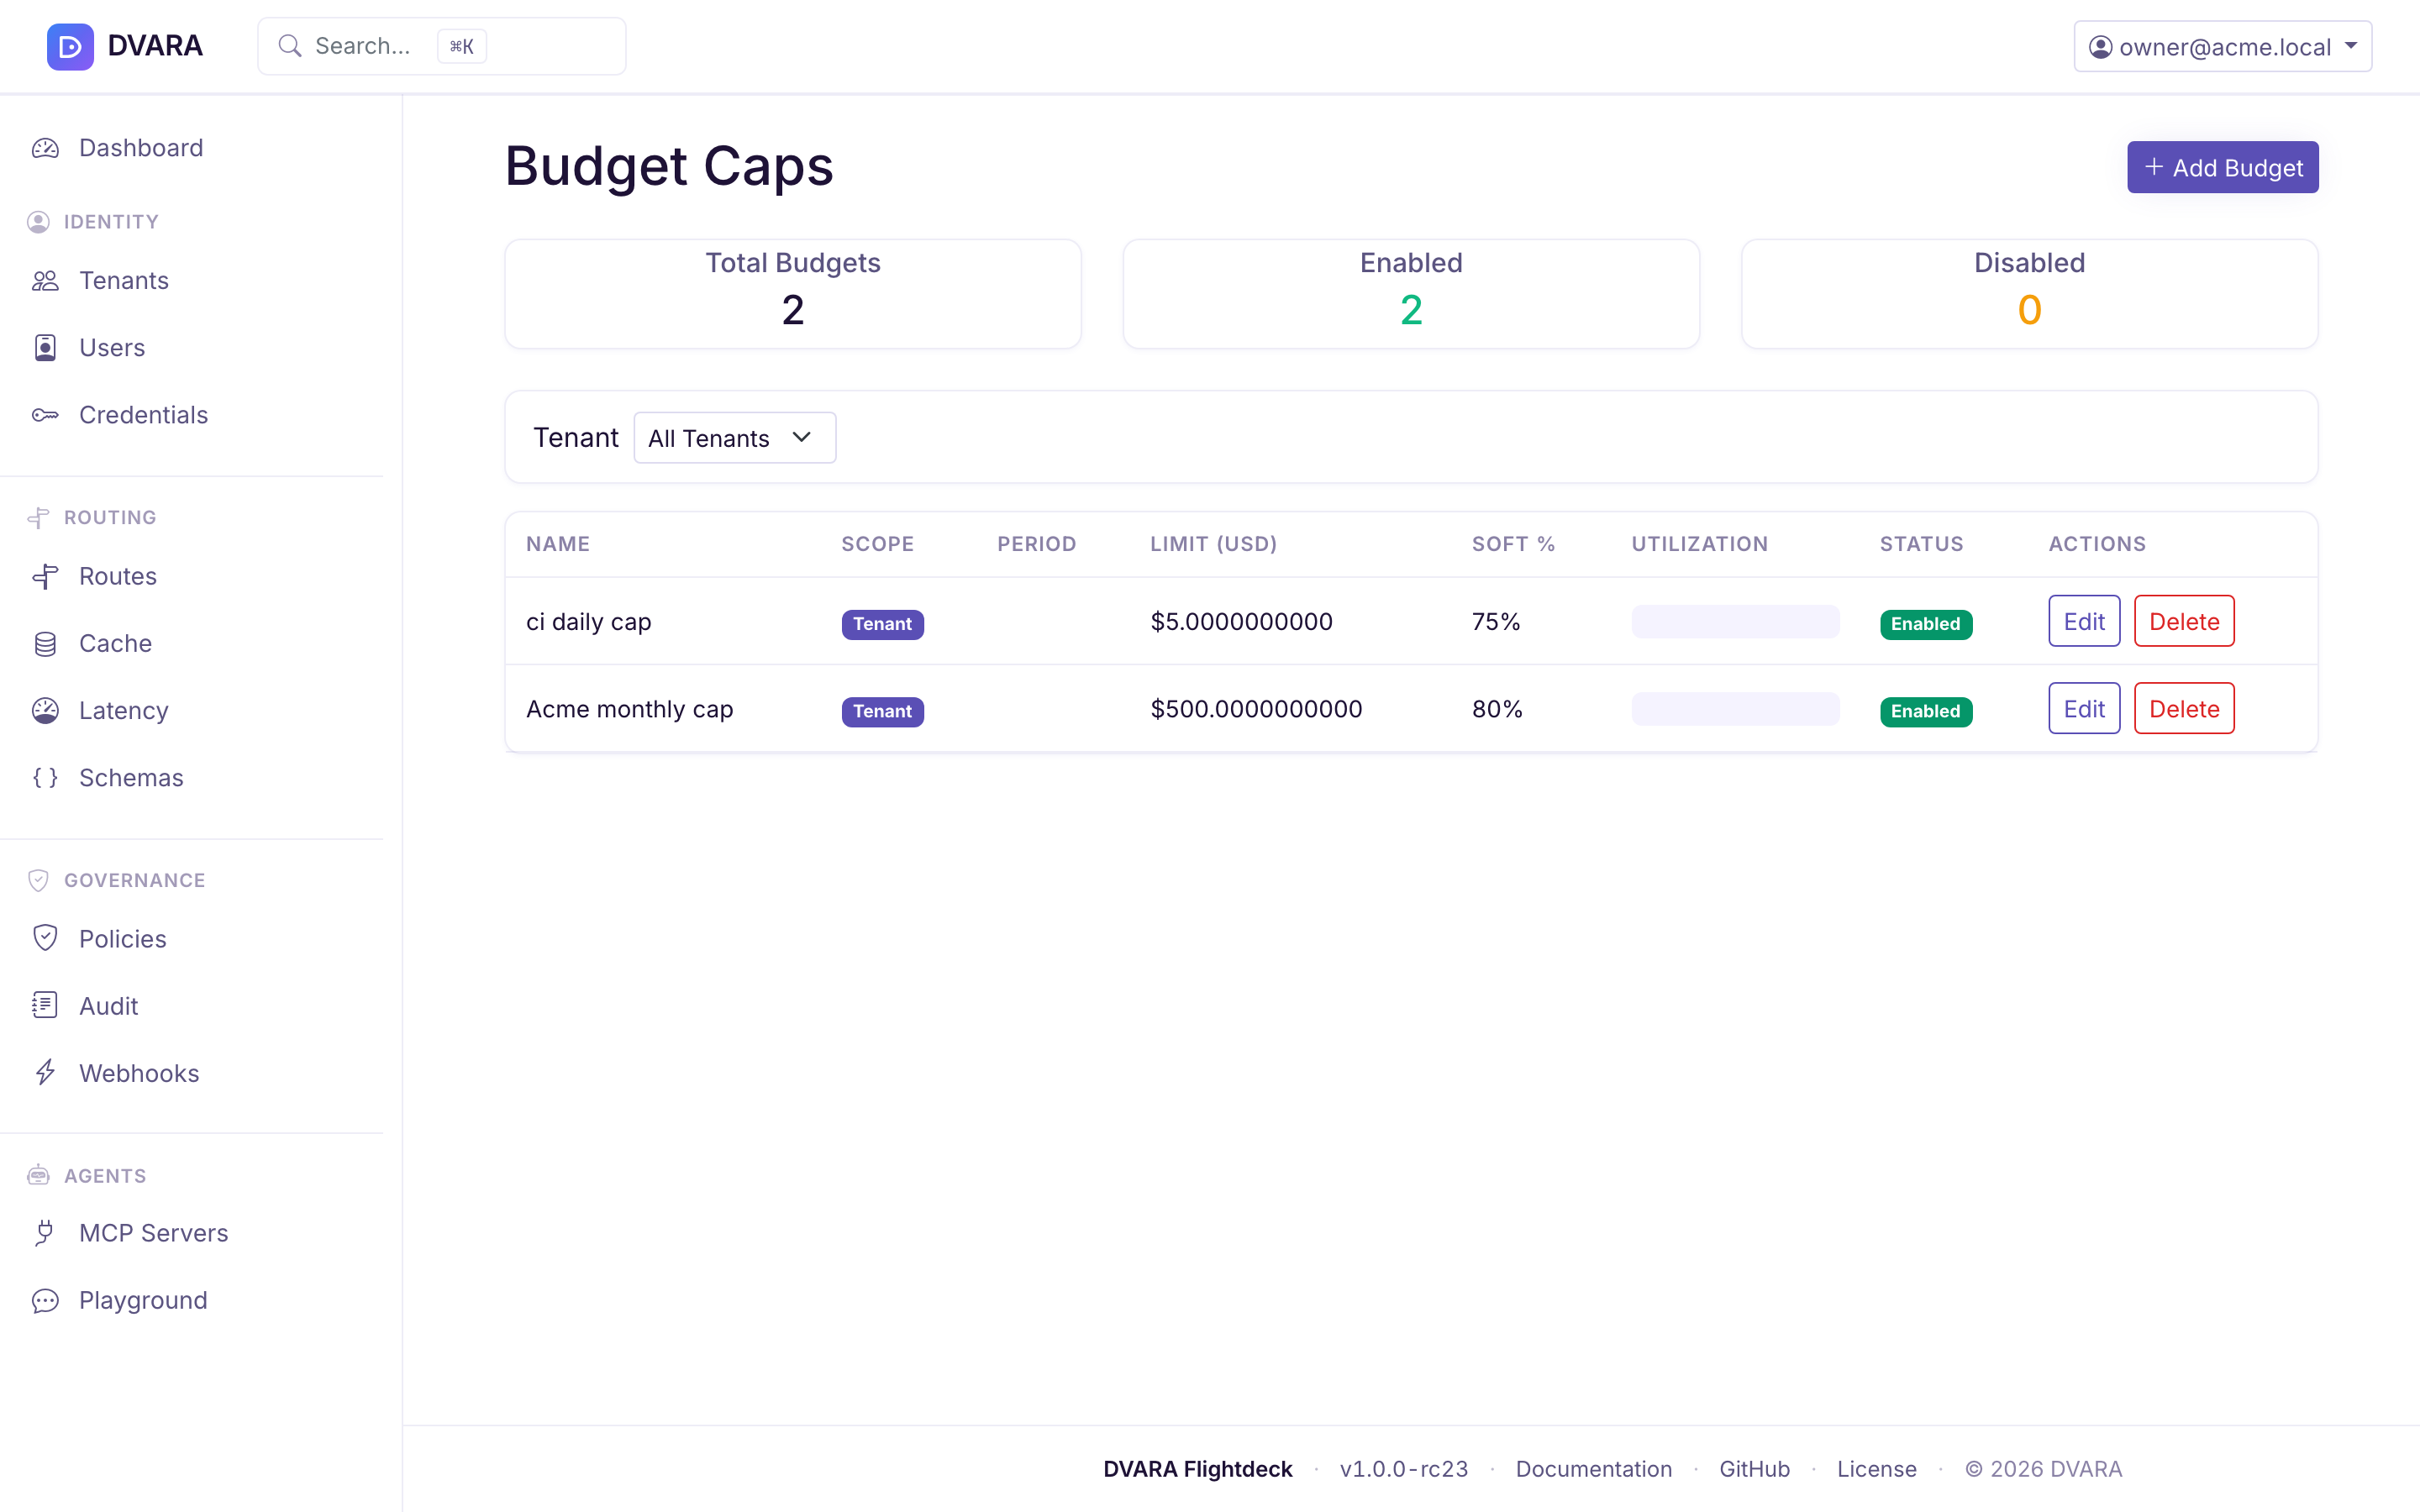
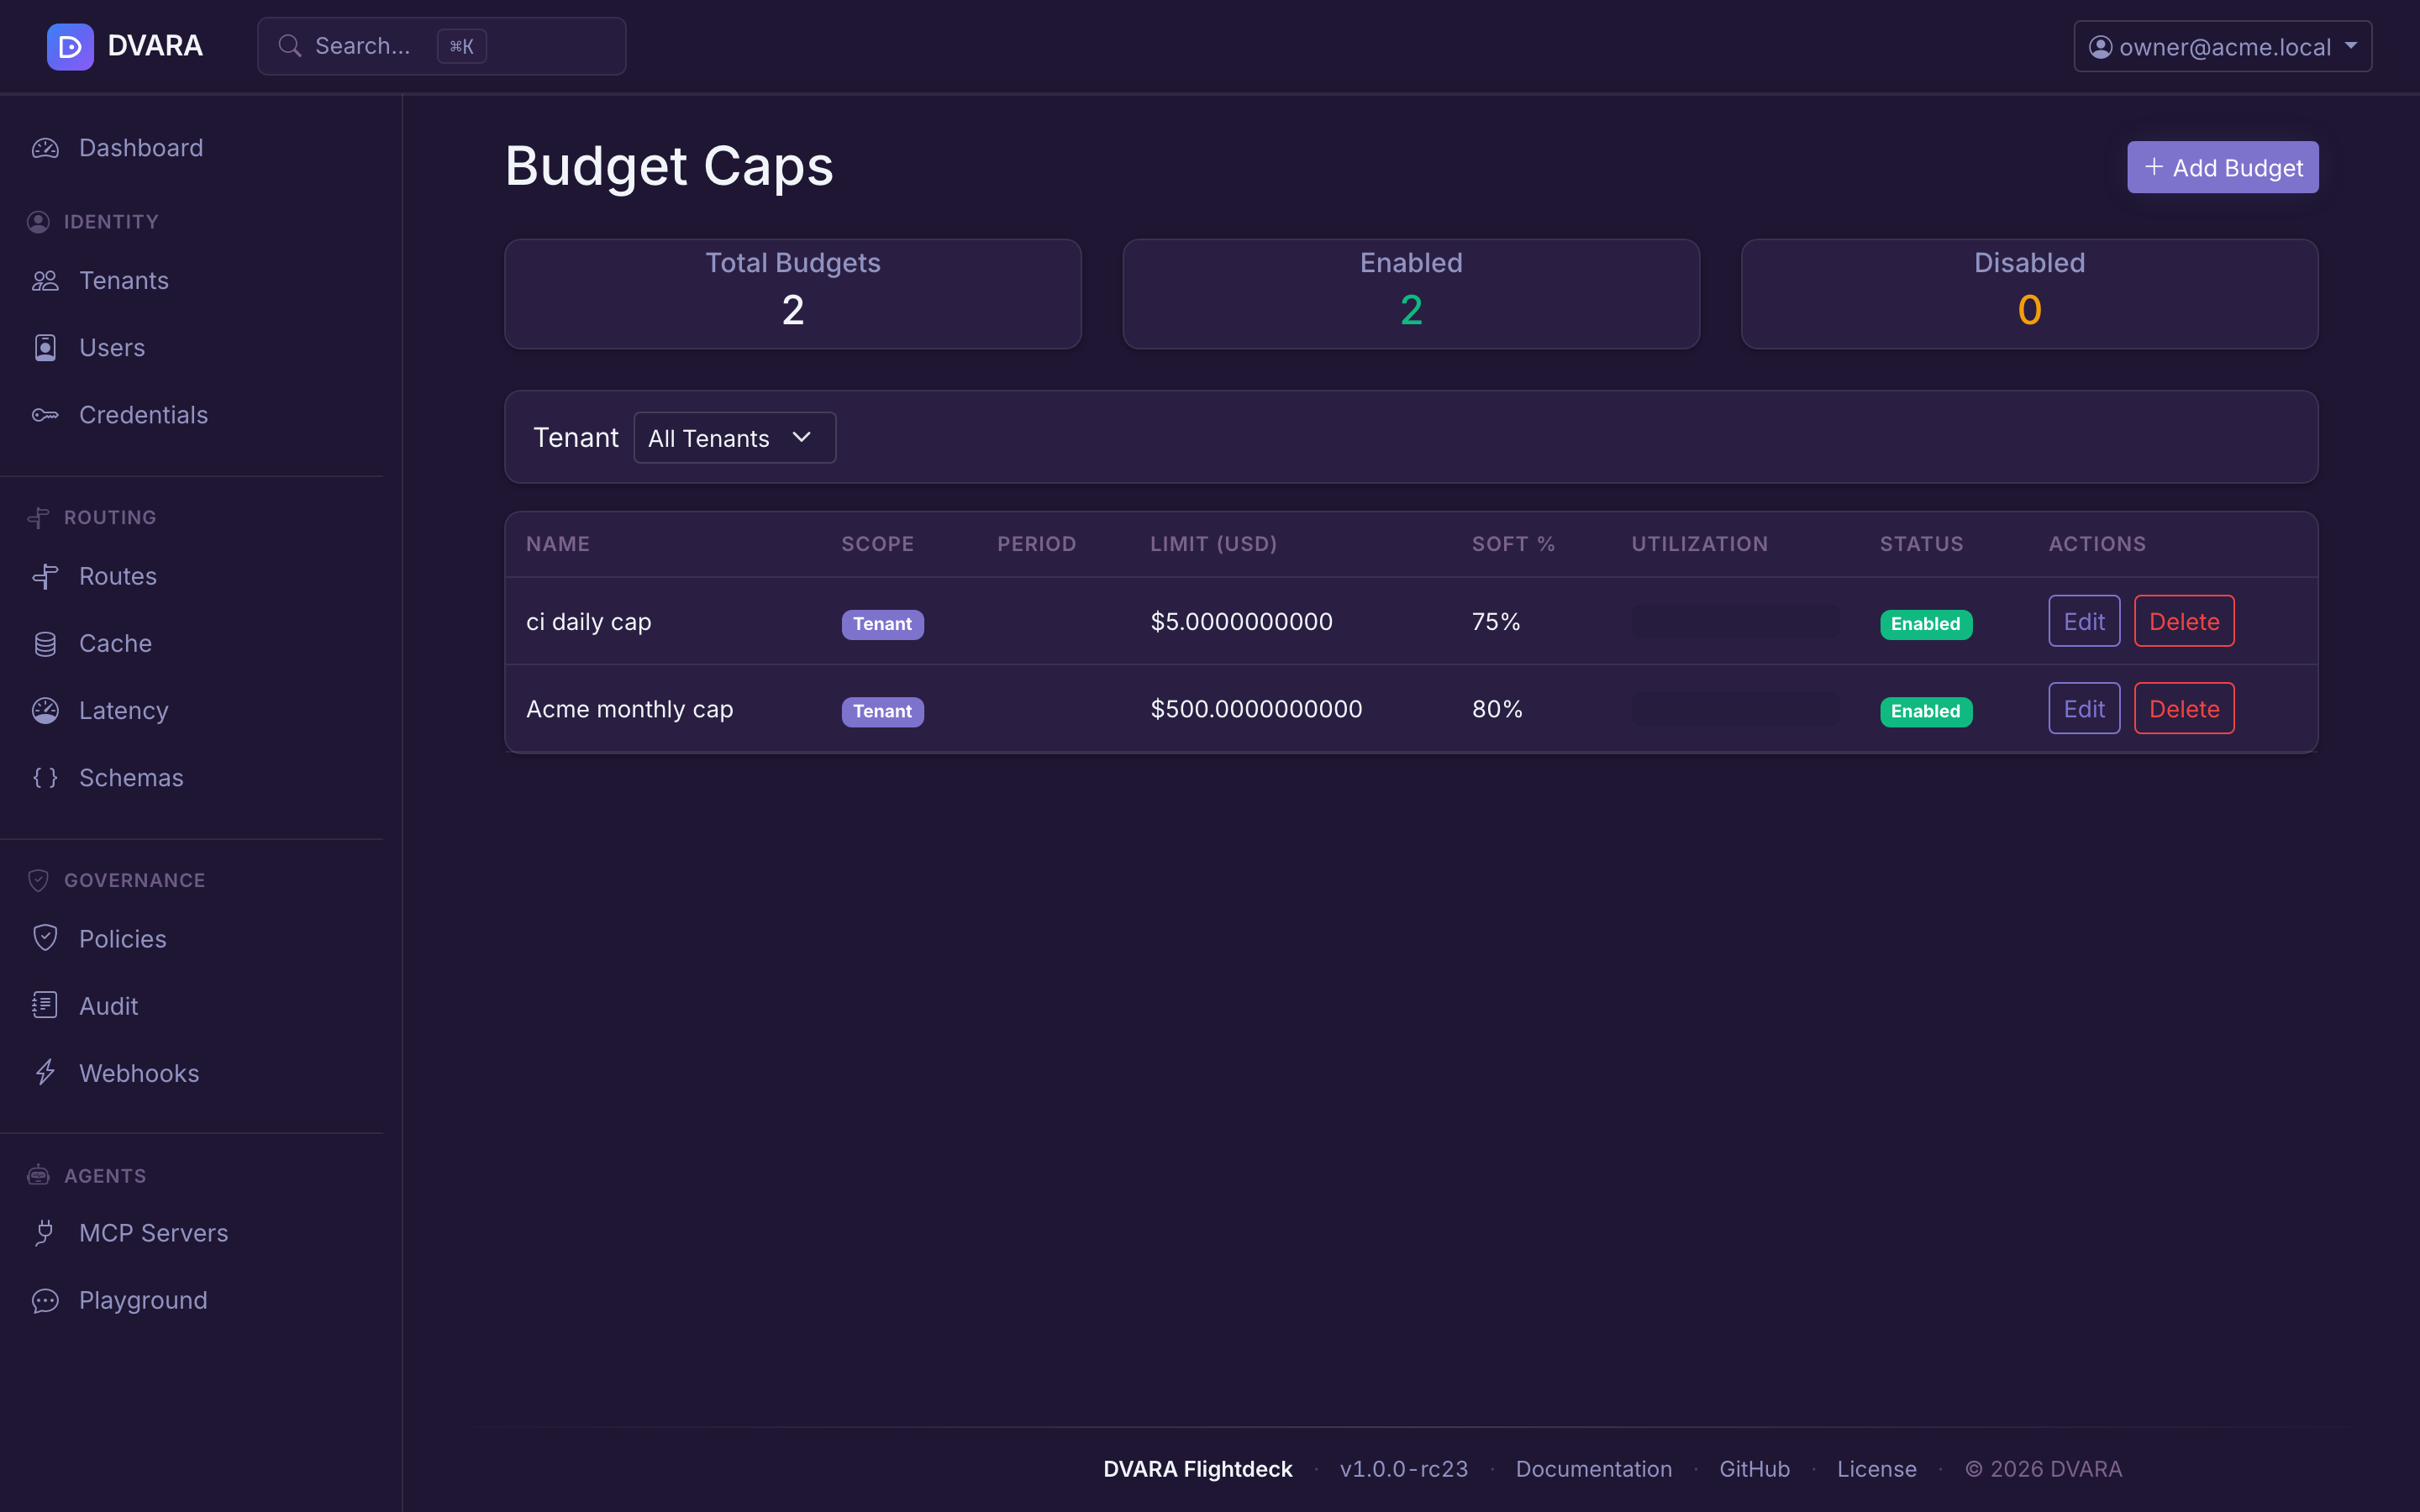
Budget list
Lists every budget cap with name, workspace, API key, period (DAILY / WEEKLY / MONTHLY), limit (USD), soft limit percentage, enabled status, and version. Auto-refreshes every 10 seconds. A Summary row at the top shows total budgets, enabled count, and disabled count. Use the Workspace dropdown filter to narrow the list.
Workspaces can create their own caps from the Budgets page. These are stored with managedBy=TENANT and must sit at or below the effective platform ceiling: the tightest enabled PLATFORM cap that governs them. Flightdeck lists both kinds. Authorized platform operators can edit either provenance; workspace roles see operator-created caps as read-only. Budget evaluation is tightest-wins across every applicable cap.
Create / edit budget
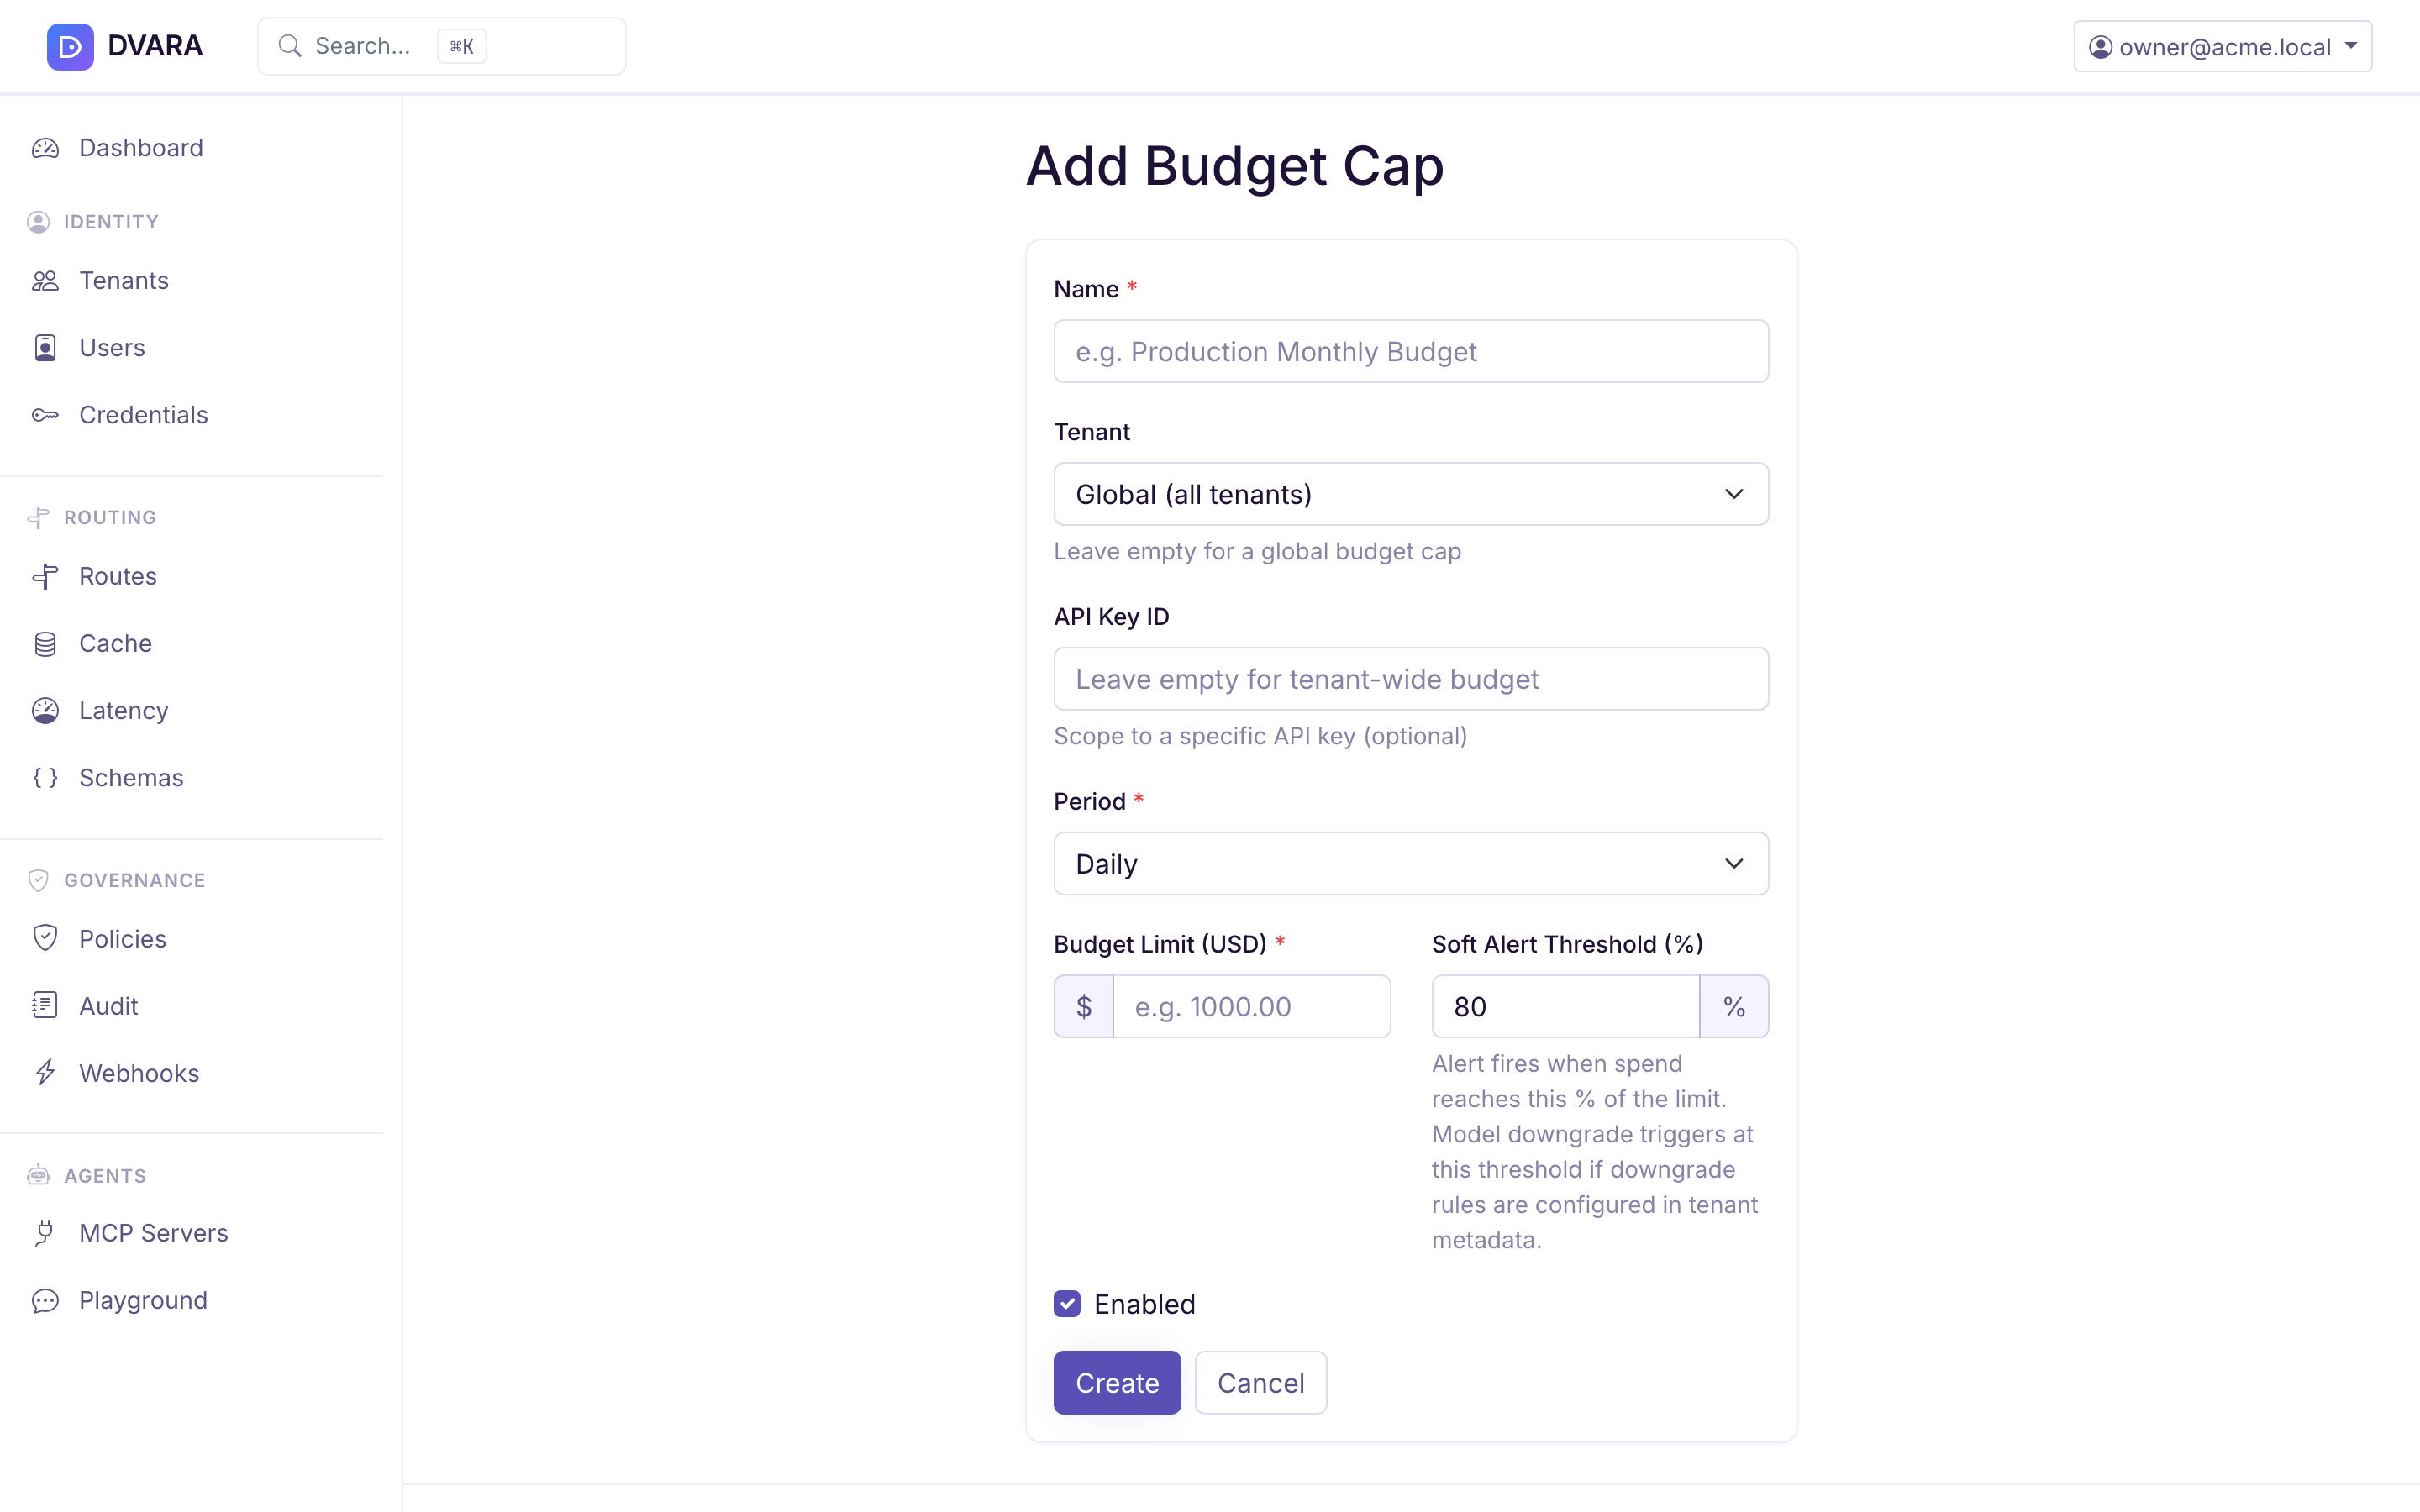
Click New Budget to create a budget cap with:
- Name — descriptive name
- Workspace ID — scope to a workspace (blank = global: a fleet-wide cap on total spend across all workspaces, evaluated on every request)
- API Key ID — scope to a specific API key (blank = workspace-wide)
- Period — DAILY, WEEKLY, or MONTHLY
- Limit (USD) — hard spending limit
- Soft Limit % — percentage of limit at which soft alerts trigger (default: 80%)
Creating or deleting a cap requires approval from a different budget manager. Approval is also required when you change the period, hard limit, or enabled state. A name or soft-limit-only edit is not treated as a material change.
For a protected change, submit the values and a reason, then ask the second manager to review them under Governance → Approvals. After approval, return to the budget action and execute those exact values before the 15-minute window expires. If the cap or submitted values changed in the meantime, Flightdeck refuses the approval and asks you to start again.
All applicable budgets are evaluated on each request and the tightest limit wins — a global cap, the workspace's cap, and an API-key cap can all apply at once, and the first to breach blocks (hard limit) or alerts (soft limit).
Enter the opaque api_key_id from that key's API_KEY_CREATED audit event,
not the plaintext gw_... credential or its public prefix. The current budget
form does not resolve a key name or prefix for you. A per-key cap and that key's
usage records use the same ID, so spend is charged to the cap without storing
the secret.
Per-call cost ceiling
Budget caps limit accumulated spend over a period. A separate, optional per-call ceiling limits the estimated cost of any single request — useful when you want a hard stop on one runaway call regardless of how much budget remains. It is off by default and set in configuration, not Flightdeck:
# application.yml
dvara:
  llm-gateway:
    finops:
      per-call-max-cost-usd: 0.50   # reject any single request estimated above $0.50
A request whose estimated cost exceeds the ceiling is rejected before it reaches the provider with 402 Payment Required (PER_CALL_COST_EXCEEDED) and an audit event. The estimate is max_tokens × the model's output price, so the gate reflects the worst-case output cost the client declared — it applies only when the request sets max_tokens and the model has a pricing row; otherwise the call can't be priced and passes through. Override the ceiling for one workspace with cost.per-call-max-usd in the workspace's metadata — a positive value there enables the gate for that workspace even when the global ceiling is 0. This complements, and runs alongside, the accumulated-spend budget caps above.
Check a budget before sending a model request
Use POST /v1/budget/estimate when an application needs to warn a user before
it sends a potentially expensive model request. The endpoint reads the current
budget for the workspace and API key, but it does not call a provider or create
a usage or cost record.
Send only the model and the maximum output tokens. Replace the host and key with values from your Enterprise deployment:
curl -s https://dvara.internal.example.com/v1/budget/estimate \
  -H 'Authorization: Bearer <your-dvara-api-key>' \
  -H 'Content-Type: application/json' \
  -d '{
    "model": "gpt-4o-mini",
    "max_tokens": 500
  }'
A priced request with room under its tightest applicable budget returns:
{
  "estimated_cost_usd": 0.0003,
  "budget_remaining_usd": 42.18,
  "budget_remaining_tokens": 112480000,
  "budget_remaining_pct": 84,
  "would_exceed_budget": false,
  "pricing_known": true
}
The estimate covers output only: max_tokens multiplied by the model's
configured output price. It does not inspect a prompt or predict input tokens.
budget_remaining_tokens is a separate approximation based on the average of
the configured input and output prices.
Treat pricing_known as part of the decision. When it is false, no exact or
glob price matched the model and estimated_cost_usd: 0.0 does not mean the
request is free. Add a pricing entry before relying on the estimate. If the
current hard cap is already exhausted, would_exceed_budget remains true
even when pricing is unknown.
When no budget applies, the three budget_remaining_* values are null and
would_exceed_budget is false. An omitted, zero, or negative max_tokens also
produces a zero estimate, so send the same positive limit your model request
will use.
A scoped key needs completions:write; an unscoped key is unrestricted. The
endpoint returns the current decision rather than reserving funds. Spend can
change between this check and the model call, so the actual request still runs
the normal budget enforcement.
The per-workspace override is cached in the gate, so a ceiling you have just set keeps serving 200 for around a minute before it starts rejecting. Measured on 1.7.0: a $0.0001 ceiling on a request estimated at $1.00 served normally at first and returned 402 on a later attempt with nothing else changed.
The failure mode is the misleading direction — you set a ceiling, send the request that should breach it, get 200, and conclude the feature is broken. Wait a minute and retry before diagnosing anything. Same shape as the poll delay on policy activation.
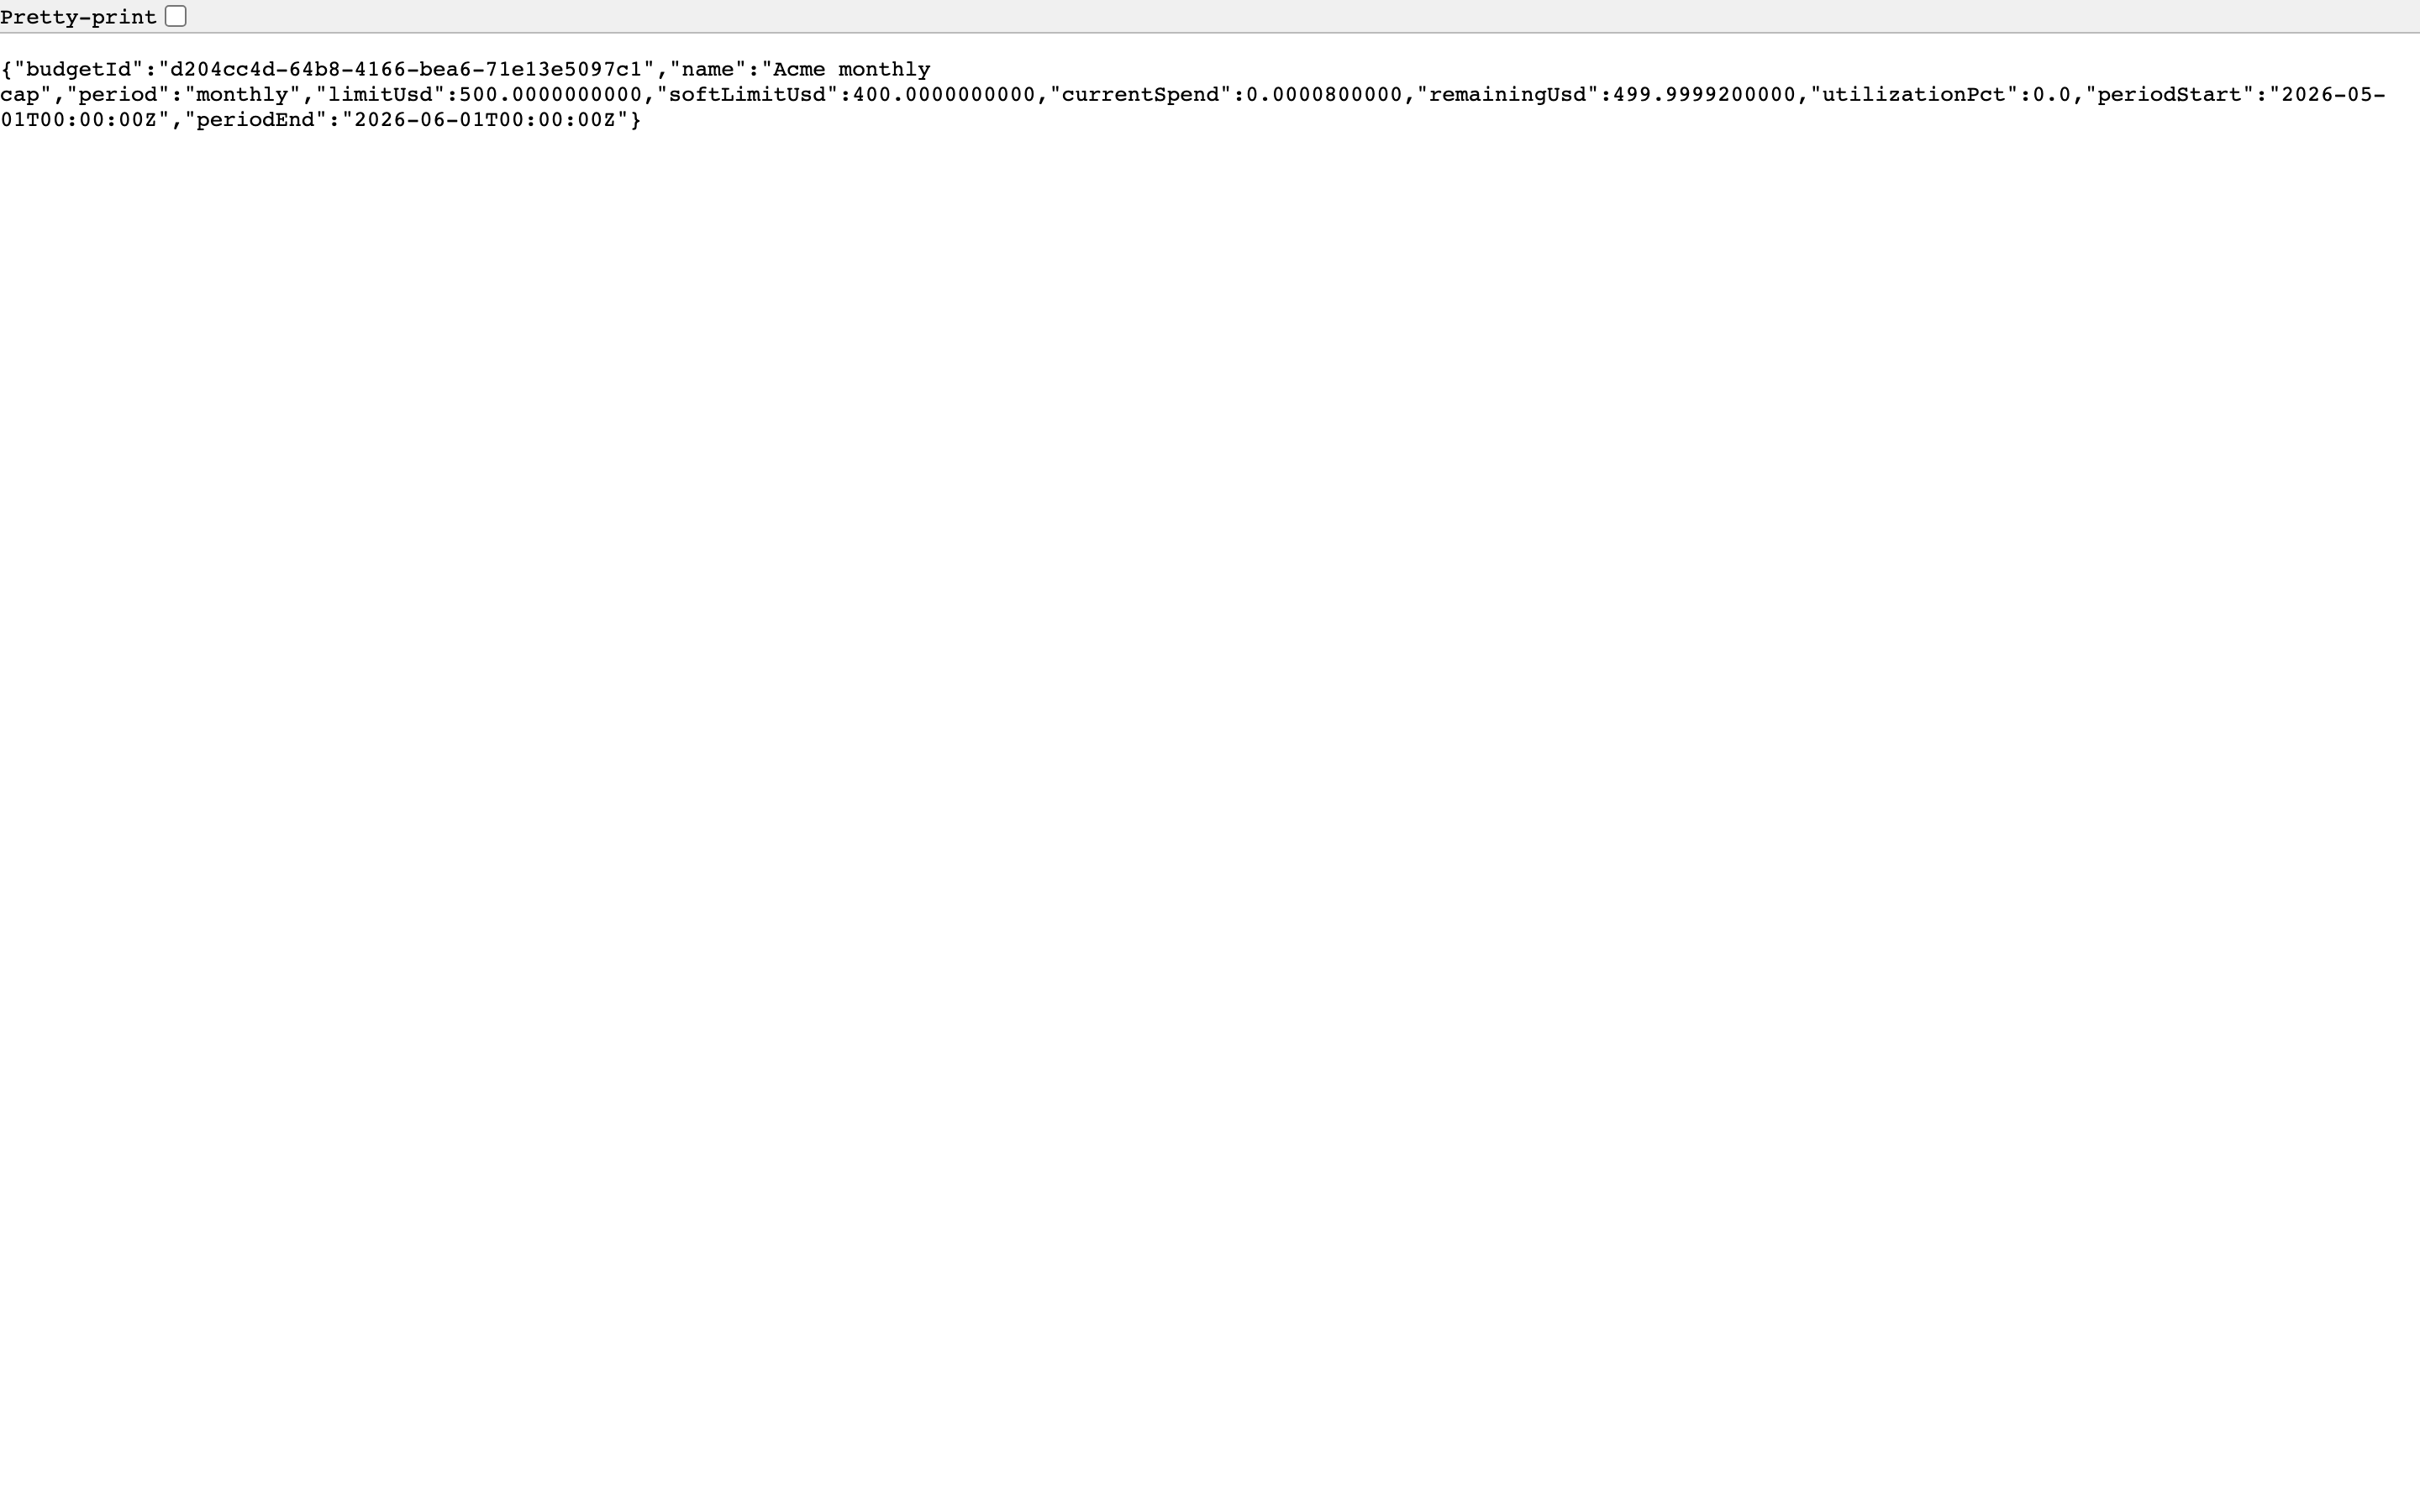
Budget status
Click the status icon on any budget row to view current period usage:
- Current Spend — amount spent in the current period
- Limit — configured limit
- Period Start / End — boundaries of the current budget period
- Utilization % — spend / limit percentage with a color-coded progress bar
- Remaining — dollars remaining before the hard limit
Click Delete to remove a budget cap. Requires confirmation.
Which calls get a cost record
A cost record is written when the provider reported usage and a matching price row exists. Per path:
| path | usage row | cost record |
|---|---|---|
| ordinary call | yes | yes |
| streaming | yes — exact where the provider returns a usage block, otherwise estimated | yes |
| cache hit | yes, marked HIT | no — no upstream call was made, so it books $0 |
| blocked before dispatch (policy, guardrail, budget, per-call ceiling) | no | no |
| failed call — no usage returned | no | no |
| model with no price row | yes | no |
Served volume and upstream cost are therefore deliberately different numbers. A cache hit counts toward what you served and toward nothing you were charged; the monthly usage report splits them for exactly that reason.
Retries and provider fallback are not separate rows: a request produces at most one usage row and one cost record, attributed to the provider that actually answered.
Chargeback reports
Open Cost → Chargeback Reports in the sidebar.
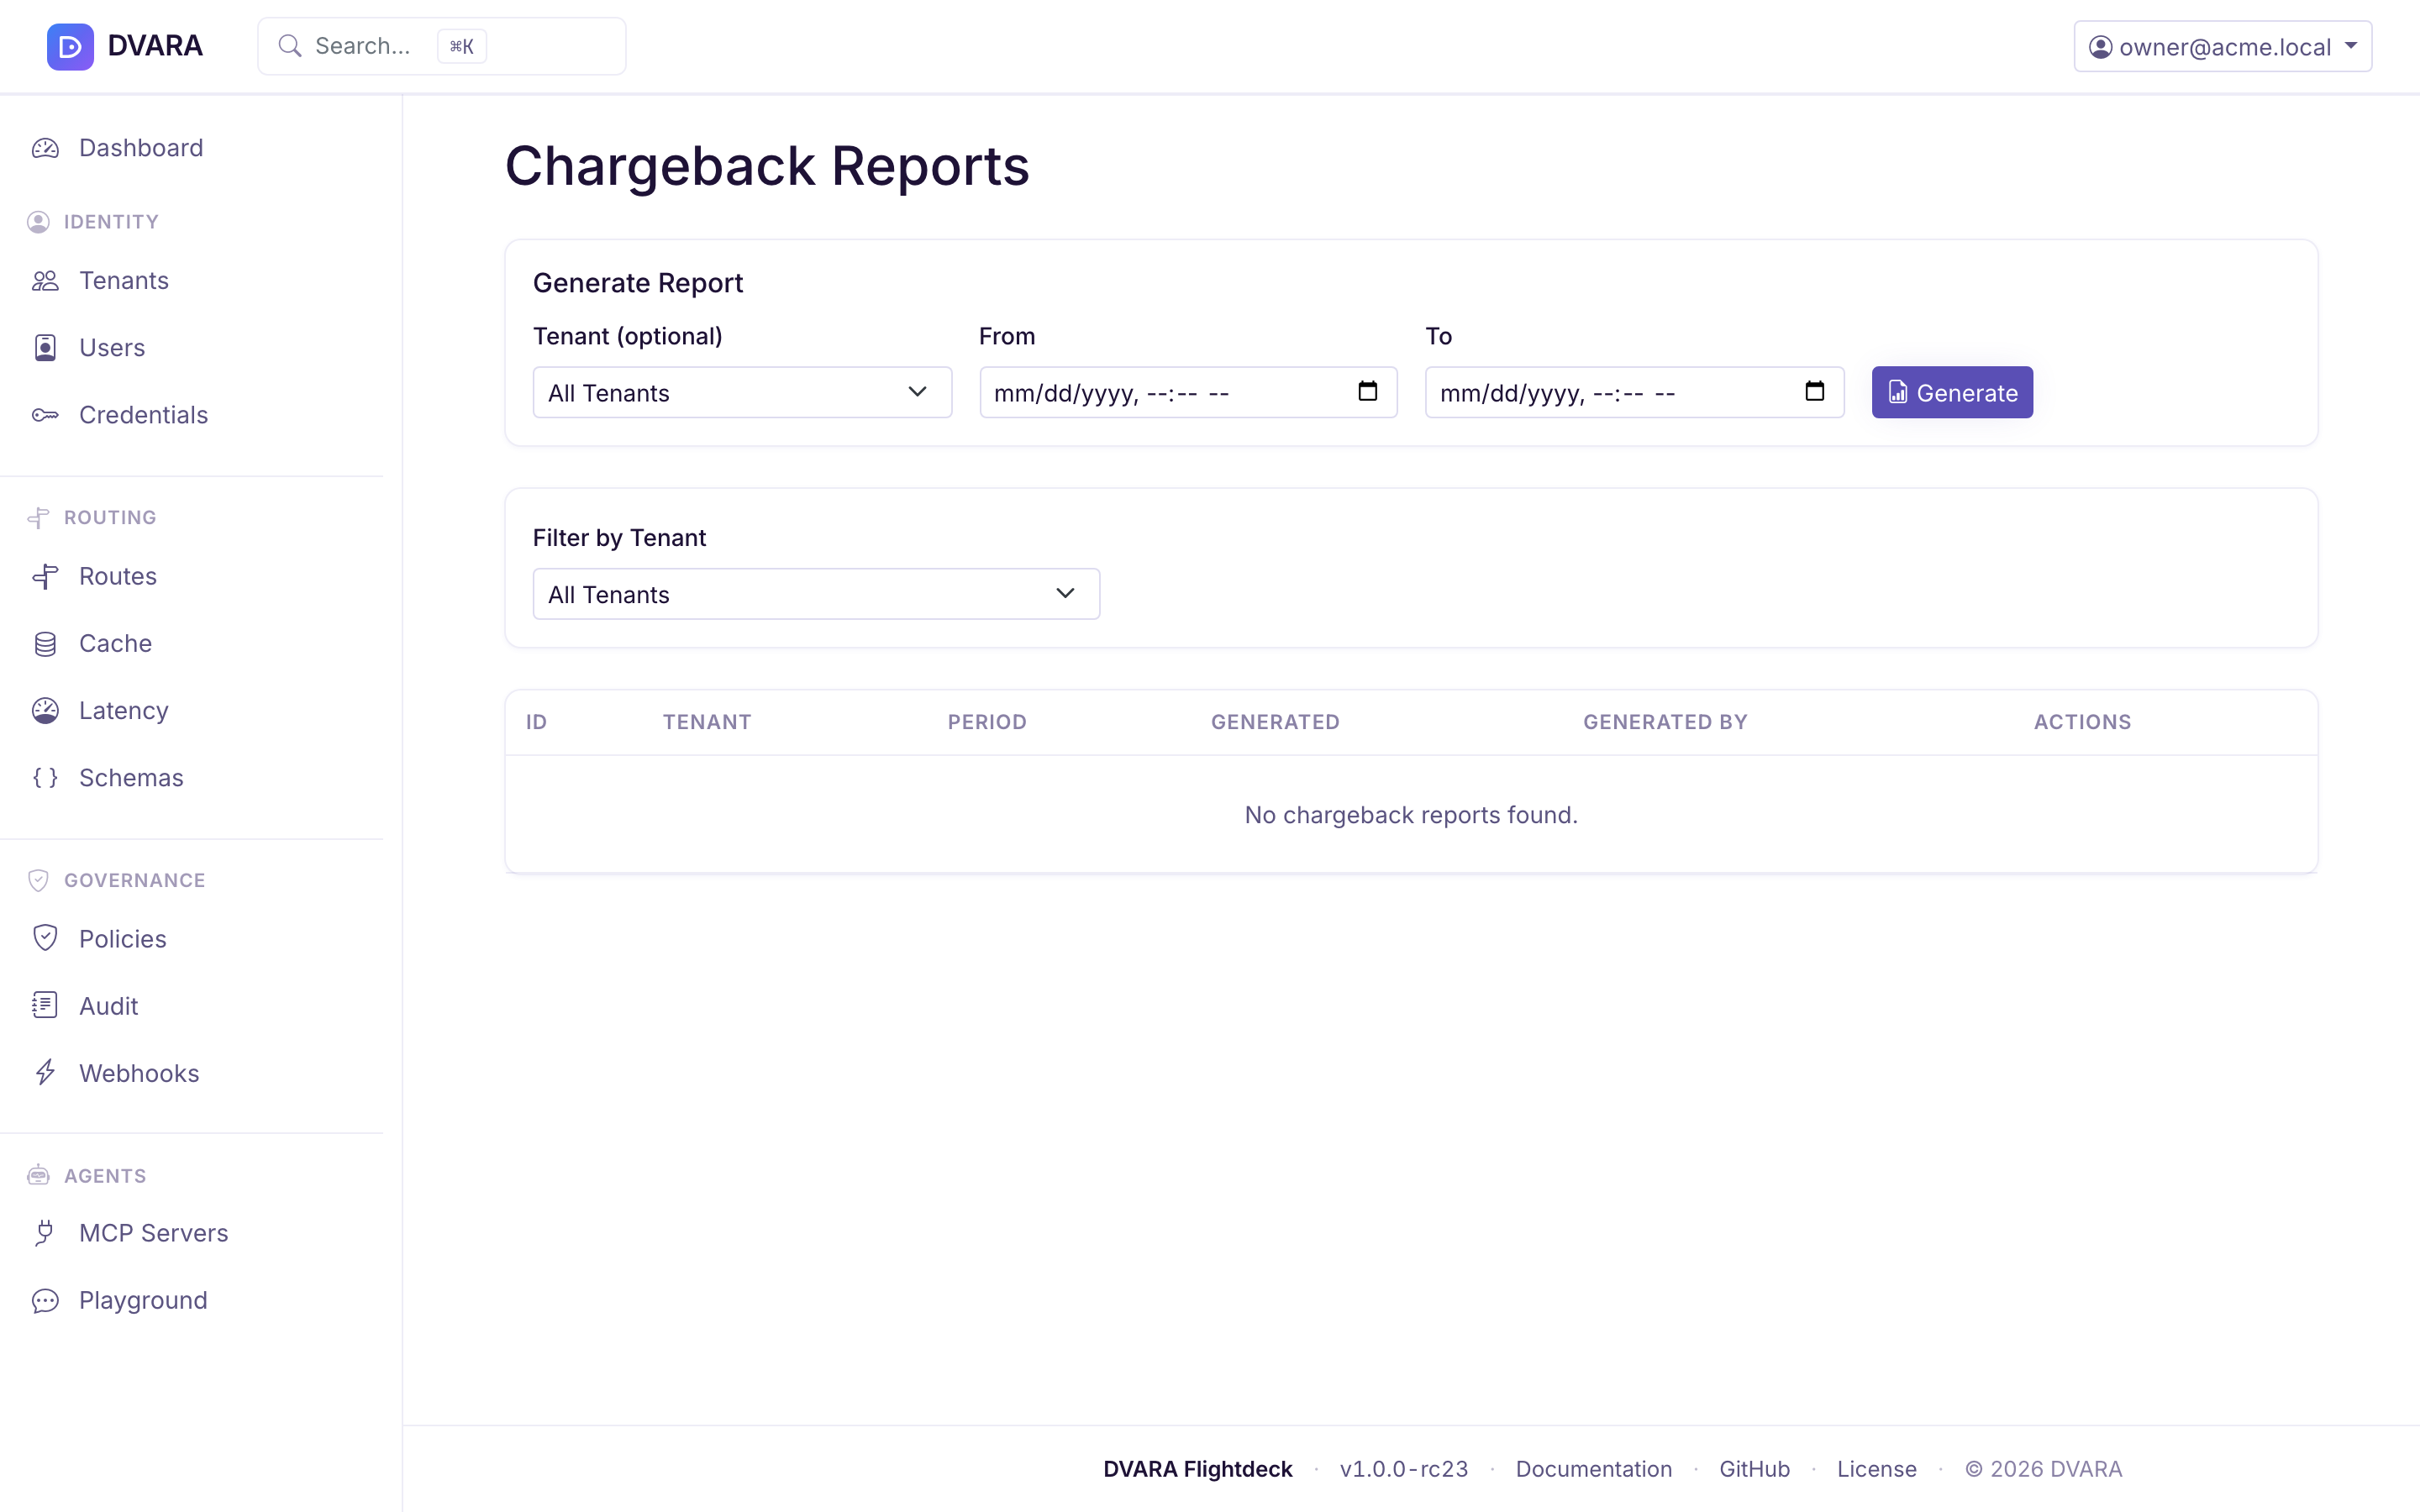
Report list
Lists every generated chargeback report with ID, workspace, period (from–to), generated date, and generated by. Auto-refreshes every 10 seconds.
Generate report
Click Generate to create a new chargeback report:
- Workspace ID — scope to a specific workspace (blank = all workspaces)
- From / To — reporting period date range
The report includes seven sections: workspace summary, API key summary, model summary, provider summary, daily breakdown, forecasts, and anomalies.
From 1.8.5 the model summary, and its CSV, add input, output, cached-input, cache-write and reasoning tokens as trailing columns, so a reader keyed on column position keeps working.
Download
- PDF — click the PDF icon to download a formatted PDF report
- CSV — click the CSV icon to download raw data as CSV

Click Delete to remove a report. Requires confirmation.
Each report row shows its generation state, creation time, expiry time, and
workspace scope. A generated artifact remains downloadable for 30 days. After
that, PDF or CSV download returns 410 Gone; generate a new report for the
same dates instead of reusing the expired ID. Download filenames contain safe
report, workspace, date, and extension parts.
Compliance reports
Open Cost → Compliance Reports in the sidebar.
Report list
Lists every compliance report with ID, type (SOC2 / HIPAA / GDPR / RBI / SEBI), workspace, period, generated date, and actions. Auto-refreshes every 10 seconds. Use the Type and Workspace dropdown filters to narrow the list.
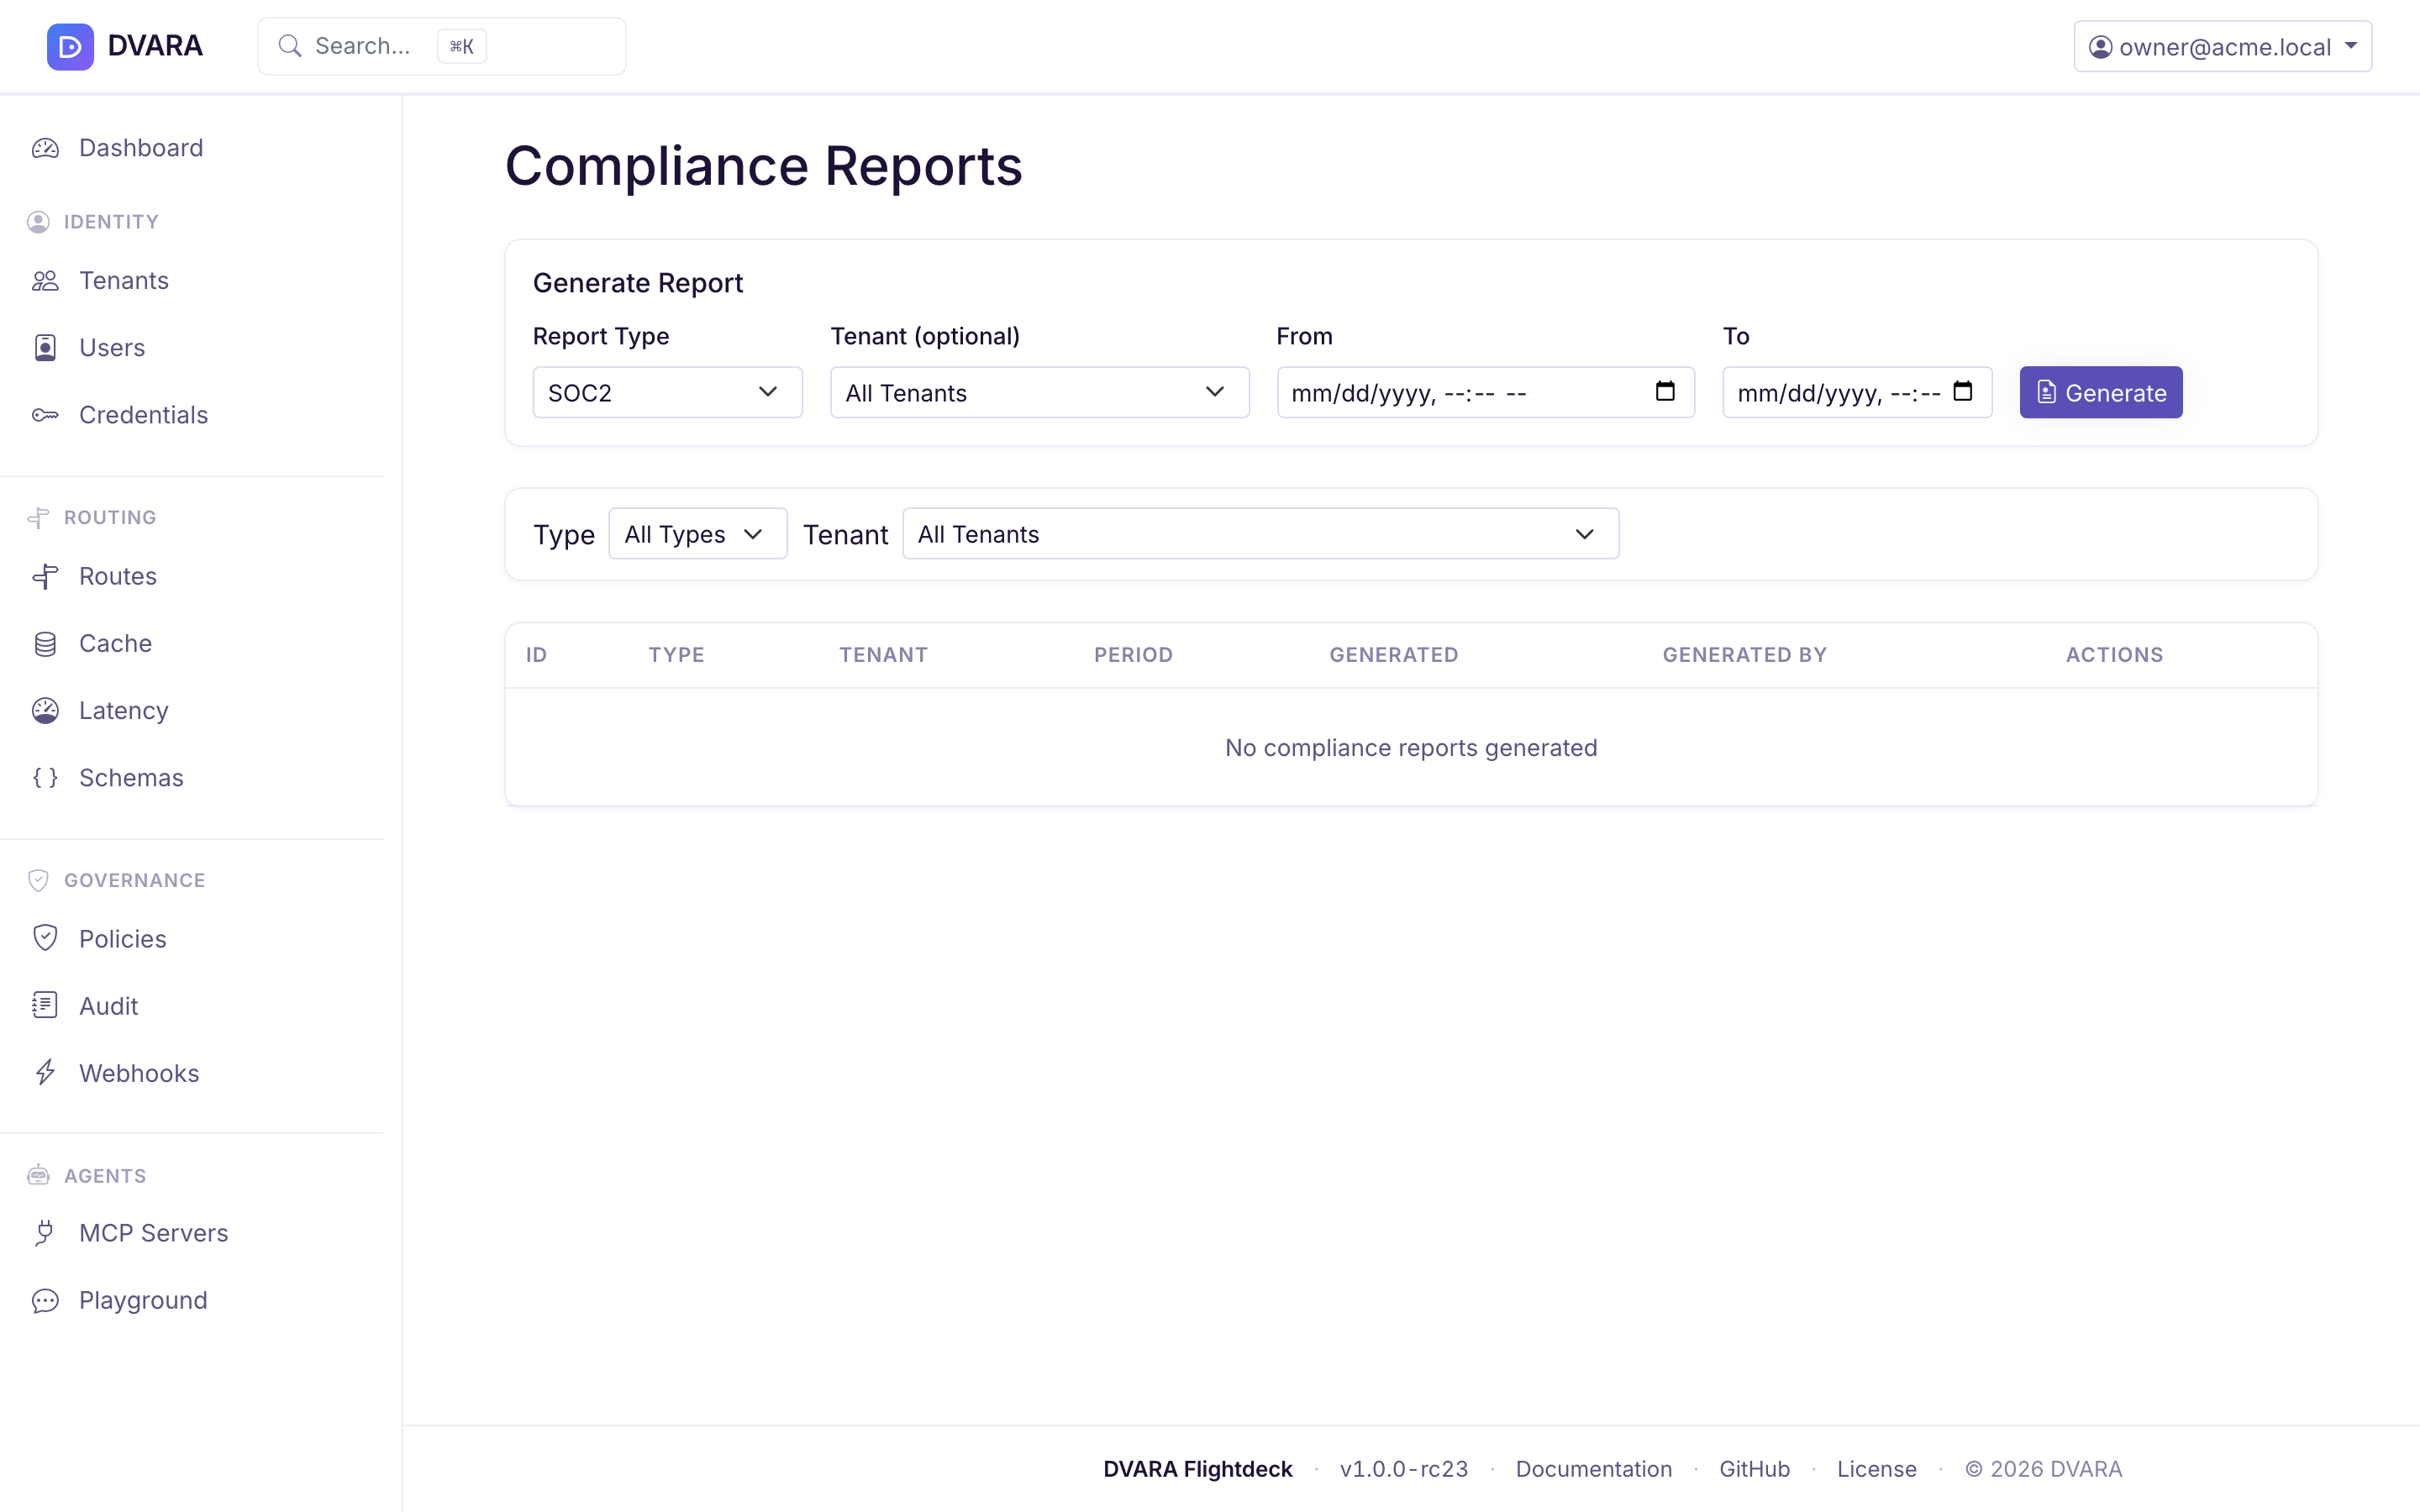
Generate report
Click Generate to create a new compliance report:
- Type — SOC2 Type II, HIPAA, GDPR, or India RBI / SEBI
- Workspace ID — scope to a specific workspace (blank = all workspaces)
- From / To — reporting period date range
Report contents by type:
| SOC2 | HIPAA | GDPR |
|---|---|---|
| Audit chain integrity | Access log | Data processing activities |
| Access control summary | Authorization log | Workspace data residency |
| Policy enforcement summary | Policy violations | Consent and policy status |
| Data residency | Data access patterns | Data retention |
| Token usage summary | Audit integrity | Audit integrity |
| Event count by type |
The India RBI and SEBI reports share a common section set — data localization (residency), tamper-evident audit-chain integrity, access control, policy enforcement, and token usage — with regulator-specific framing (RBI emphasizes data localization; SEBI emphasizes recordkeeping and audit trail). Scheduled generation is configured via dvara.flightdeck.compliance.rbi-schedule / .sebi-schedule.
Access-control totals include the built-in and SAML LOGIN_SUCCESS /
LOGIN_FAILED events and the SSO AUTHENTICATION_SUCCESS /
AUTHENTICATION_FAILURE pair. The report identifies the event source it counted.
When you select a workspace, every event total is limited to that workspace;
the GDPR total is not a platform-wide number.

Click the PDF icon to download the compliance report as a formatted PDF. Click Delete to remove a report (requires confirmation).
Compliance artifacts follow the same 30-day download window. The list marks a
report Completed while it can be downloaded and Expired after the window.
An expired download returns 410 Gone; generate the report again for the
original evidence window. Report IDs remain workspace-scoped, and filenames
use safe type, workspace, and date parts.