Dashboard
Not included in DVARA Open Source.
The landing page at / displays live operational panels that auto-refresh without a page reload. The live-metrics and provider-health panels poll every 3 seconds; the latency and semantic-cache panels poll every 5 seconds. Data is powered by the LLM Gateway's Prometheus scrape endpoint at /actuator/prometheus (the DVARA Flightdeck authenticates with DVARA_ACTUATOR_METRICS_API_KEY automatically) and by in-process state (latency tracker, response cache).
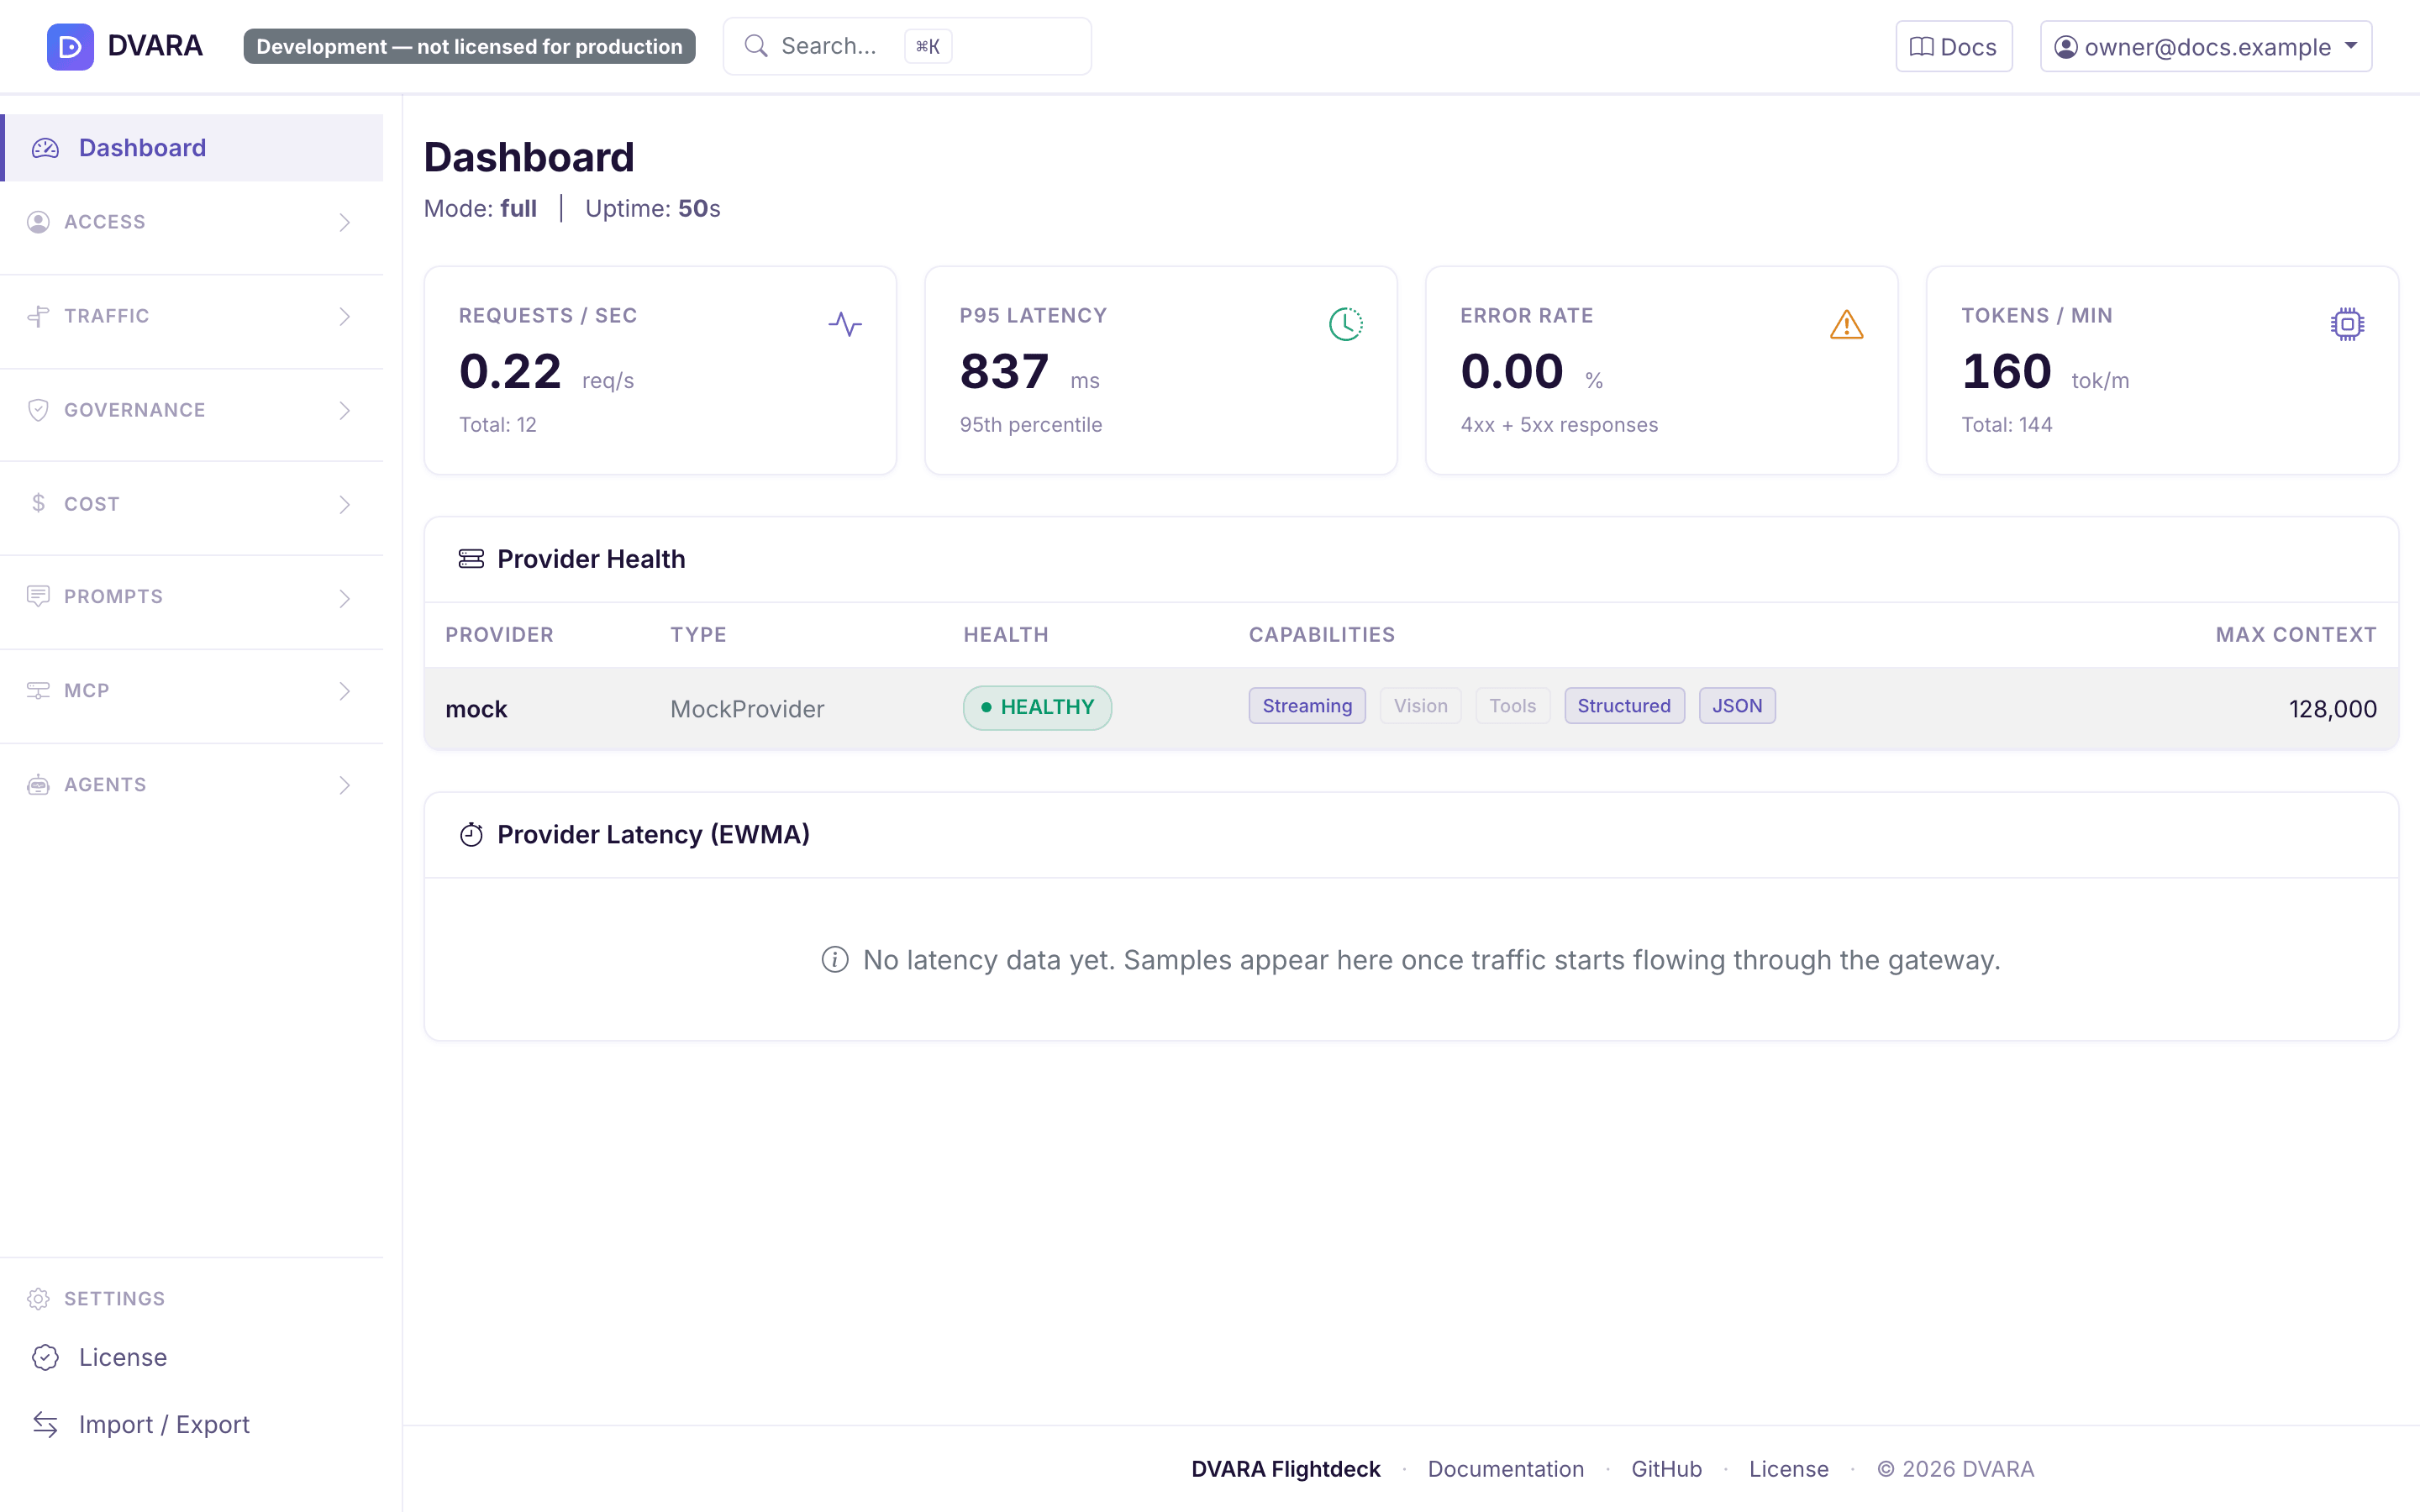
Live metrics
Four metric cards at the top of the page:
- Requests/sec — average request throughput since startup
- P95 Latency — 95th percentile response time (milliseconds)
- Error Rate — percentage of 4xx/5xx responses
- Tokens/min — average token throughput
Metrics are derived from counters and histograms exposed by the LLM Gateway. If the connection indicator at the top-right is red (LLM Gateway unreachable), these cards show stale or zero values but the DVARA Flightdeck continues to function.

Provider health
A table showing every registered LLM provider with:
- Provider name and type
- Health status (HEALTHY / DEGRADED / UNHEALTHY) with color-coded badges
- Capability pills: Streaming, Vision, Tools, Structured, JSON
- Maximum context token window
Use this panel to quickly spot provider outages, rate-limit throttling, or capability mismatches before they start failing end-user requests.

Provider latency (EWMA)
A table showing every tracked provider + model pair with its current EWMA latency, color-coded against fixed thresholds, and sorted slowest-first so outliers surface at the top:
- Provider + model pair
- Current EWMA as a health-badge: green under 1 second, amber 1–5 seconds, red above 5 seconds
- Sample count so you can tell whether the EWMA is built from enough data to trust
This is the same data the latency-aware routing strategy reads — seeing it on the Dashboard lets operators validate the numbers the router is making decisions against without running a Prometheus query. The tile polls every 5 seconds and shows an empty-state message until the first samples arrive.
Semantic cache
Four metric cards plus a Clear cache button. Only one of the four carries a number: cache size and the clear action work on the shared store and are accurate here, while hit rate, average similarity and total lookups read "— not measurable from Flightdeck" — they are counted inside each gateway process, and the card points at /actuator/prometheus on the data plane for them. Before 1.7.0 this card showed a hit rate that was structurally 0%. The cache is a fleet-wide resource, so the clear button carries a confirmation dialog — any in-flight request that would have hit the cache will run against the upstream provider instead.
Tile visibility is gated on dvara.llm-gateway.cache.enabled. When the feature is disabled, neither the tile nor its 5-second poll fires — no wasted network round trips and no stale-looking panel on a deployment where caching is off.
The Cost Dashboard is the better place to see the dollar impact of cache hits; this tile is the operational view of cache size. Use Traffic → Semantic Cache for a controlled clear. Choose the whole fleet or one workspace, review the estimated number of affected entries, and type the phrase Flightdeck shows before confirming. Configurations are not deleted. Requests already past lookup continue; the next matching request repopulates an entry.
Priority admission
When dvara.llm-gateway.routing.priority.enabled=true, a priority admission card appears on the dashboard showing concurrent load (now / max), the current load percentage, and a per-tier table (premium / standard / bulk) with each tier's throttle threshold and a live admitting-vs-throttling badge. The card polls every 5 seconds. When priority is disabled (the default), the card is hidden — no wasted poll, no empty panel.
For historical trends, alerting, and per-workspace cardinality, the same data is exported to Prometheus as gateway_priority_requests_total and gateway_priority_throttled_total (labelled by workspace and tier). See Routing → SLA-aware priority routing.
What's not on this page
Some observability signals are intentionally Prometheus-only — they're high-cardinality (per-workspace, per-model counters) and belong in the same pane of glass as the rest of your service metrics:
- Per-workspace / per-model latency histograms — the EWMA table above gives a point-in-time summary; the full histogram with percentiles and over-time trending lives in Prometheus as
gateway_latency_seconds. - Per-workspace cost and token throughput — see the Cost Dashboard for the dollar / token rollups, and
gateway_cost_dollars_total/gateway_tokens_totalin Prometheus for the raw counters.
Point Grafana at /actuator/prometheus on the gateway for the full counter and histogram set. If you scrape /actuator/prometheus directly from Prometheus or Grafana Agent, set the scrape's bearer-token to the same DVARA_ACTUATOR_METRICS_API_KEY value — that endpoint is no longer anonymous, and a distinct secret from DVARA_ACTUATOR_API_KEY so a leaked scrape token can't unlock the license envelope. A worked Prometheus scrape config is not included here.