Sign in to your workspace
Every governance action in DVARA Cloud — every policy you draft, every credential you rotate, every PII setting you change — runs under the identity you sign in with, and lands in the immutable audit trail with your email on it. Before you start, sign in, confirm the role you have, and check that your data plane is reachable.
Sign in for the first time after an invitation
The first time you reach your workspace is through an invitation email sent by the platform owner or by another tenant admin on your team. The email contains a one-time link of the form https://flightdeck.<your-host>/register?token=<uuid>.
- Open the link. The token is valid for 7 days from when it was issued.
- Pick a password (your password manager is the right place to store it).
- Submit the form. You're redirected to
/login?registered=true. Sign in with the same email and password. - After sign-in your browser lands on
/portal. That is your workspace home; the platform Console (/) is for the operator who runs DVARA Cloud and is not accessible to you.
If the link is older than 7 days or has already been used, the page shows "this invitation link is invalid or has expired" — there is no self-service resend. Ask the person who invited you to issue a new one.
Sign in if you already have an account
Open https://flightdeck.<your-host>/login, enter your email and password, and submit. Five consecutive failed attempts lock the account for 15 minutes; if you forget your password use the Forgot password? link on the same page and follow the email reset link.
What you see depends on your role
Every user in your workspace carries exactly one of three tenant roles:
| Role | What you can do |
|---|---|
admin | Everything in the portal, including inviting and removing teammates, changing PII and guardrail posture, and (on DVARA Cloud) changing the plan or closing the account |
developer | Create and rotate API keys, write and promote policies and prompts, configure webhooks and MCP servers, run reports — but cannot remove teammates or change PII/guardrail posture |
viewer | Read-only across the workspace — useful for auditors and observers |
A user who carries a platform role (owner, policy-admin, billing-admin) on the same install is the operator of DVARA Cloud, not a tenant user, and signs in to a different surface. Your workspace will never show platform roles in the team list.
Verify the gateway is connected before you act
Open the user menu in the top-right corner. A small dot next to the gateway URL tells you whether the data plane is reachable from Flight Deck:
- Green dot — the data plane is healthy. Token usage, cost, and live MCP activity refresh on every page load.
- Red dot — the portal cannot reach the data plane right now.
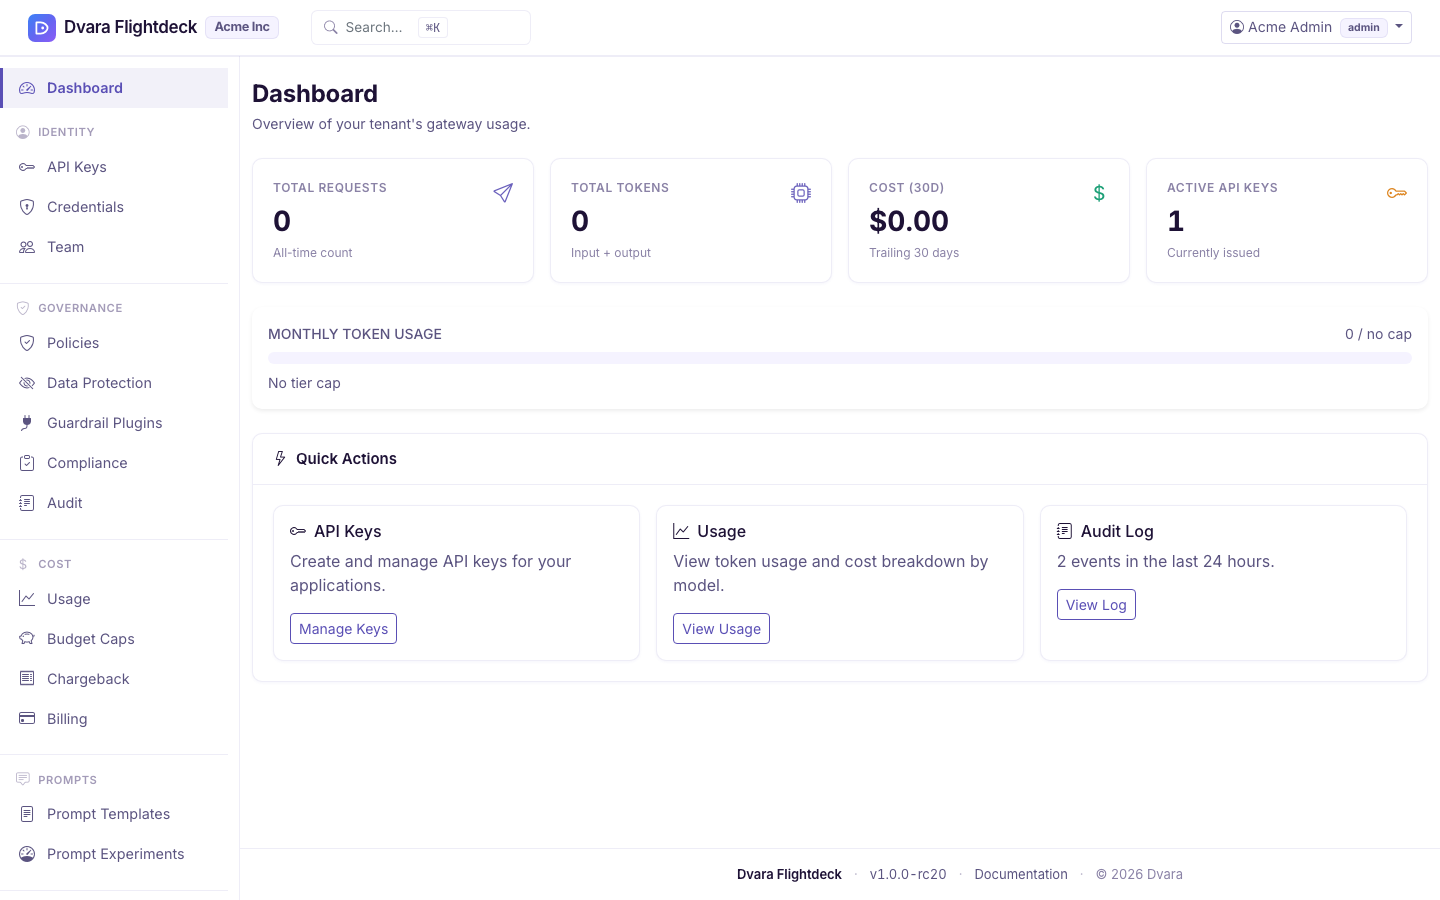
Figure 1. The portal dashboard on a fresh workspace. Open the user menu to see the gateway-connected indicator before you act.
What still works when the indicator is red
The portal stores configuration in its own database, separate from the data plane. So even with a red dot:
- API keys, provider credentials, budgets, policies, webhooks, MCP server registrations, prompt templates, the team list, and the audit log itself all still load and accept changes. Every audit event still lands in the immutable trail.
- Token usage, cost figures, and MCP activity will not refresh — those numbers are produced when the data plane processes calls, so they stall at the last value the data plane delivered.
- New
/v1/*requests from your applications will fail until the data plane comes back. The indicator turning green again is the signal to redrive any traffic you held.
What to do when the indicator stays red
A red dot that persists for more than a few seconds is unusual. The most common causes:
- The platform operator is rolling out a release — wait a minute and reload. Most rollouts complete inside one indicator cycle.
- The data plane URL the portal is configured against is wrong for your install. Check with the operator who set up DVARA Cloud for your organisation; the URL is shown next to the indicator and should match the gateway you point your SDKs at.
- Your network is blocking outbound HTTPS to the gateway from the portal. This is rare on DVARA Cloud (we operate both sides), but is the usual cause on self-managed installs.
What happens behind the scenes
A successful sign-in writes one LOGIN_SUCCESS audit event (with email and source: builtin); a failed one writes LOGIN_FAILED (with email and reason). After five consecutive failures the account is locked for 15 minutes — that lock writes one ACCOUNT_LOCKED event with the failed-attempt count and the unlock timestamp. Accepting an invitation does not currently emit a dedicated event — the inviter's USER_INVITED event is the only audit record of the invitation lifecycle.
Next steps
Now that you can reach the portal and you know which role you carry: