DVARA Flightdeck Overview
The DVARA Flightdeck is the control plane for your DVARA AI governance platform. A single DVARA Flightdeck process serves three audiences:
- The platform dashboard — a web console for platform engineers, security admins, compliance officers, and finance teams managing policies, tenants, budgets, and the audit trail.
- The tenant self-service portal — a scoped UI for tenant users to manage their own API keys, BYOK credentials, usage, and team membership.
- The Automation API (
/v1/admin/*) — REST endpoints for CI/CD pipelines, Terraform, and infrastructure-as-code tooling.
All three read and write the same DVARA control plane store. The DVARA Flightdeck is the only component that writes governance configuration — the LLM Gateway and the MCP Proxy read from it.
Navigation
DVARA Flightdeck uses a slim top bar over a vertical left sidebar. The top bar carries the brand, a Cmd+K command-palette trigger, and the user-menu dropdown; everything else lives in the sidebar, grouped into six sections plus a top-level Dashboard. Role-aware visibility hides items the caller can't reach — Cache is owner-only; Users, Latency, and Schemas need owner or policy-admin.
Top bar
├── Brand (DVARA logo + "DVARA Flightdeck" + version badge)
├── Cmd+K command palette — ⌘K / Ctrl+K to open from anywhere
└── User menu (dropdown)
├── Connection status — green dot = LLM Gateway reachable, red = disconnected
├── Theme toggle — day / night mode, persisted per user
├── My Access Tokens (/settings/tokens) — personal access tokens for Automation API
├── License (/license) — license status + renewal
├── Import / Export (/config) — GitOps snapshot + replay (owner only)
└── Sign out
Sidebar
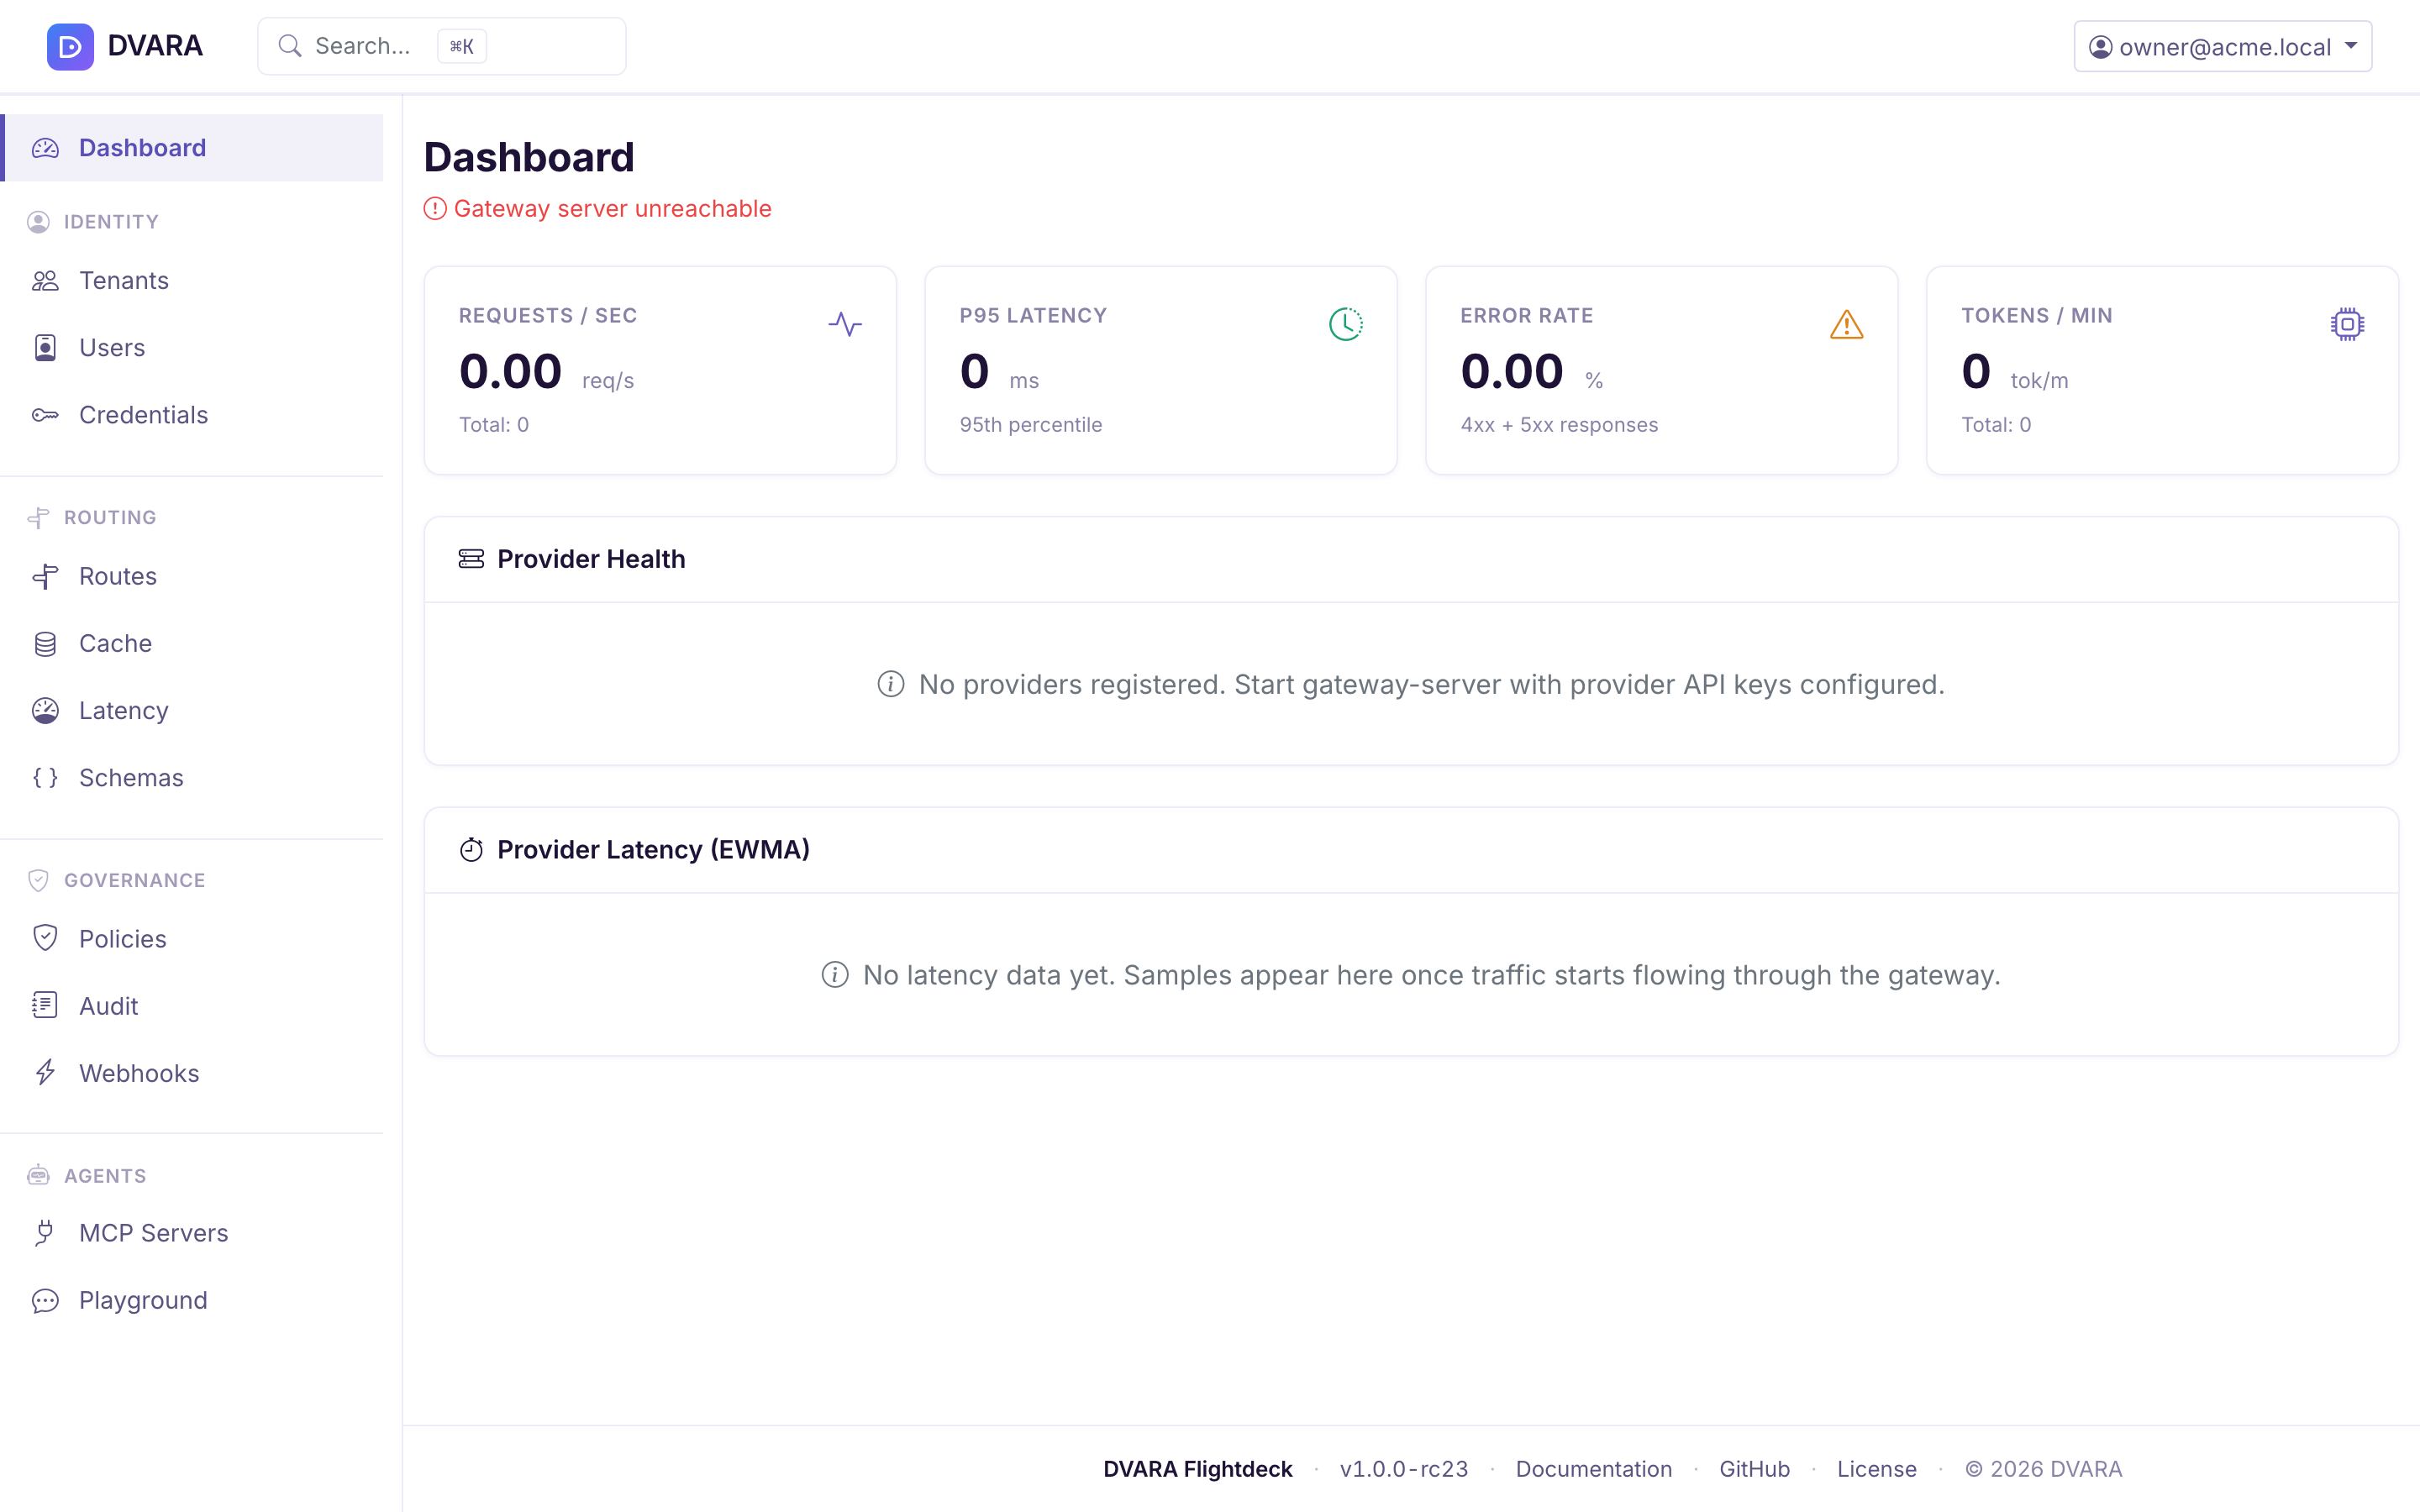
├── Dashboard (/) — live metrics, provider health, latency, cache
│
├── Identity
│ ├── Tenants (/tenants) — tenant + API key management
│ ├── Users (/users) — user + role management (owner + policy-admin)
│ └── Credentials (/credentials) — provider credential management
│
├── Routing
│ ├── Routes (/routes) — routing rules + version history + canary
│ ├── Cache (/cache) — semantic cache stats + configs (owner only)
│ ├── Latency (/latency) — EWMA latency dashboard (owner + policy-admin)
│ └── Schemas (/schemas) — output schema registry (owner + policy-admin)
│
├── Governance
│ ├── Policies (/policies) — policy DSL editor + shadow testing
│ ├── Audit (/audit) — live audit event stream
│ └── Webhooks (/webhooks) — webhook delivery management
│
├── Cost [ENT]
│ ├── Cost Dashboard (/costs) — cost records + charts + forecasts
│ ├── Token Usage (/token-usage) — per-tenant token telemetry
│ ├── Model Pricing (/pricing) — per-model pricing config
│ ├── Budget Caps (/budgets) — spending limits + alerts
│ ├── Chargeback Reports (/chargeback) — chargeback reports (PDF / CSV)
│ └── Compliance Reports (/compliance) — SOC2 / HIPAA / GDPR reports
│
├── Prompts [ENT]
│ ├── Templates (/prompts) — prompt template management
│ ├── Experiments (/prompts/experiments) — A/B prompt experiments
│ ├── Golden Prompts (/golden-prompts) — golden prompt fingerprinting
│ ├── Eval Prompts (/eval/prompts) — eval prompt management
│ └── Eval Reports (/eval/reports) — eval report viewer
│
├── Agents
│ ├── MCP Servers (/mcp/servers) — MCP server registry
│ ├── Tool Calls (/mcp/tool-calls) — tool call history
│ ├── Sessions (/mcp/sessions) — agent session management
│ ├── Approval Queue (/approvals) — human-in-the-loop approvals (red badge shows pending count)
│ └── Analytics (/analytics) — agent behavior analytics
│
└── Playground (/playground) — interactive prompt and model testing (top-level item, hidden when dvara.flightdeck.playground.enabled=false)
Sidebar responsiveness. At ≥ 1400 px the sidebar stays expanded. Between 992 and 1399 px it collapses to a 56 px icon-only rail that expands on hover or focus. Below 992 px it slides in from the left as a hamburger-toggled drawer.
Items marked [ENT] are the enterprise governance modules — Cost, Prompts, and the agent-governance surfaces. They are present in every DVARA install (DVARA is enterprise-only; there is no community edition). The marker simply groups the advanced governance sections so you can find them at a glance, not a paywall within the product.
Cmd+K command palette. Press ⌘K or Ctrl+K (or click the search pill in the top bar) to jump to any destination by substring match against label or section. Keyboard: ↑ / ↓ to navigate, Enter to open, Esc to close. The palette honors the same role gates as the sidebar — operators can't tab to pages they can't reach.
Connection status. The user-menu shows a green dot when the LLM Gateway is reachable and a red dot when it's unreachable; the avatar in the top bar gets a pulsing red indicator when disconnected so you don't need to open the menu to notice. DVARA Flightdeck operates independently of the data plane — admin operations keep working even if the LLM Gateway is down, and the indicator tells you which surface is misbehaving.
Approval Queue badge. The Approval Queue entry under Agents carries a red badge showing the current pending-approval count, refreshed in the background — operators know a tool call is waiting on a human without opening the page.
The Mock Scenario Editor (/mock-scenarios) is reachable by direct URL only, behind a triple opt-in (mock.enabled + scenarios-dir + console-authoring=true). It stays off the sidebar by design — bundling Groovy means scripted scenarios can execute arbitrary code inside the gateway JVM, so the extra gate is deliberate defense in depth. See Mock Scenario Editor.
How the DVARA Flightdeck fits in
The DVARA Flightdeck is a single process listening on port 8090 that hosts the web UI and the Automation API side by side. Both surfaces read and write the same underlying data store, so a change made in DVARA Flightdeck is immediately visible to any script calling the REST API, and vice versa.
The dashboard panels refresh every few seconds by polling the DVARA Flightdeck, which in turn pulls live metrics from the LLM Gateway's Prometheus endpoint. Every other page in DVARA Flightdeck reads and writes configuration directly against the DVARA control plane store — not through the LLM Gateway — which is why admin operations keep working even during a data-plane outage.
The Automation API (/v1/admin/*) exposes CRUD endpoints for every resource DVARA Flightdeck can edit: tenants and API keys, routes (including canary + version history), policies (including dry-run, shadow, and promote), audit events and exports, users and roles, model pricing, cost records and summaries, budget caps, chargeback reports, compliance reports, MCP servers and tool calls, agent sessions, the approval queue, provider credentials, prompt templates and experiments, golden prompts, evals, guardrail plugins, and config export / import. See GitOps: Config Export / Import for the snapshot-and-replay workflow.
What to read next
- Setup & Login — start the DVARA Flightdeck, first-run
/setup, authentication modes, RBAC - Dashboard — the live metrics landing page
- Tenants & Users — tenant CRUD, API key management, role assignment
- Routes & Policies — routing config, policy editor, shadow testing
- Cost Management — FinOps dashboard, pricing, budgets, chargeback, compliance
- Agents & MCP — MCP server registry, tool calls, sessions, approvals
- A2A Governance — agent-to-agent peer registry, per-hop policies, own-chain hop audit, and the A2A approval queue (opt-in plane)
- Prompt Playground — interactive model testing
- GitOps: Config Export / Import — Automation API workflows
- License & Operations — license status, health probes
- Tenant Portal — the tenant self-service surface: sign in, API keys, budgets, policies, usage, and audit