License & Operations
This page covers operational surfaces in the DVARA Flightdeck: personal access tokens, guardrail plugin management, license monitoring, and health probes.
/providers is now a 302 redirect to /credentials. Provider activation is visible directly in the credentials list — every entry shows which provider it serves and which scope (platform-default or tenant-scoped) it covers, and the resolution source (database / vault / environment) is documented in Credentials & BYOK. The previous per-provider resolution-source view has been removed.
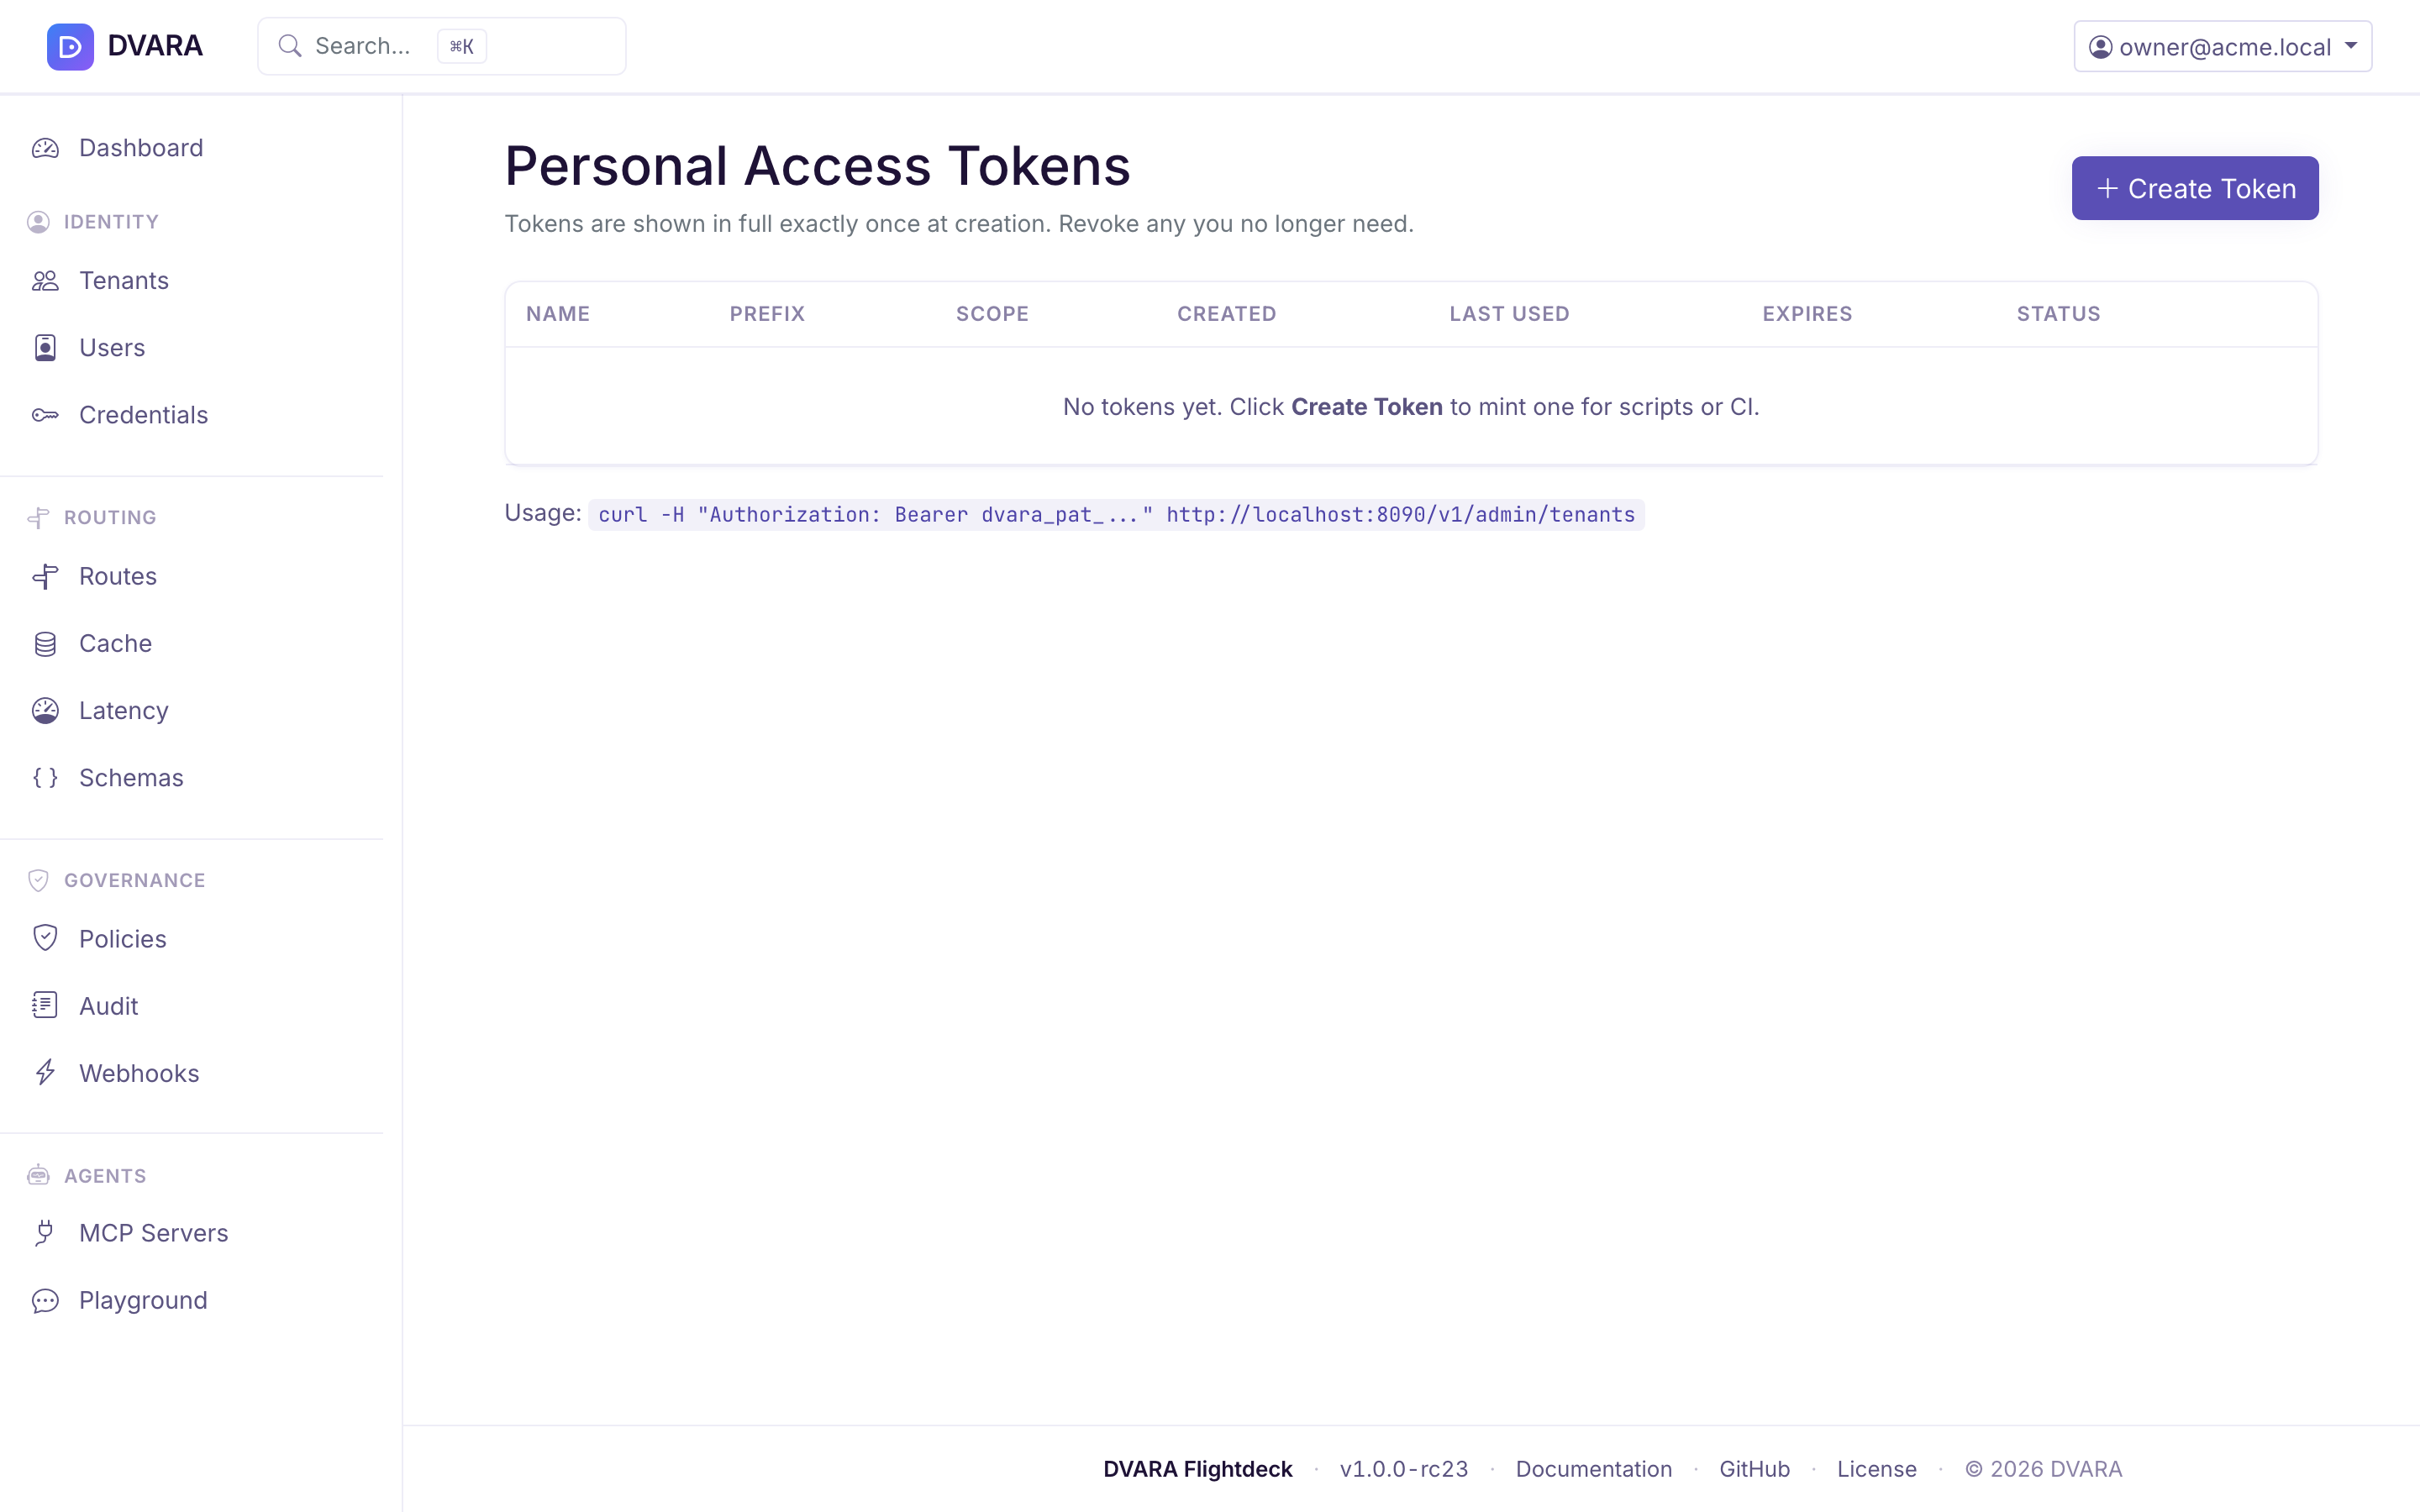
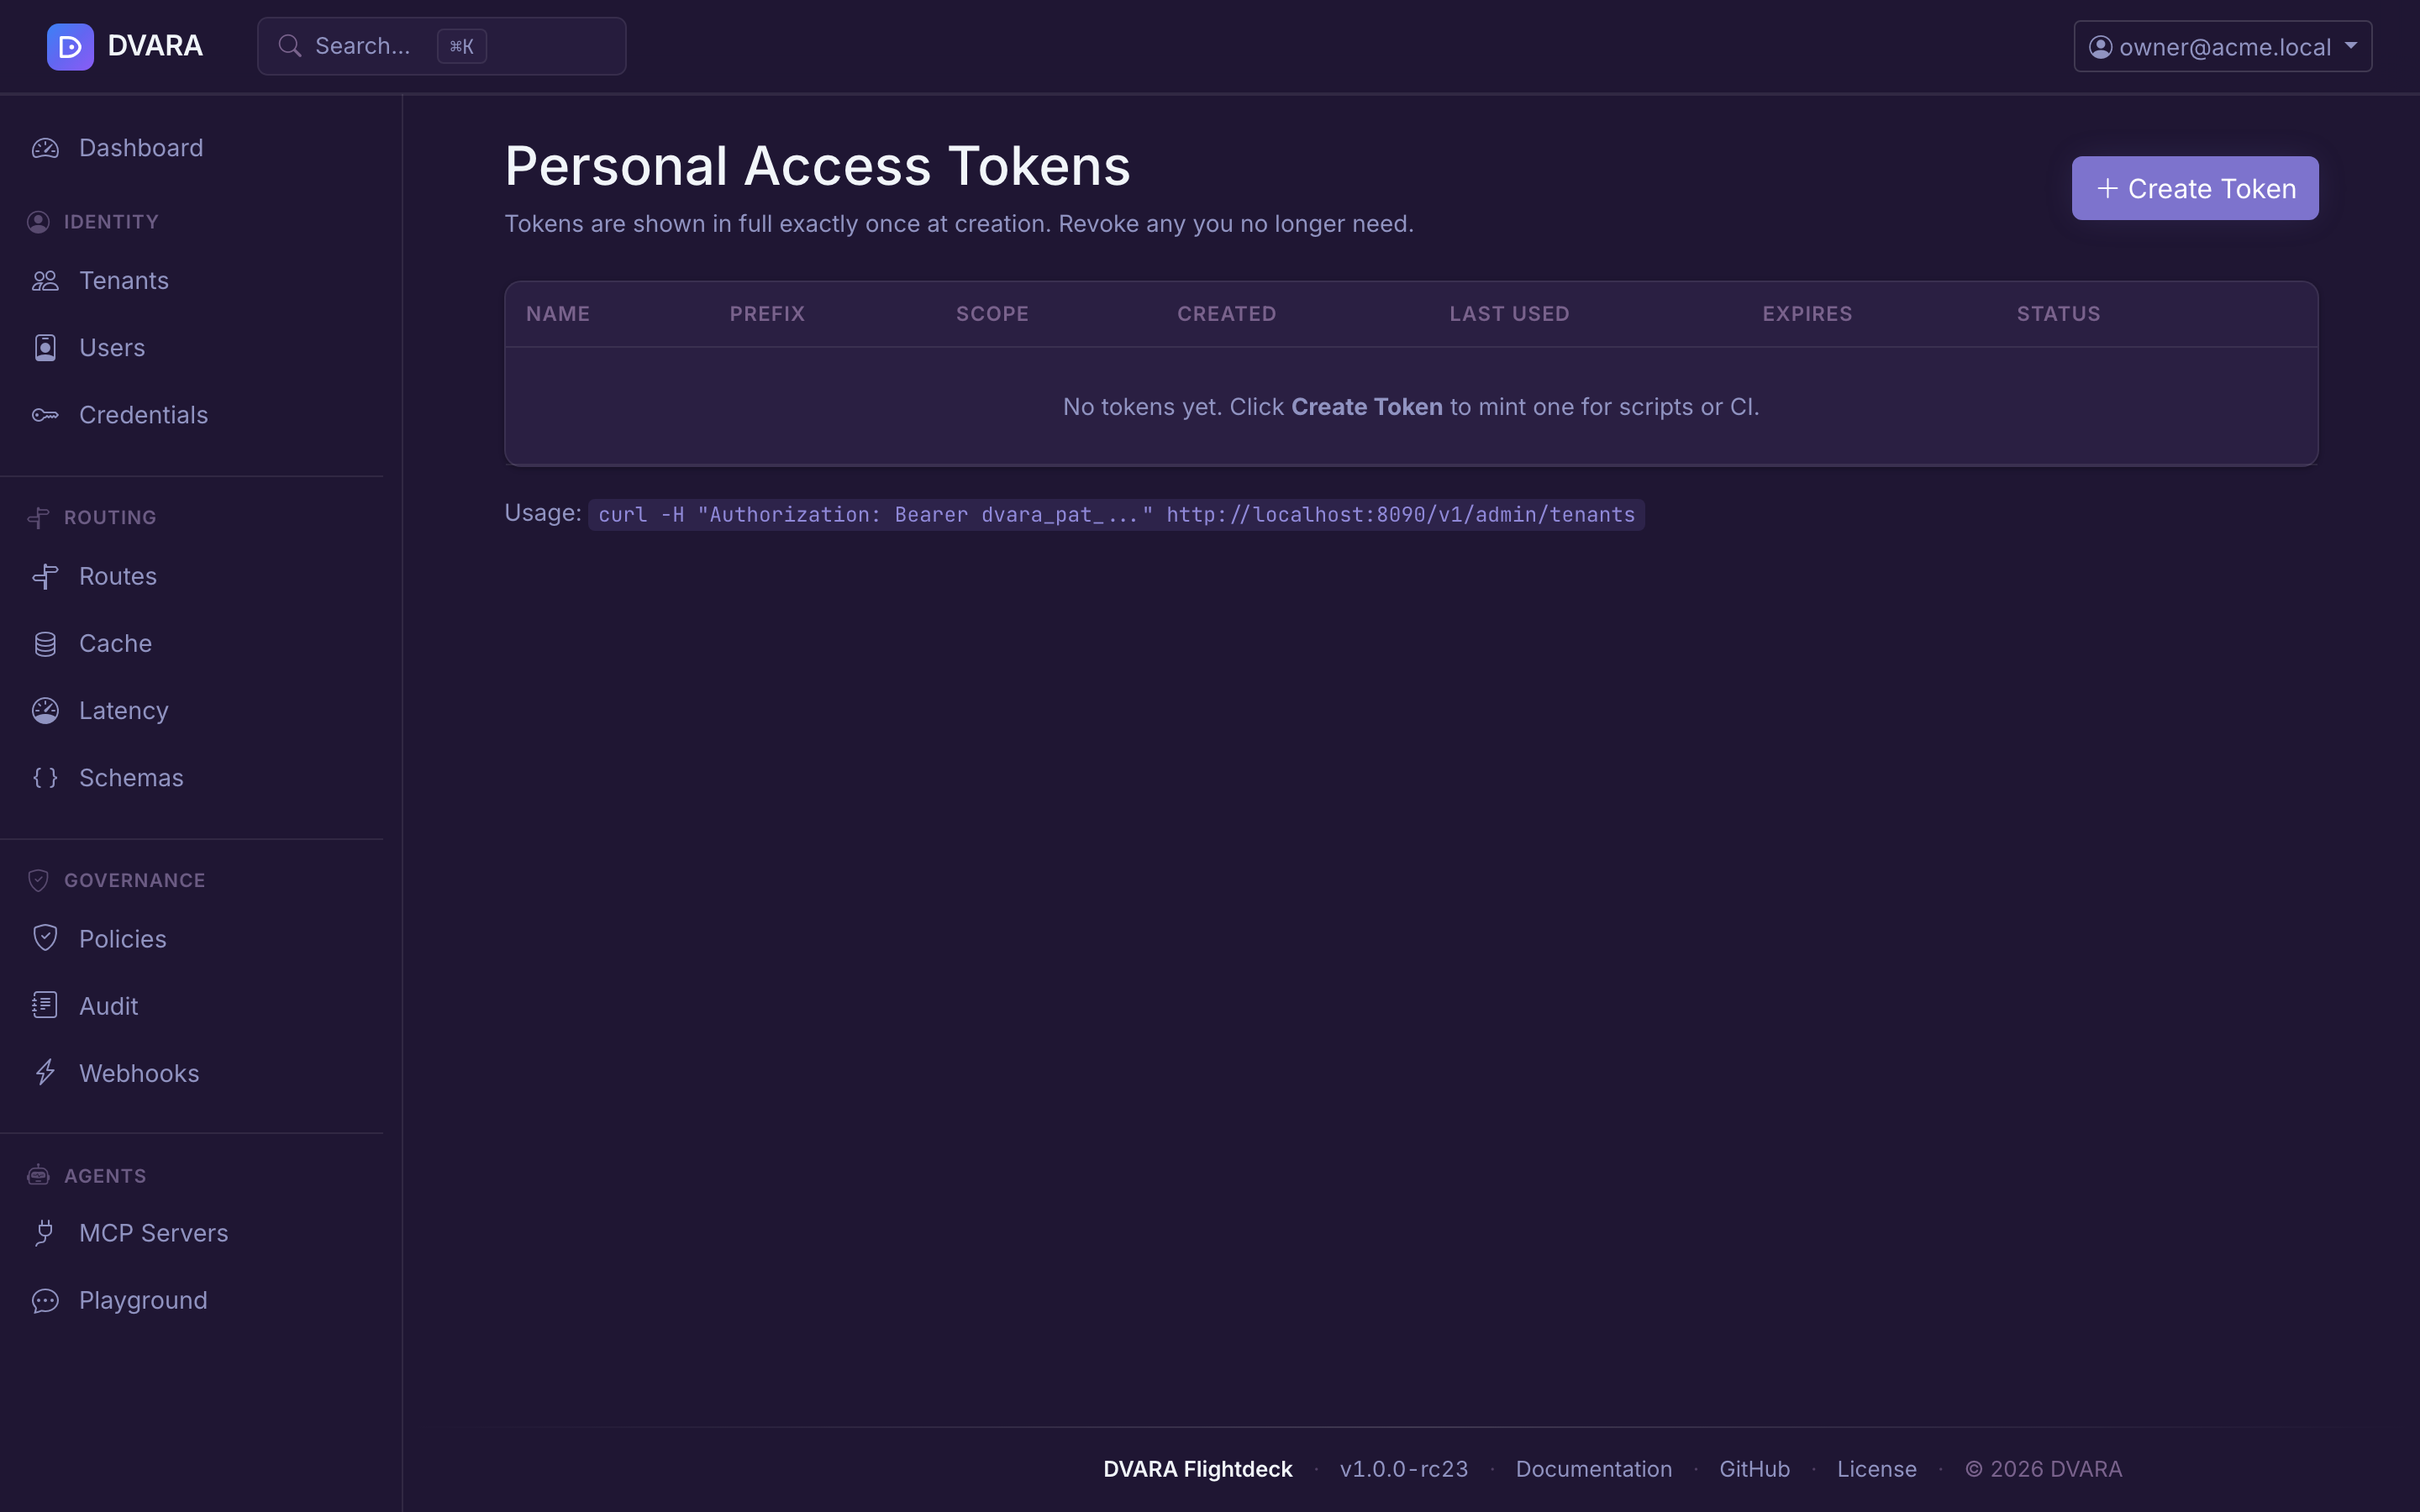
Personal access tokens
Open the user menu (top-right corner) and select Access Tokens to manage personal access tokens (PATs) for API automation.
PATs use the dvara_pat_ prefix followed by a random identifier. The raw token is displayed exactly once at creation — copy it immediately, as it cannot be retrieved again. Only a SHA-256 hash is stored.
Creating a token
Click Create Token, provide a name and optional expiry date. Scopes are set automatically from your current roles. The new token appears in a one-time alert with a Copy button.
Token table
| Column | Description |
|---|---|
| Name | Human-readable label |
| Prefix | First 20 characters of the token (dvara_pat_ab...) |
| Created | Creation timestamp |
| Last Used | Last authentication timestamp, or "Never" |
| Expires | Expiry date, or "Never" |
| Status | Active, Expired, or Revoked |
Revoking a token
Click Revoke next to any active token. Revocation is permanent — revoked tokens cannot be reactivated. You can only see and revoke your own tokens.
Usage
curl -H "Authorization: Bearer dvara_pat_..." http://localhost:8090/v1/admin/tenants
PATs work for both the platform Console and the tenant portal. Every create and revoke emits a PAT_CREATED / PAT_REVOKED audit event.
Guardrail plugin management
Navigate to /guardrail-plugins in your browser. This page manages external guardrail plugin definitions — the webhook endpoints that run alongside built-in detectors in the composite guardrail chain.
RBAC: Requires owner or policy-admin role. Secret rotation requires owner.
Plugin list
The table shows all platform-global and tenant-scoped plugins with:
| Column | Description |
|---|---|
| Name | Plugin identifier |
| Scope | Platform badge (global) or tenant ID |
| URL | Webhook endpoint |
| Timeout | HTTP timeout in milliseconds |
| Fail Mode | OPEN (return empty on failure) or CLOSED (throw exception on failure) |
| Status | Enabled or Disabled |
| Updated | Last modification timestamp |
The table auto-refreshes every 10 seconds. Use the Tenant dropdown to filter by scope.


Creating a plugin
Click New Plugin and provide:
- Name — unique identifier
- URL — webhook endpoint
- HMAC Secret — signing secret for request authentication (encrypted with AES-256-GCM before storage)
- Timeout (ms) — HTTP call timeout (default 5000)
- Fail Mode —
OPENorCLOSED - Tenant — leave blank for platform-global, or select a tenant for tenant-scoped
DVARA_ENCRYPTION_MASTER_PASSWORD must be set for secret encryption. The form shows an error if it is not configured.
Rotating a secret
Click Rotate to replace the HMAC signing secret. The old secret is permanently replaced and the change takes effect across all pods on their next config-version poll (a few seconds).
Audit events
Every mutation emits a GUARDRAIL_PLUGIN_CREATED, GUARDRAIL_PLUGIN_UPDATED, GUARDRAIL_PLUGIN_ROTATED, or GUARDRAIL_PLUGIN_DELETED audit event.
For the Automation API counterpart, see the Admin API reference. For guardrail plugin concepts, see ML & Plugin Guardrails.
License status
This is the runtime view. To request, apply, or renew a license, see Get and apply a license.
Open the user menu in the top-right and click License to open the license-status page (also reachable directly at /license).
Shows license details and runtime status:
- Licensee — name of the license holder
- License type —
TRIALorPRODUCTION - Expiry date — license expiration with days remaining
- Runtime status badge — color-coded:
VALID(green) — more than 30 days remainingEXPIRING_SOON(yellow) — ≤ 30 days remainingGRACE_PERIOD(orange) — expired, within 14-day grace periodDEGRADED(red) — expired beyond the 14-day grace period
- Renewal instructions — displayed when the license is expiring or expired
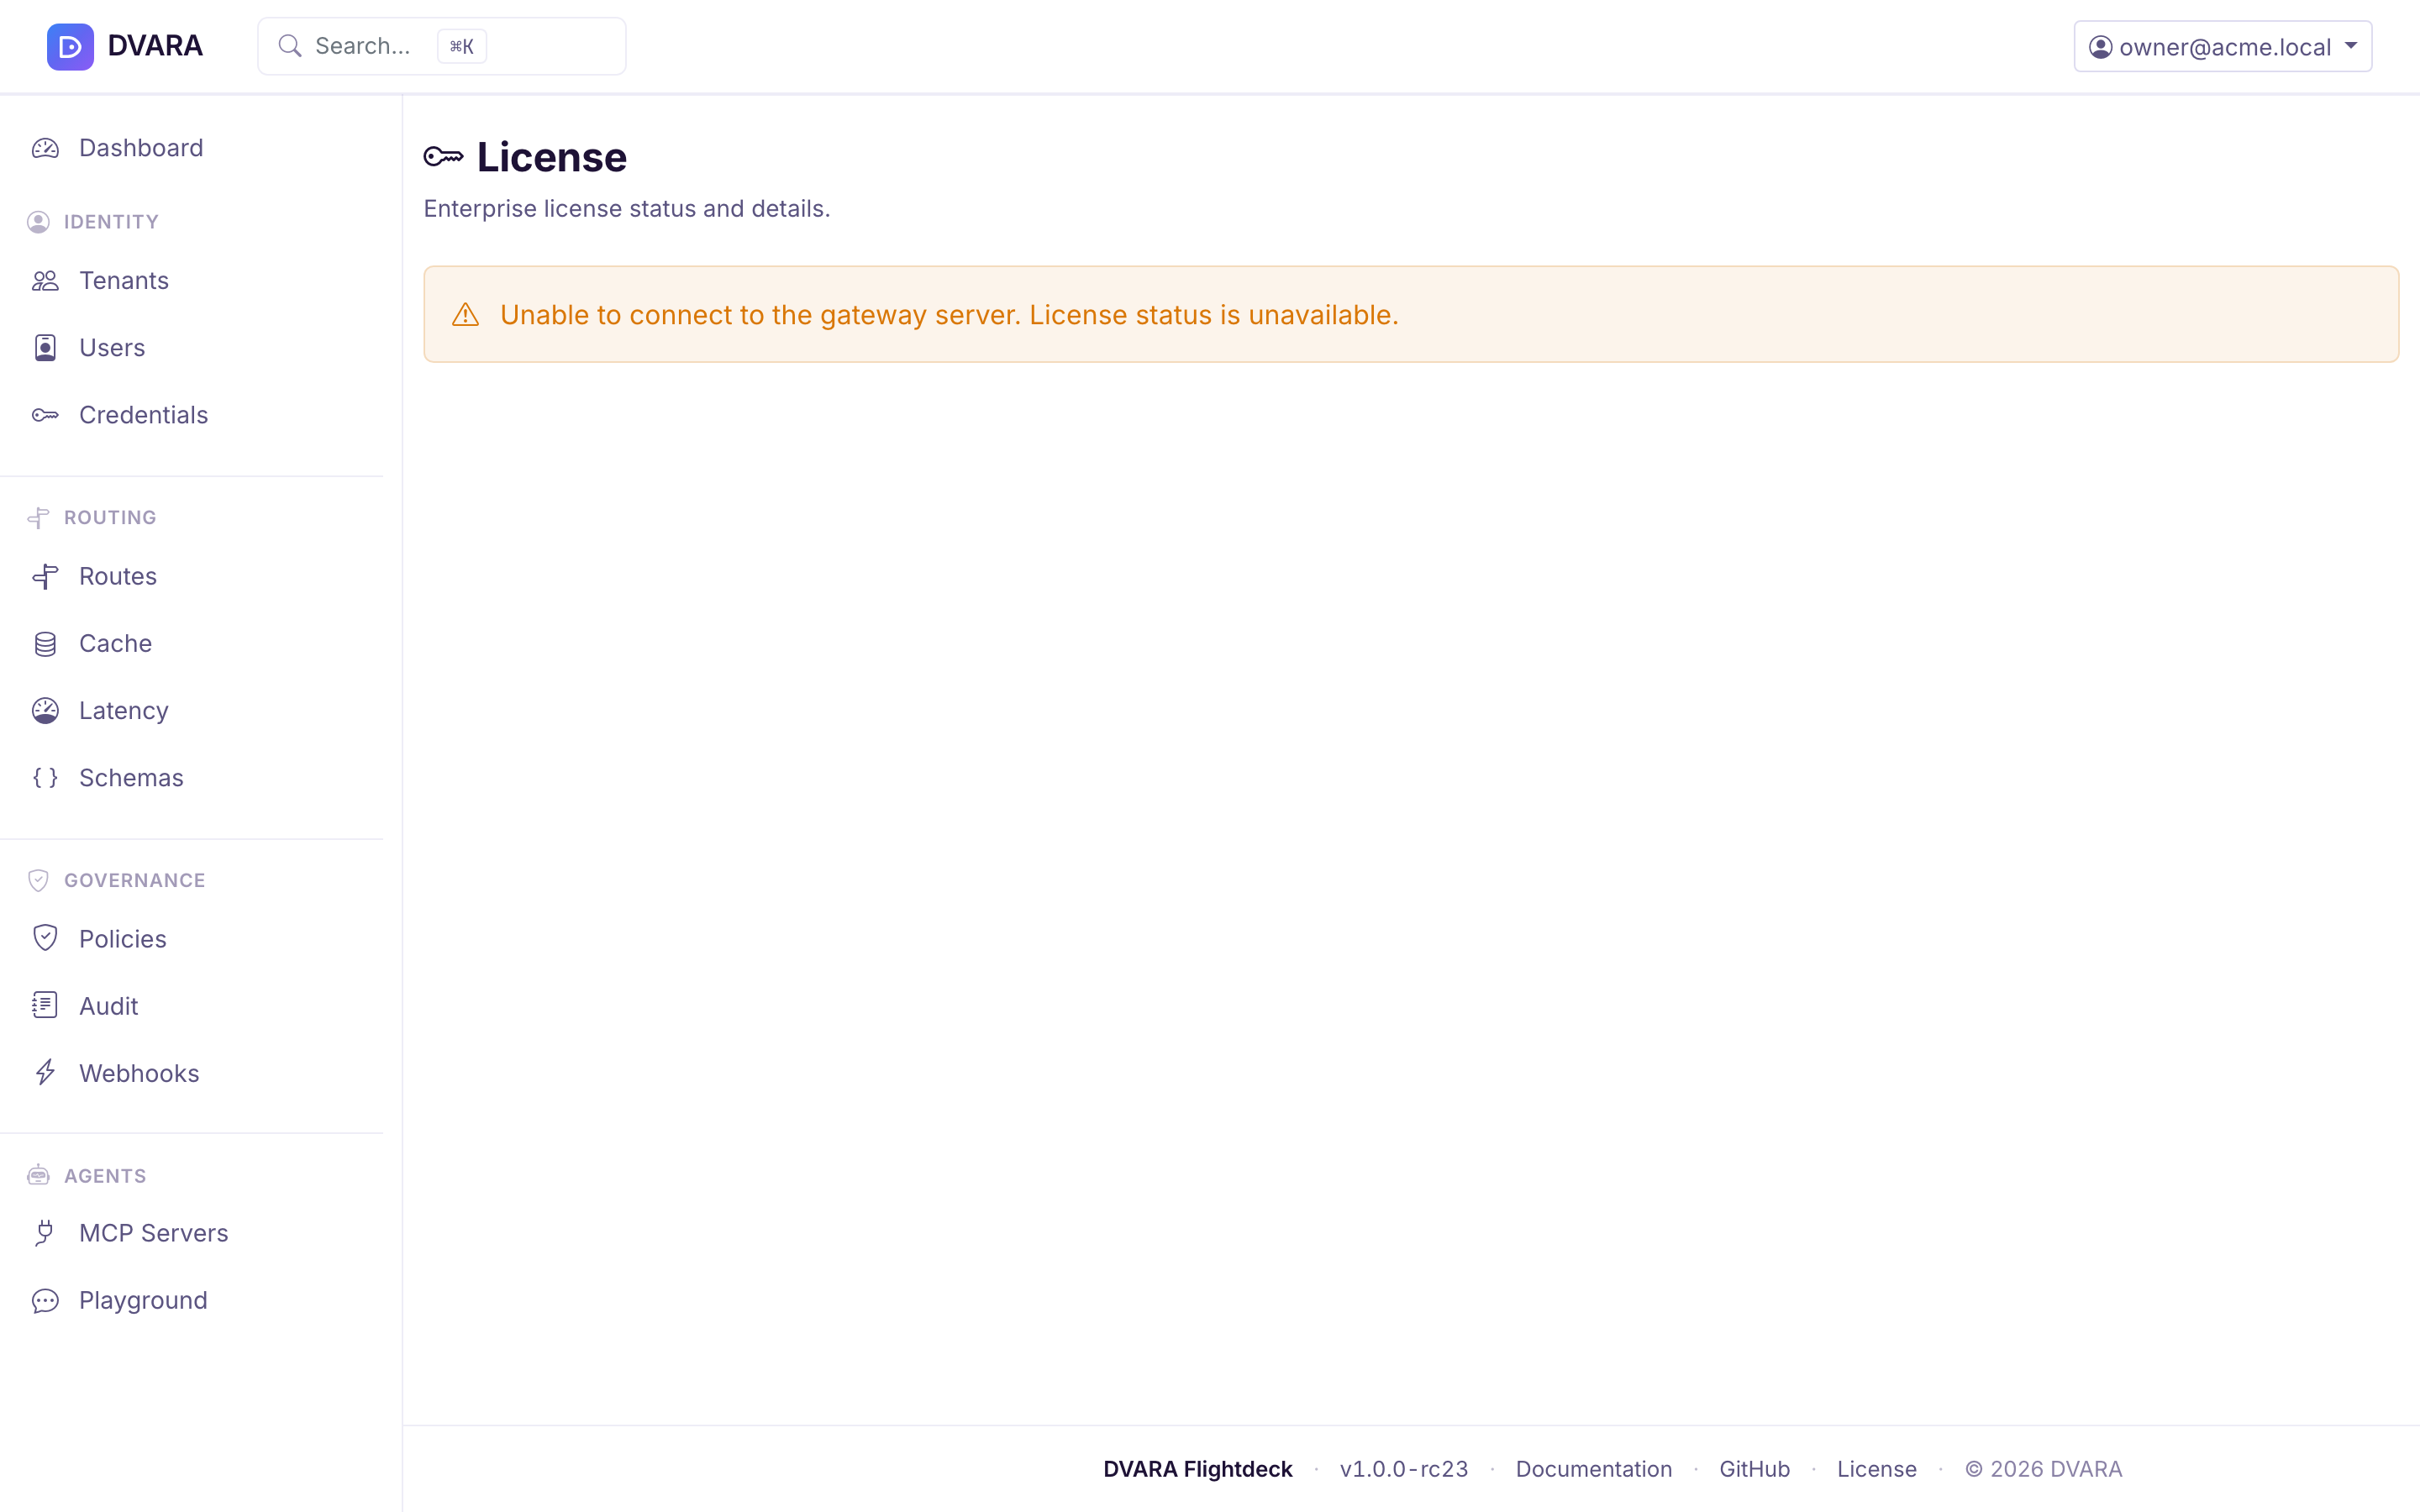
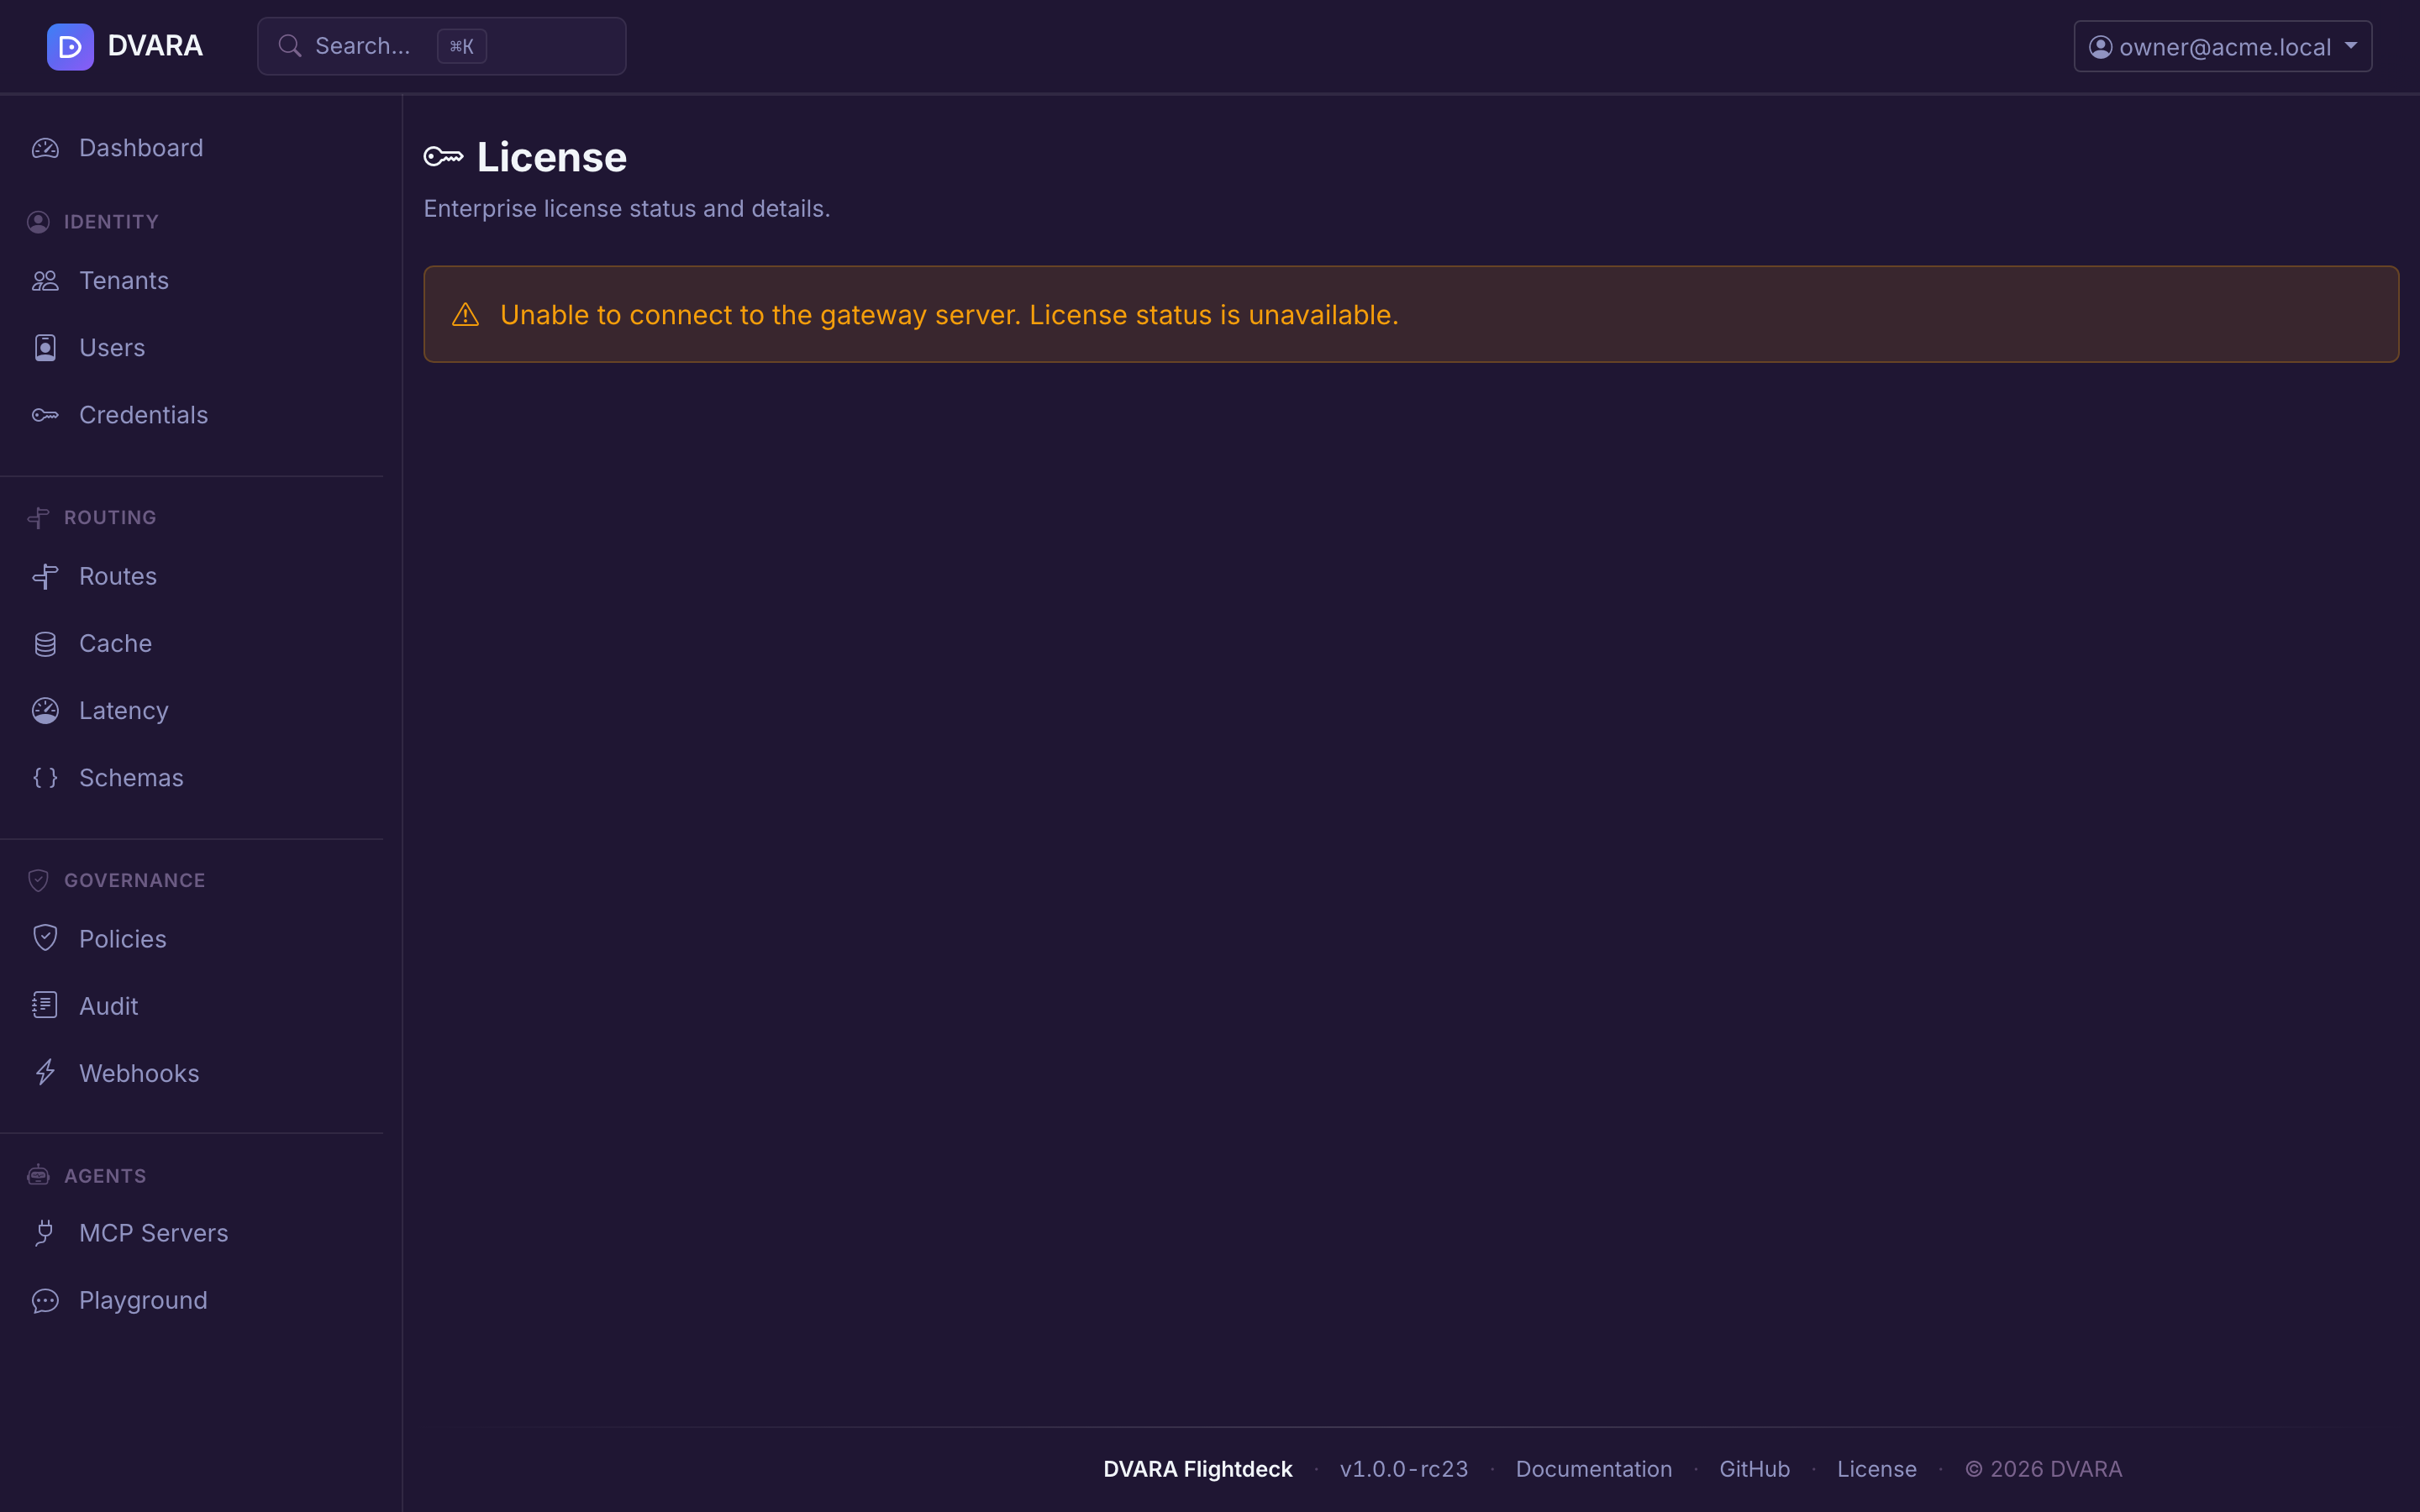
Data is read from the LLM Gateway's /actuator/gateway-status endpoint, which requires Authorization: Bearer $DVARA_ACTUATOR_API_KEY. Set the same secret on the DVARA Flightdeck (via DVARA_ACTUATOR_API_KEY) and on the LLM Gateway so the Flightdeck's License page can authenticate. When the license is in DEGRADED state, the data plane rejects /v1/* requests with HTTP 402 / type: license_error / code: LICENSE_EXPIRED; the DVARA Flightdeck stays up so you can still diagnose and renew.
Health probes
The DVARA Flightdeck exposes health endpoints designed for Kubernetes probes:
| Endpoint | Purpose |
|---|---|
GET /actuator/health/liveness | Kubernetes liveness probe |
GET /actuator/health/readiness | Kubernetes readiness probe (includes a controlPlane health check) |
The readiness probe checks database connectivity and the LLM Gateway connection. The DVARA Flightdeck operates independently of the LLM Gateway — admin operations continue even if the LLM Gateway is down, but readiness returns OUT_OF_SERVICE until both come back.
The Helm chart wires these up automatically:
livenessProbe:
  httpGet:
    path: /actuator/health/liveness
    port: http
readinessProbe:
  httpGet:
    path: /actuator/health/readiness
    port: http
startupProbe:
  httpGet:
    path: /actuator/health/liveness
    port: http
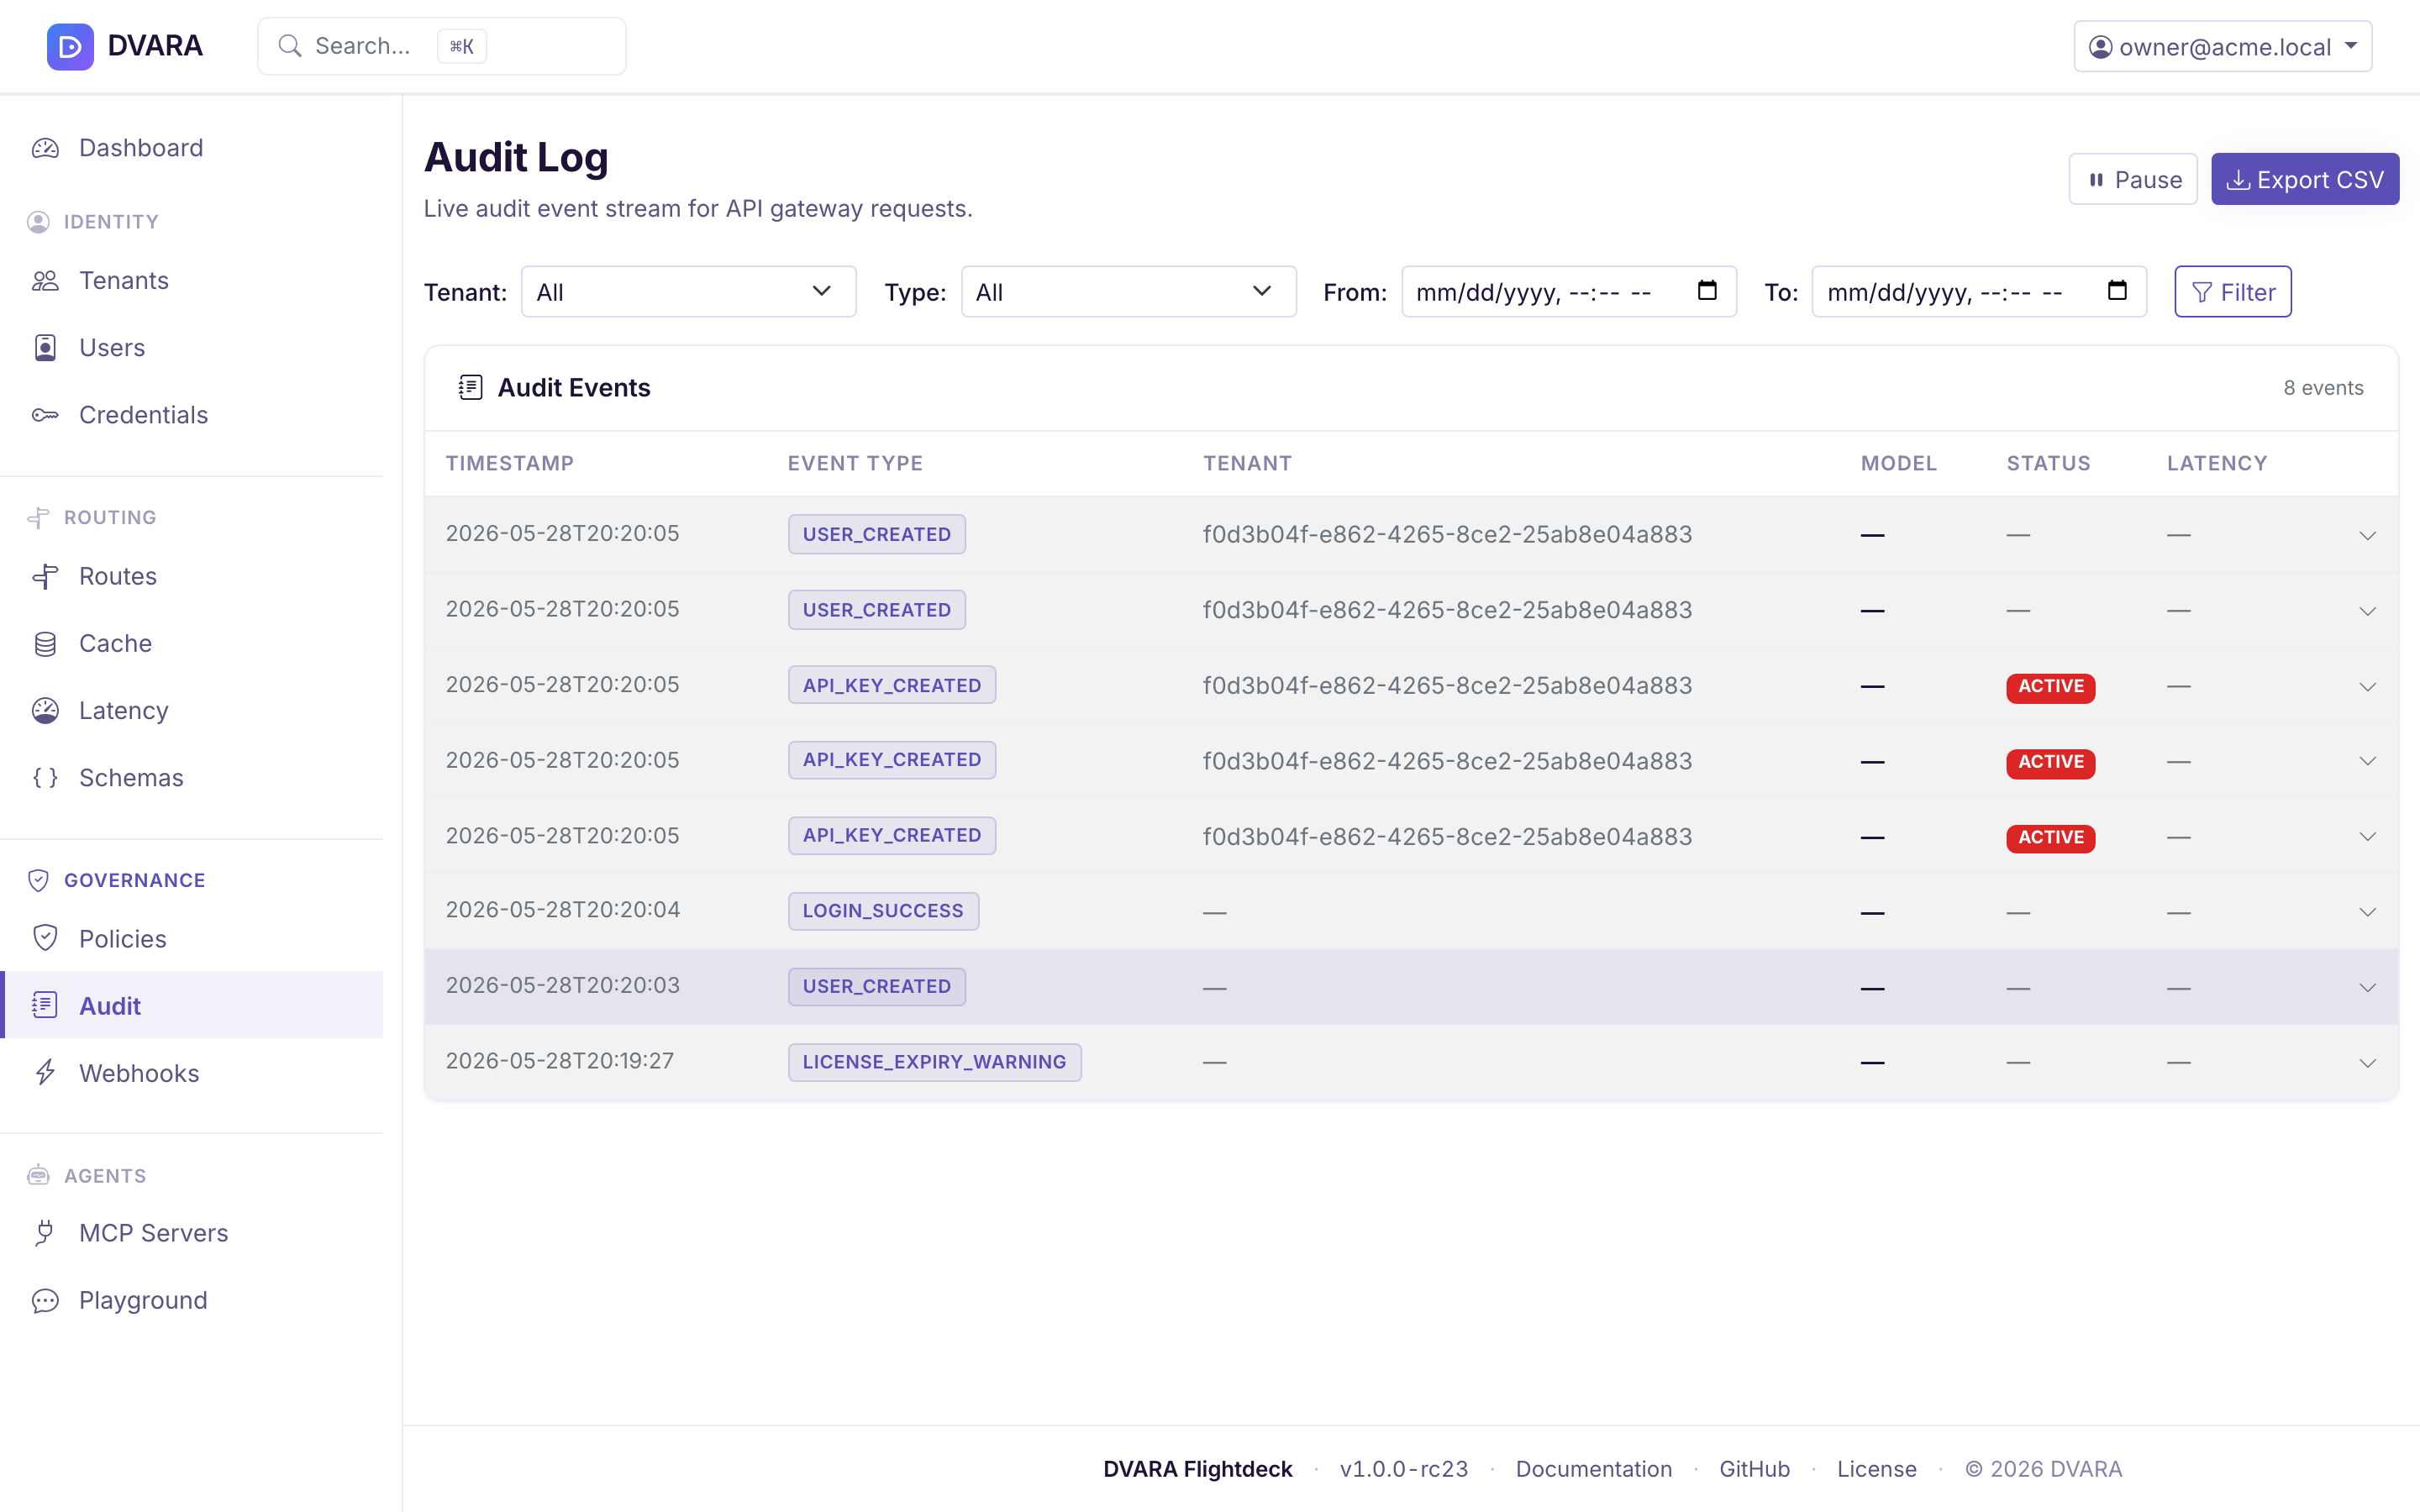
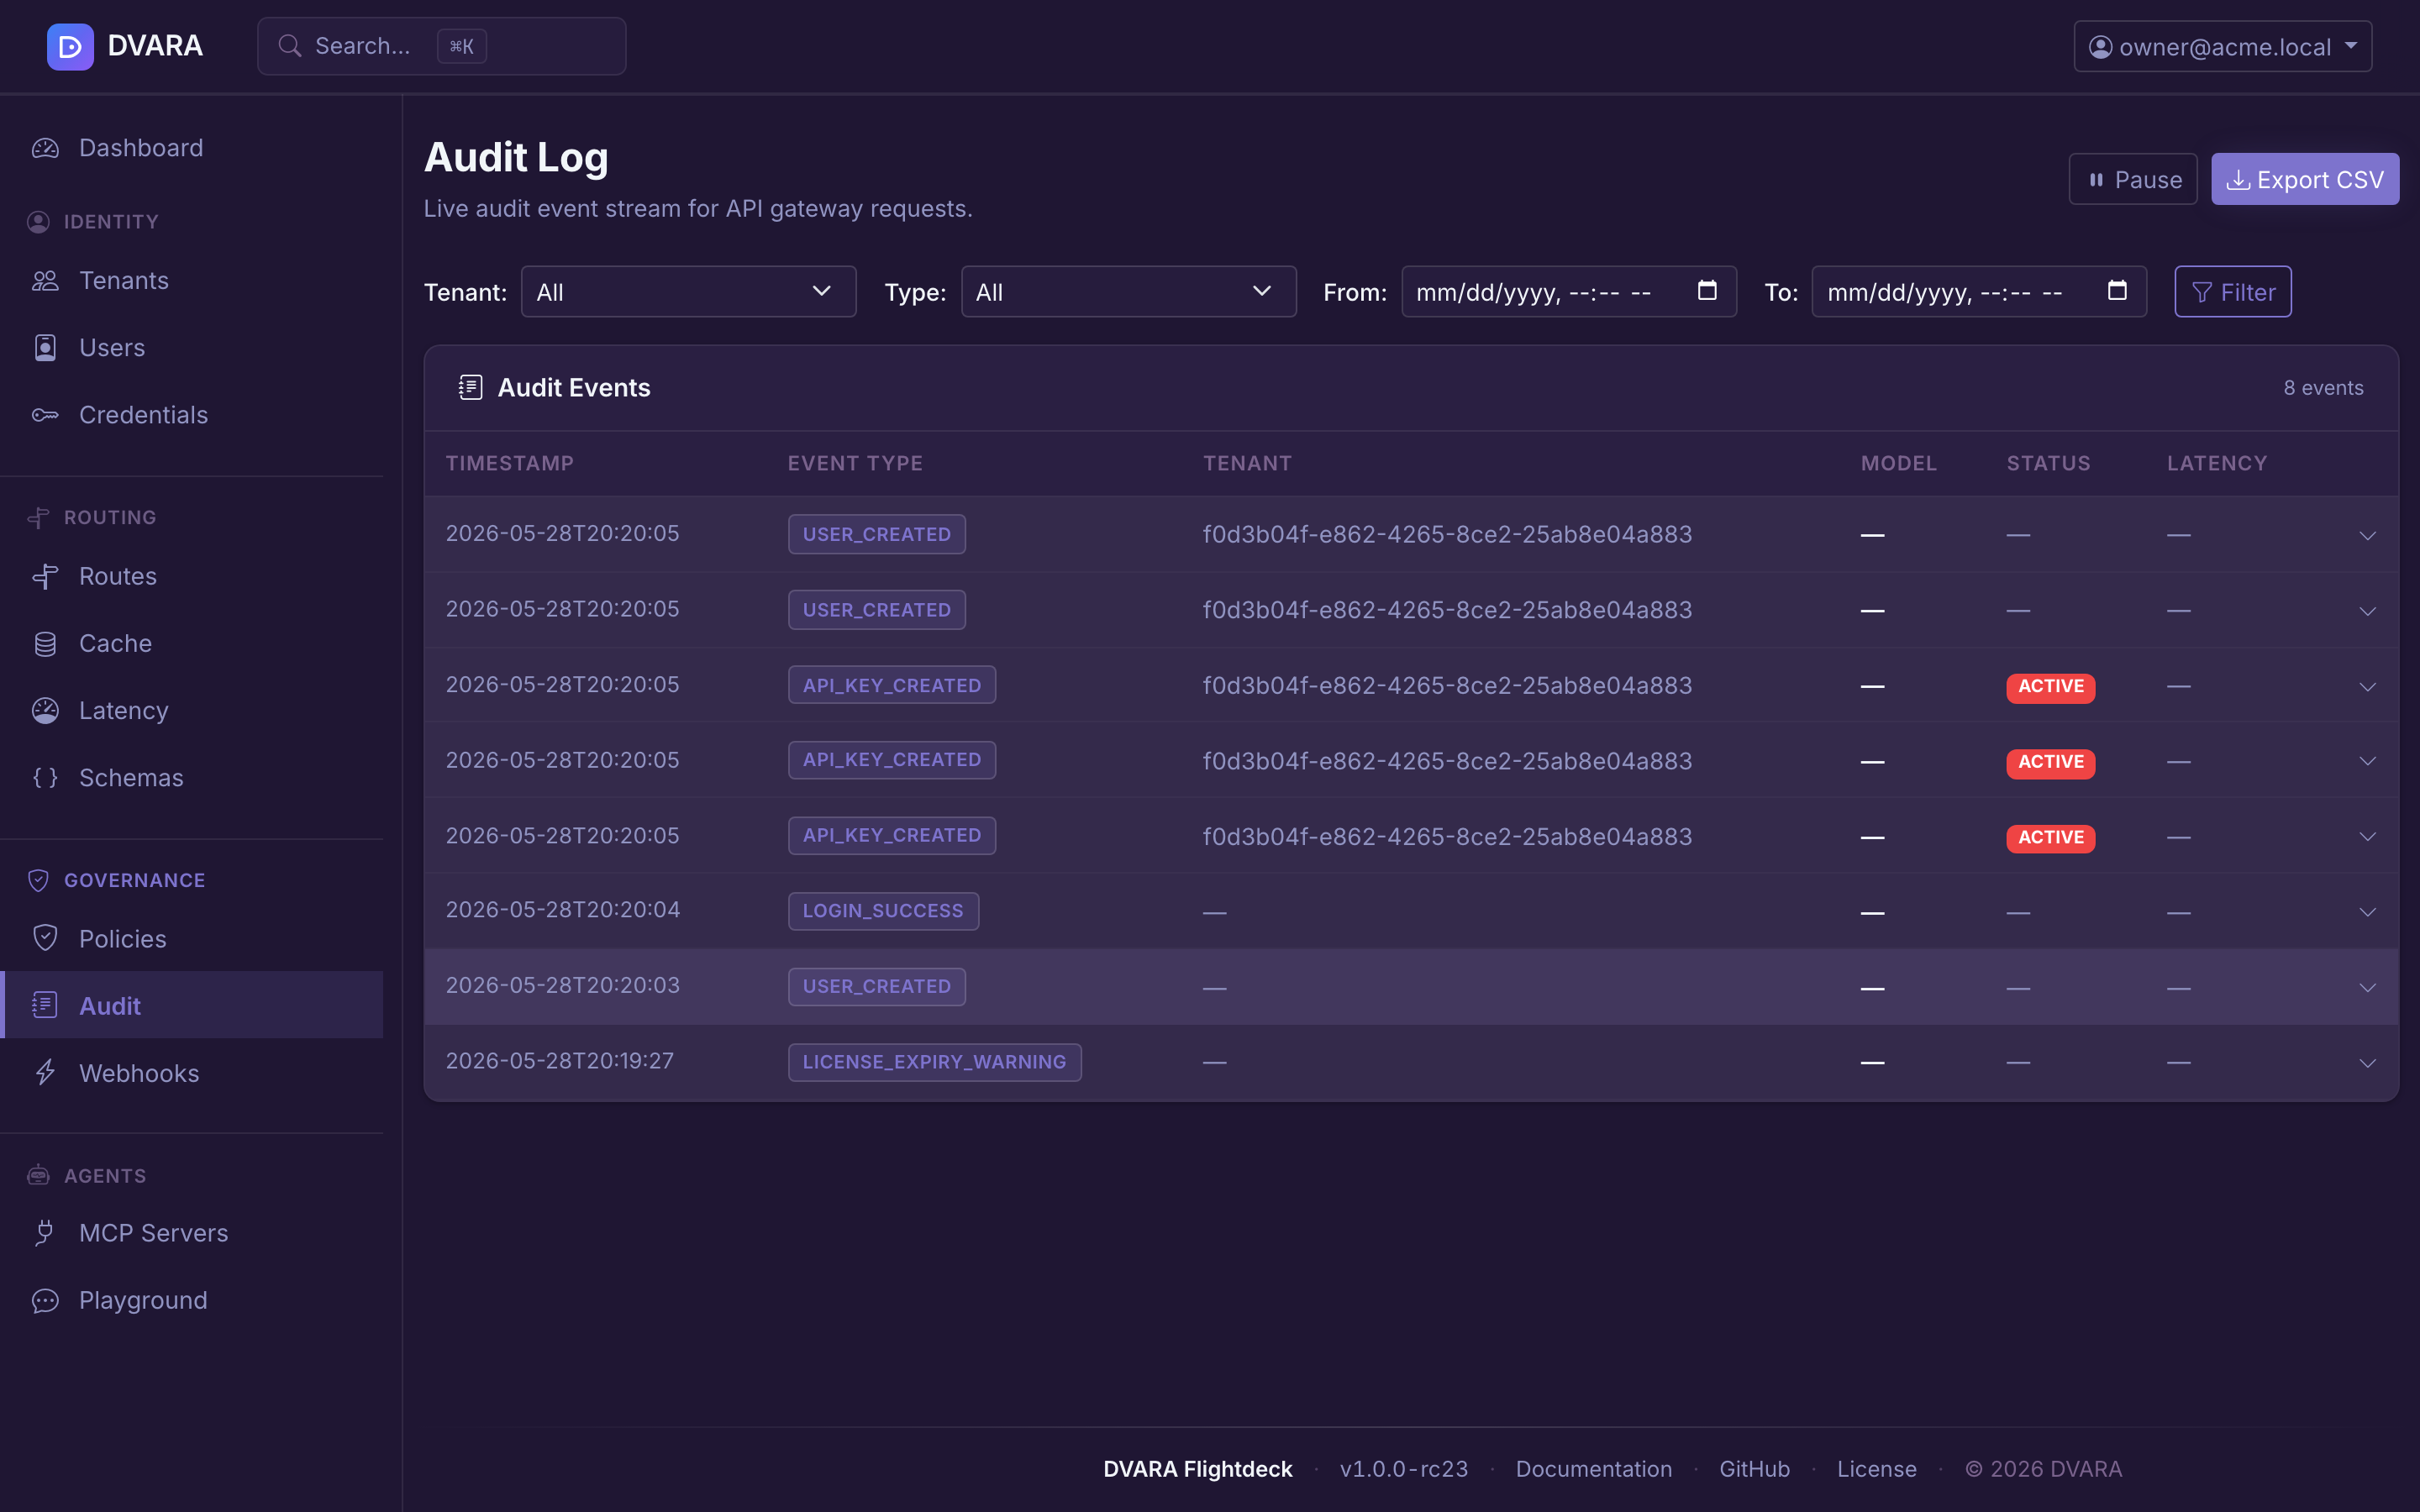
Audit event stream
The sidebar's Governance → Audit page (documented in more detail under Governance) is the third operational surface. It exposes every append-only event written to the audit chain — policy decisions, authentication events, config imports, license transitions, and more — with a live-polling table (3-second refresh), click-to-expand event detail, and CSV / JSON exports via /v1/admin/audit/events/export.