Routes & Policies
Routes decide which provider answers a request. Policies decide whether the request is allowed at all. Both are versioned, both propagate live to the data plane without restart, and both support dry-run / shadow modes before going active.
Route configuration
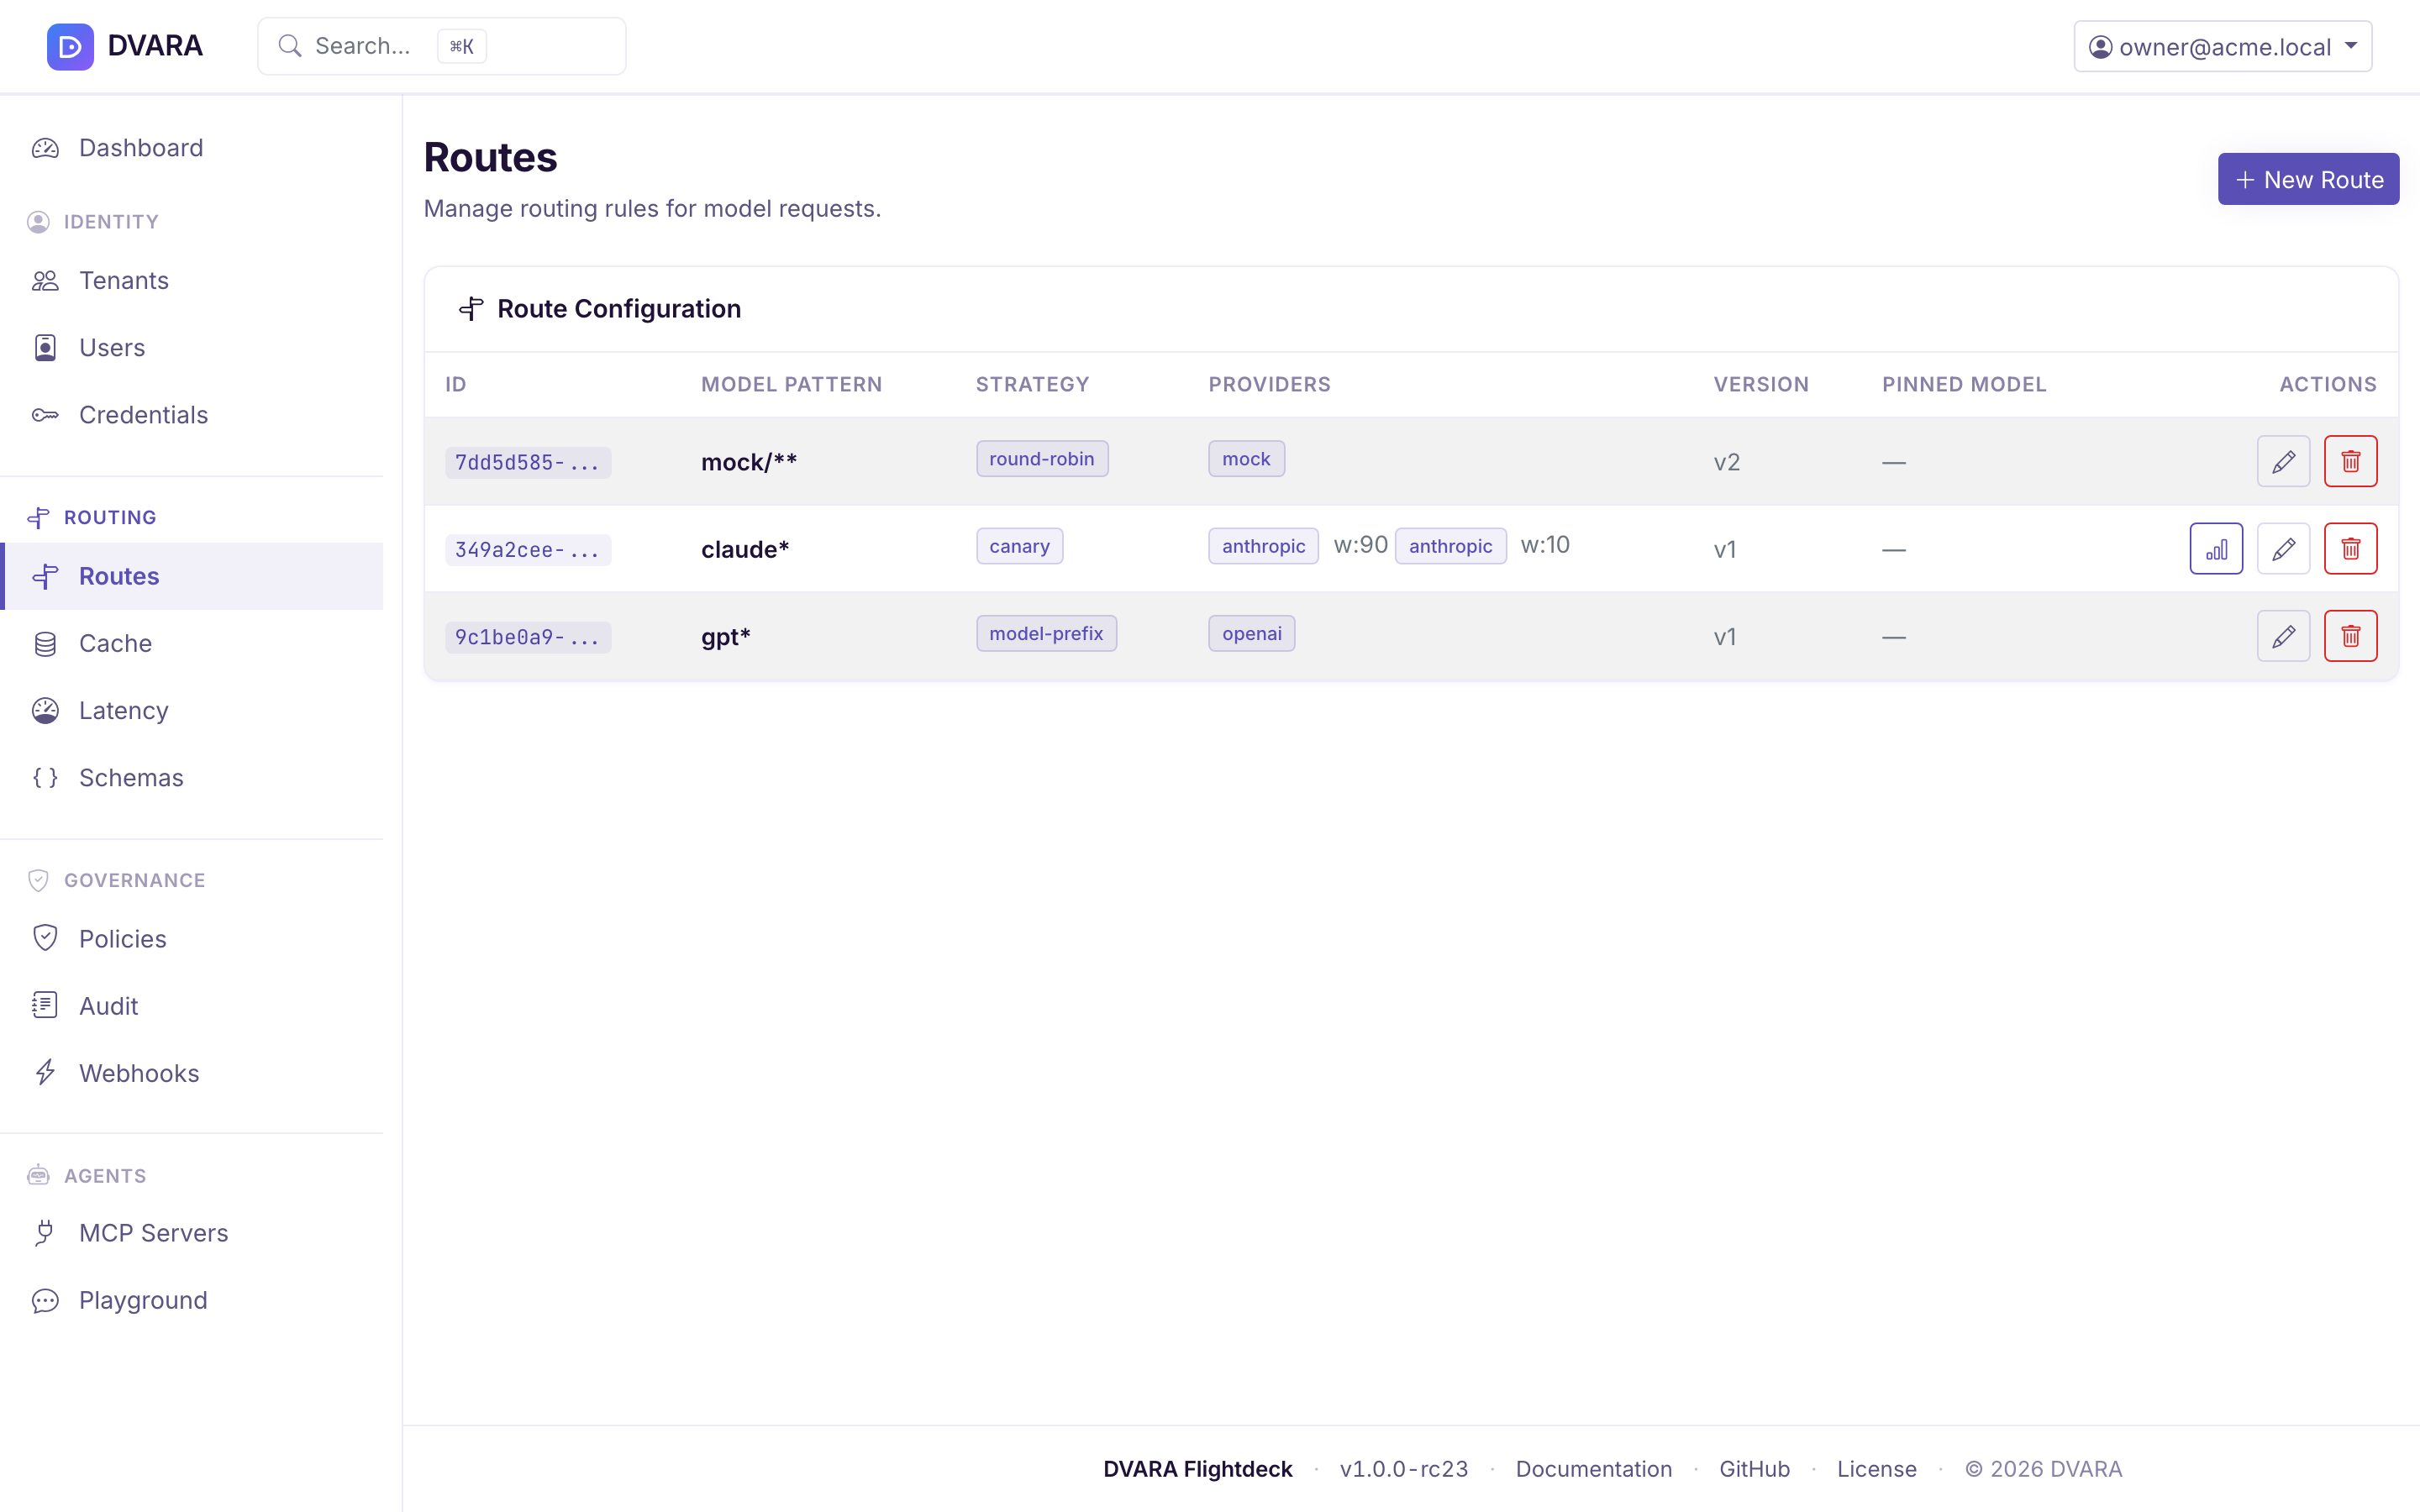
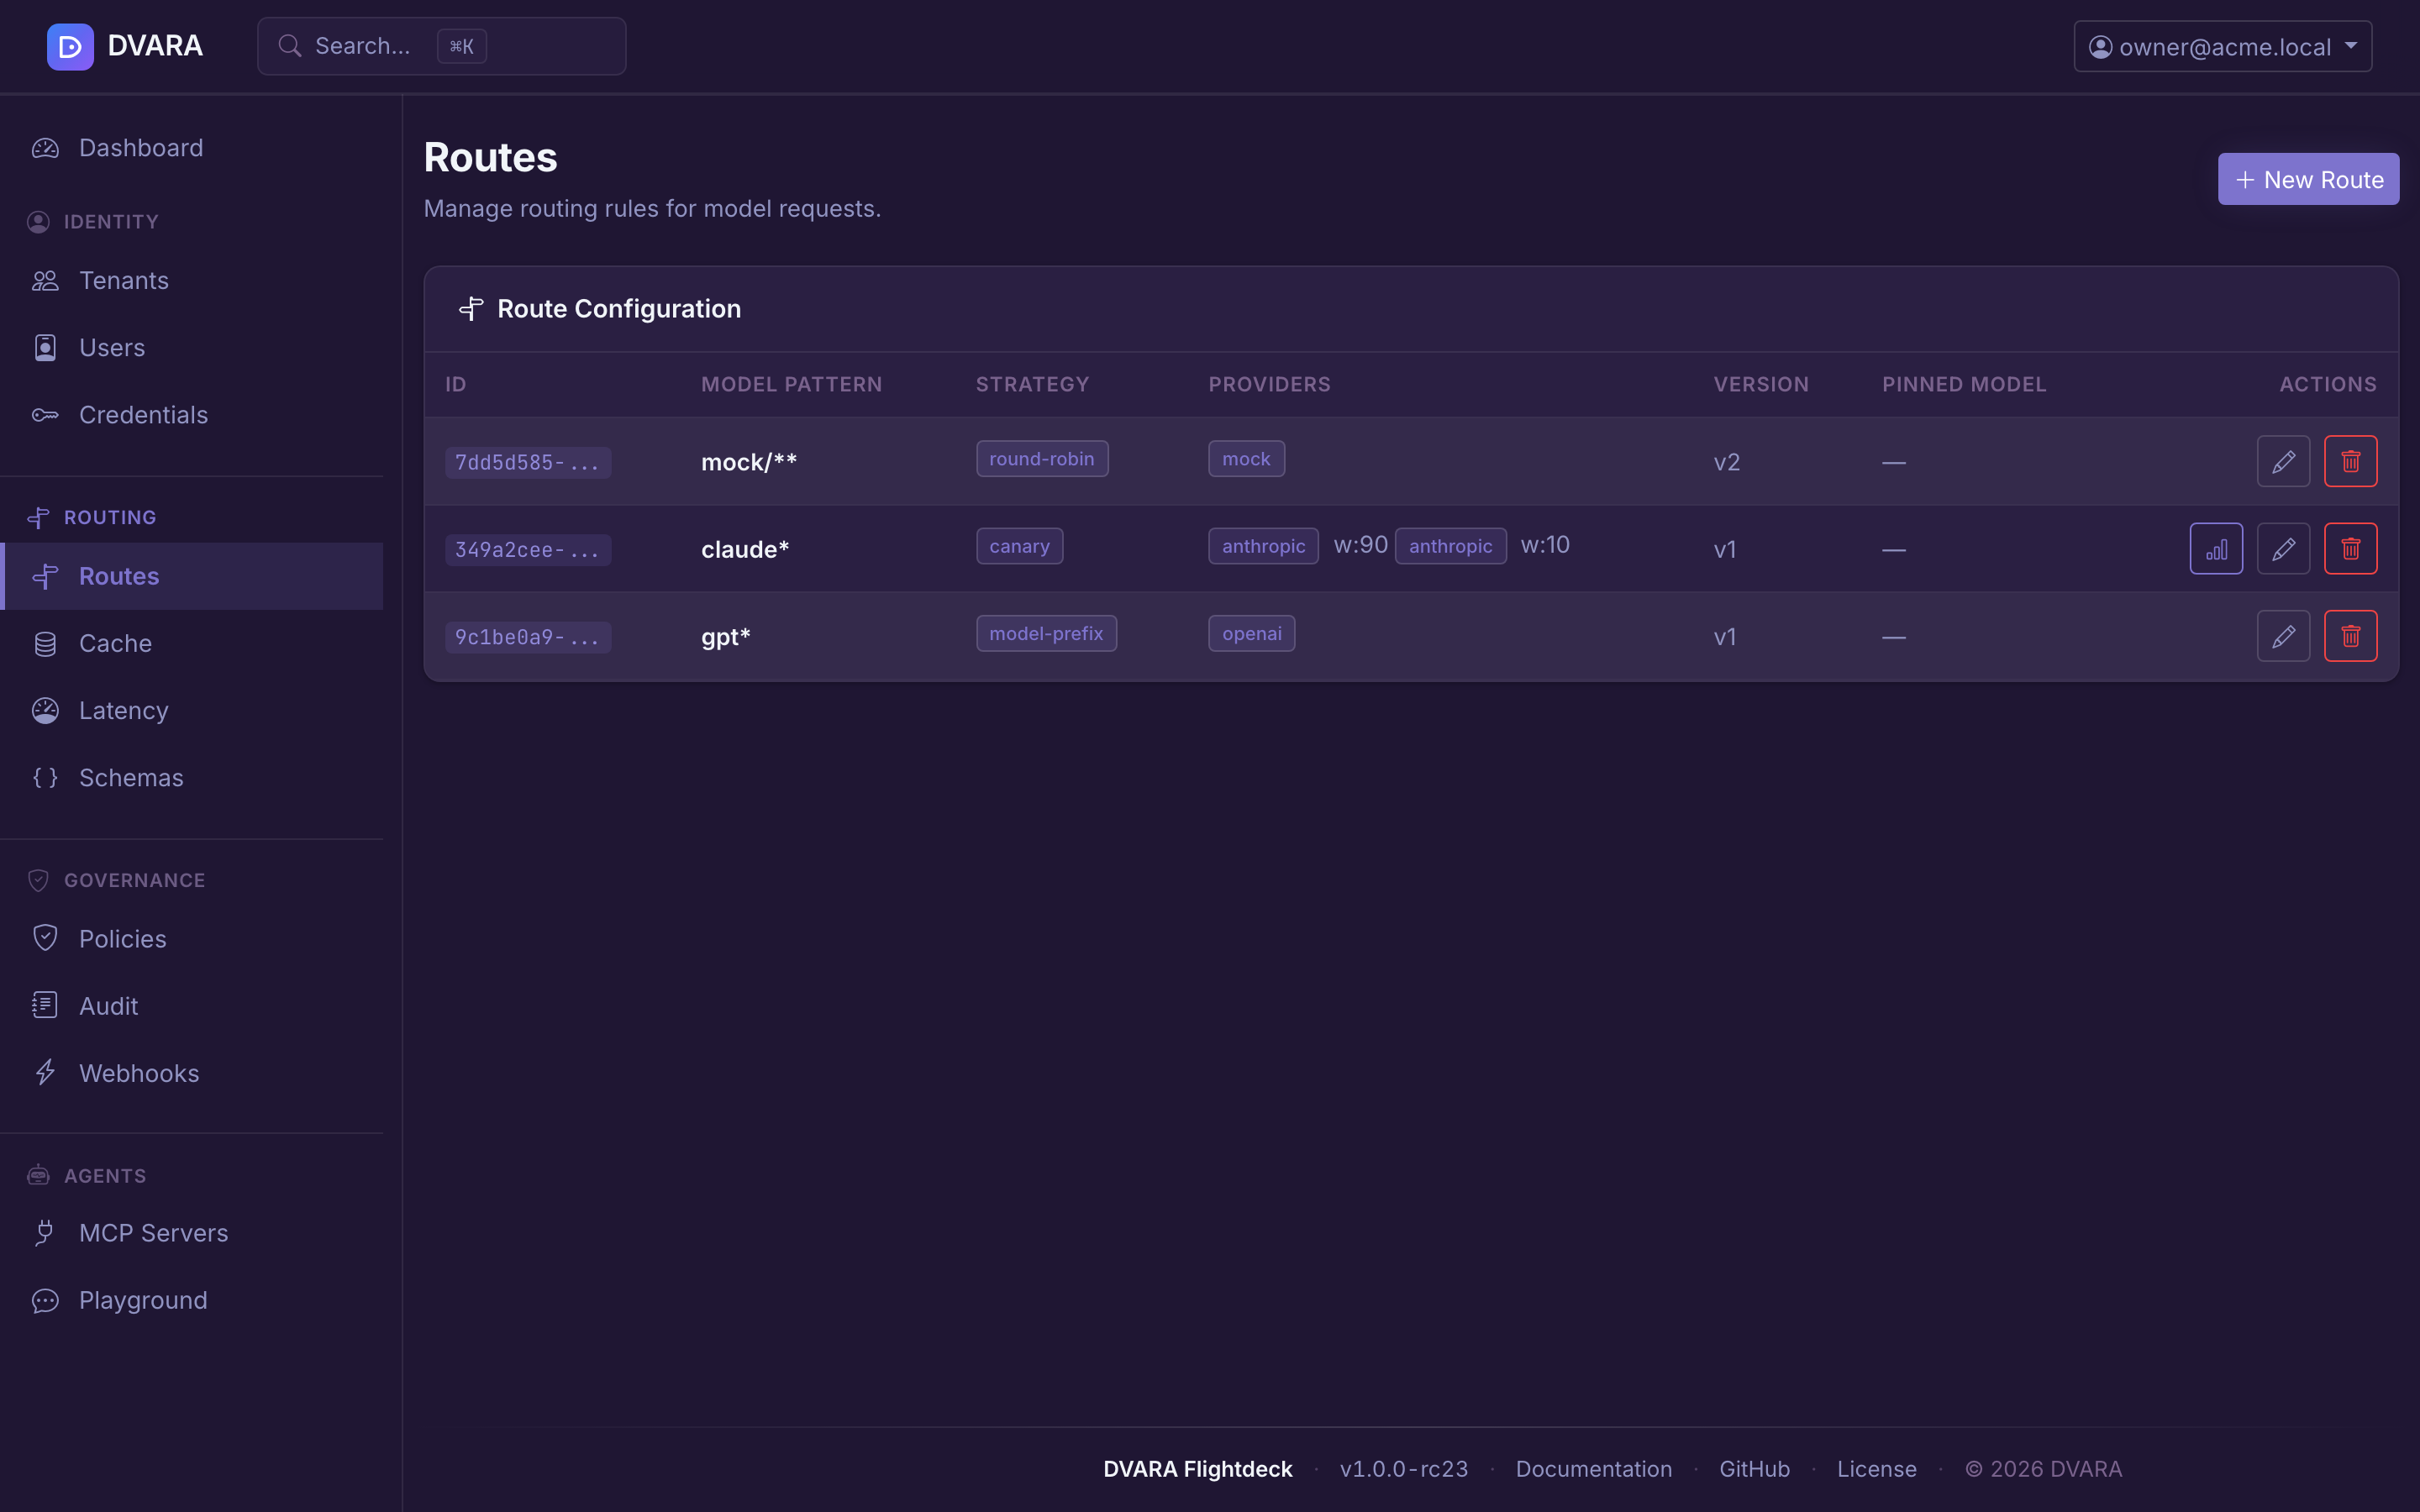
Open Routing → Routes in the sidebar.
Route list
Lists every route with ID, model pattern, strategy, providers with weights, version, and pinned model version. Auto-refreshes every 10 seconds. Click Edit to open the route editor or Delete to remove a route.
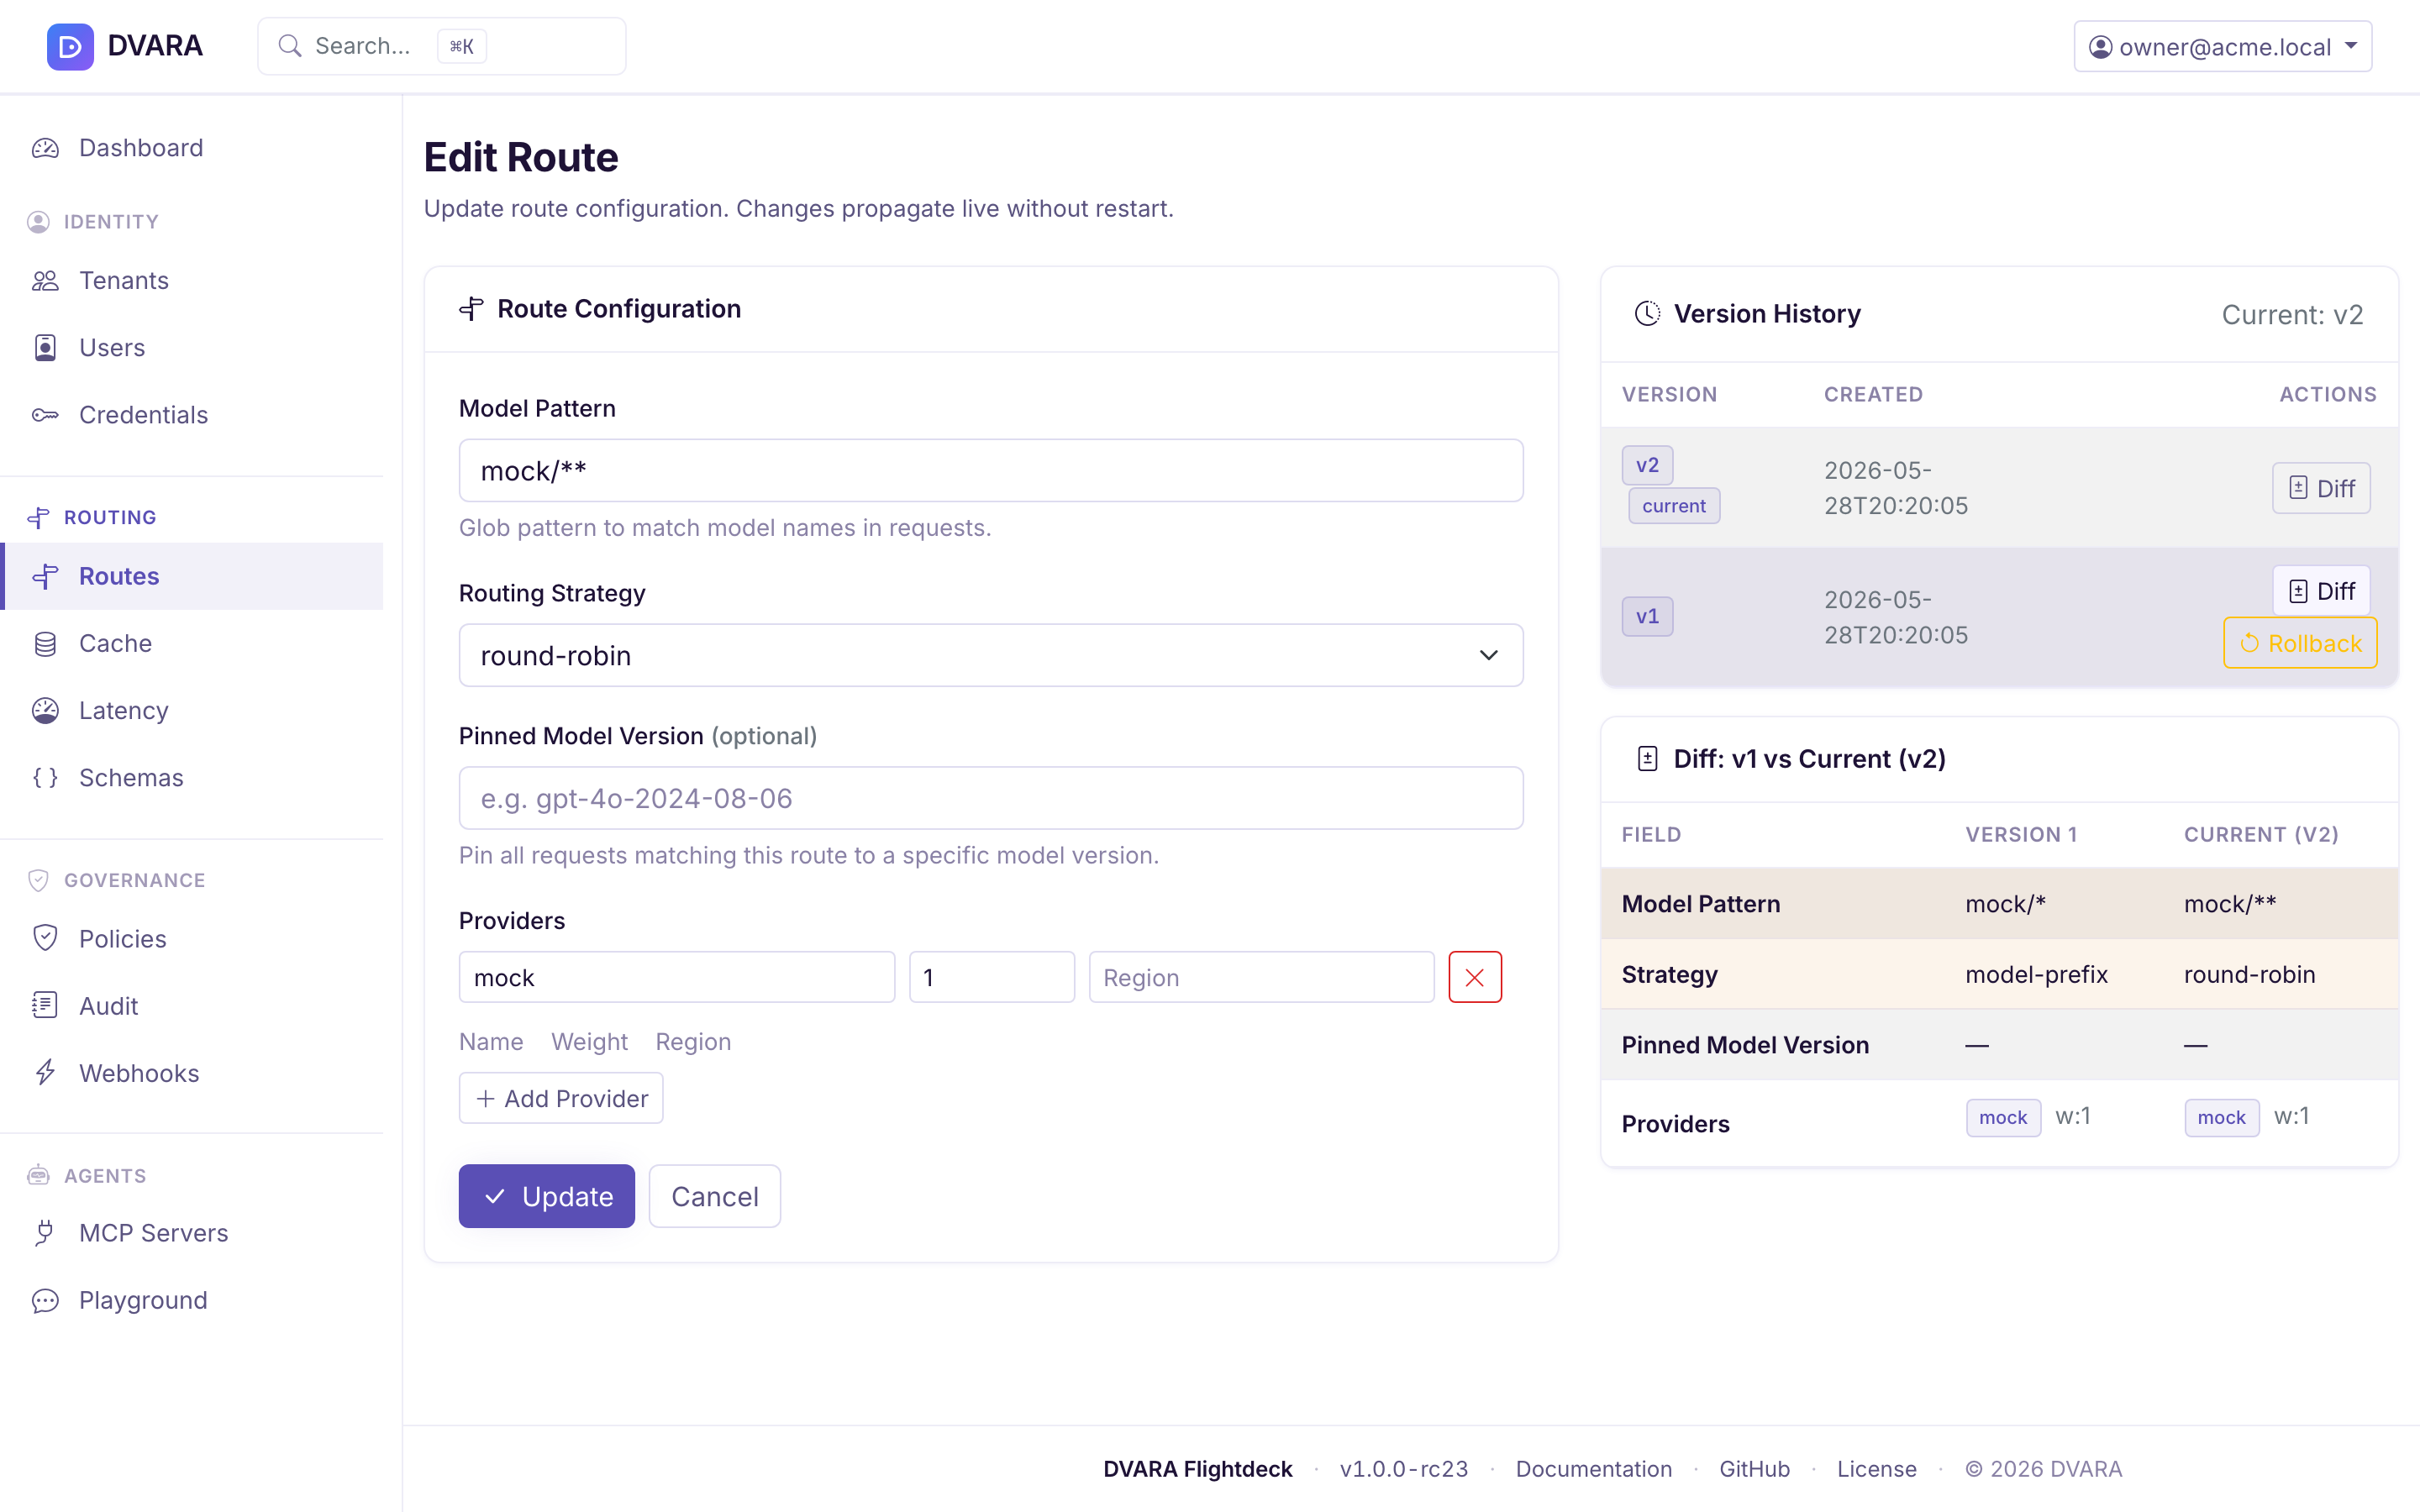
Create / edit route
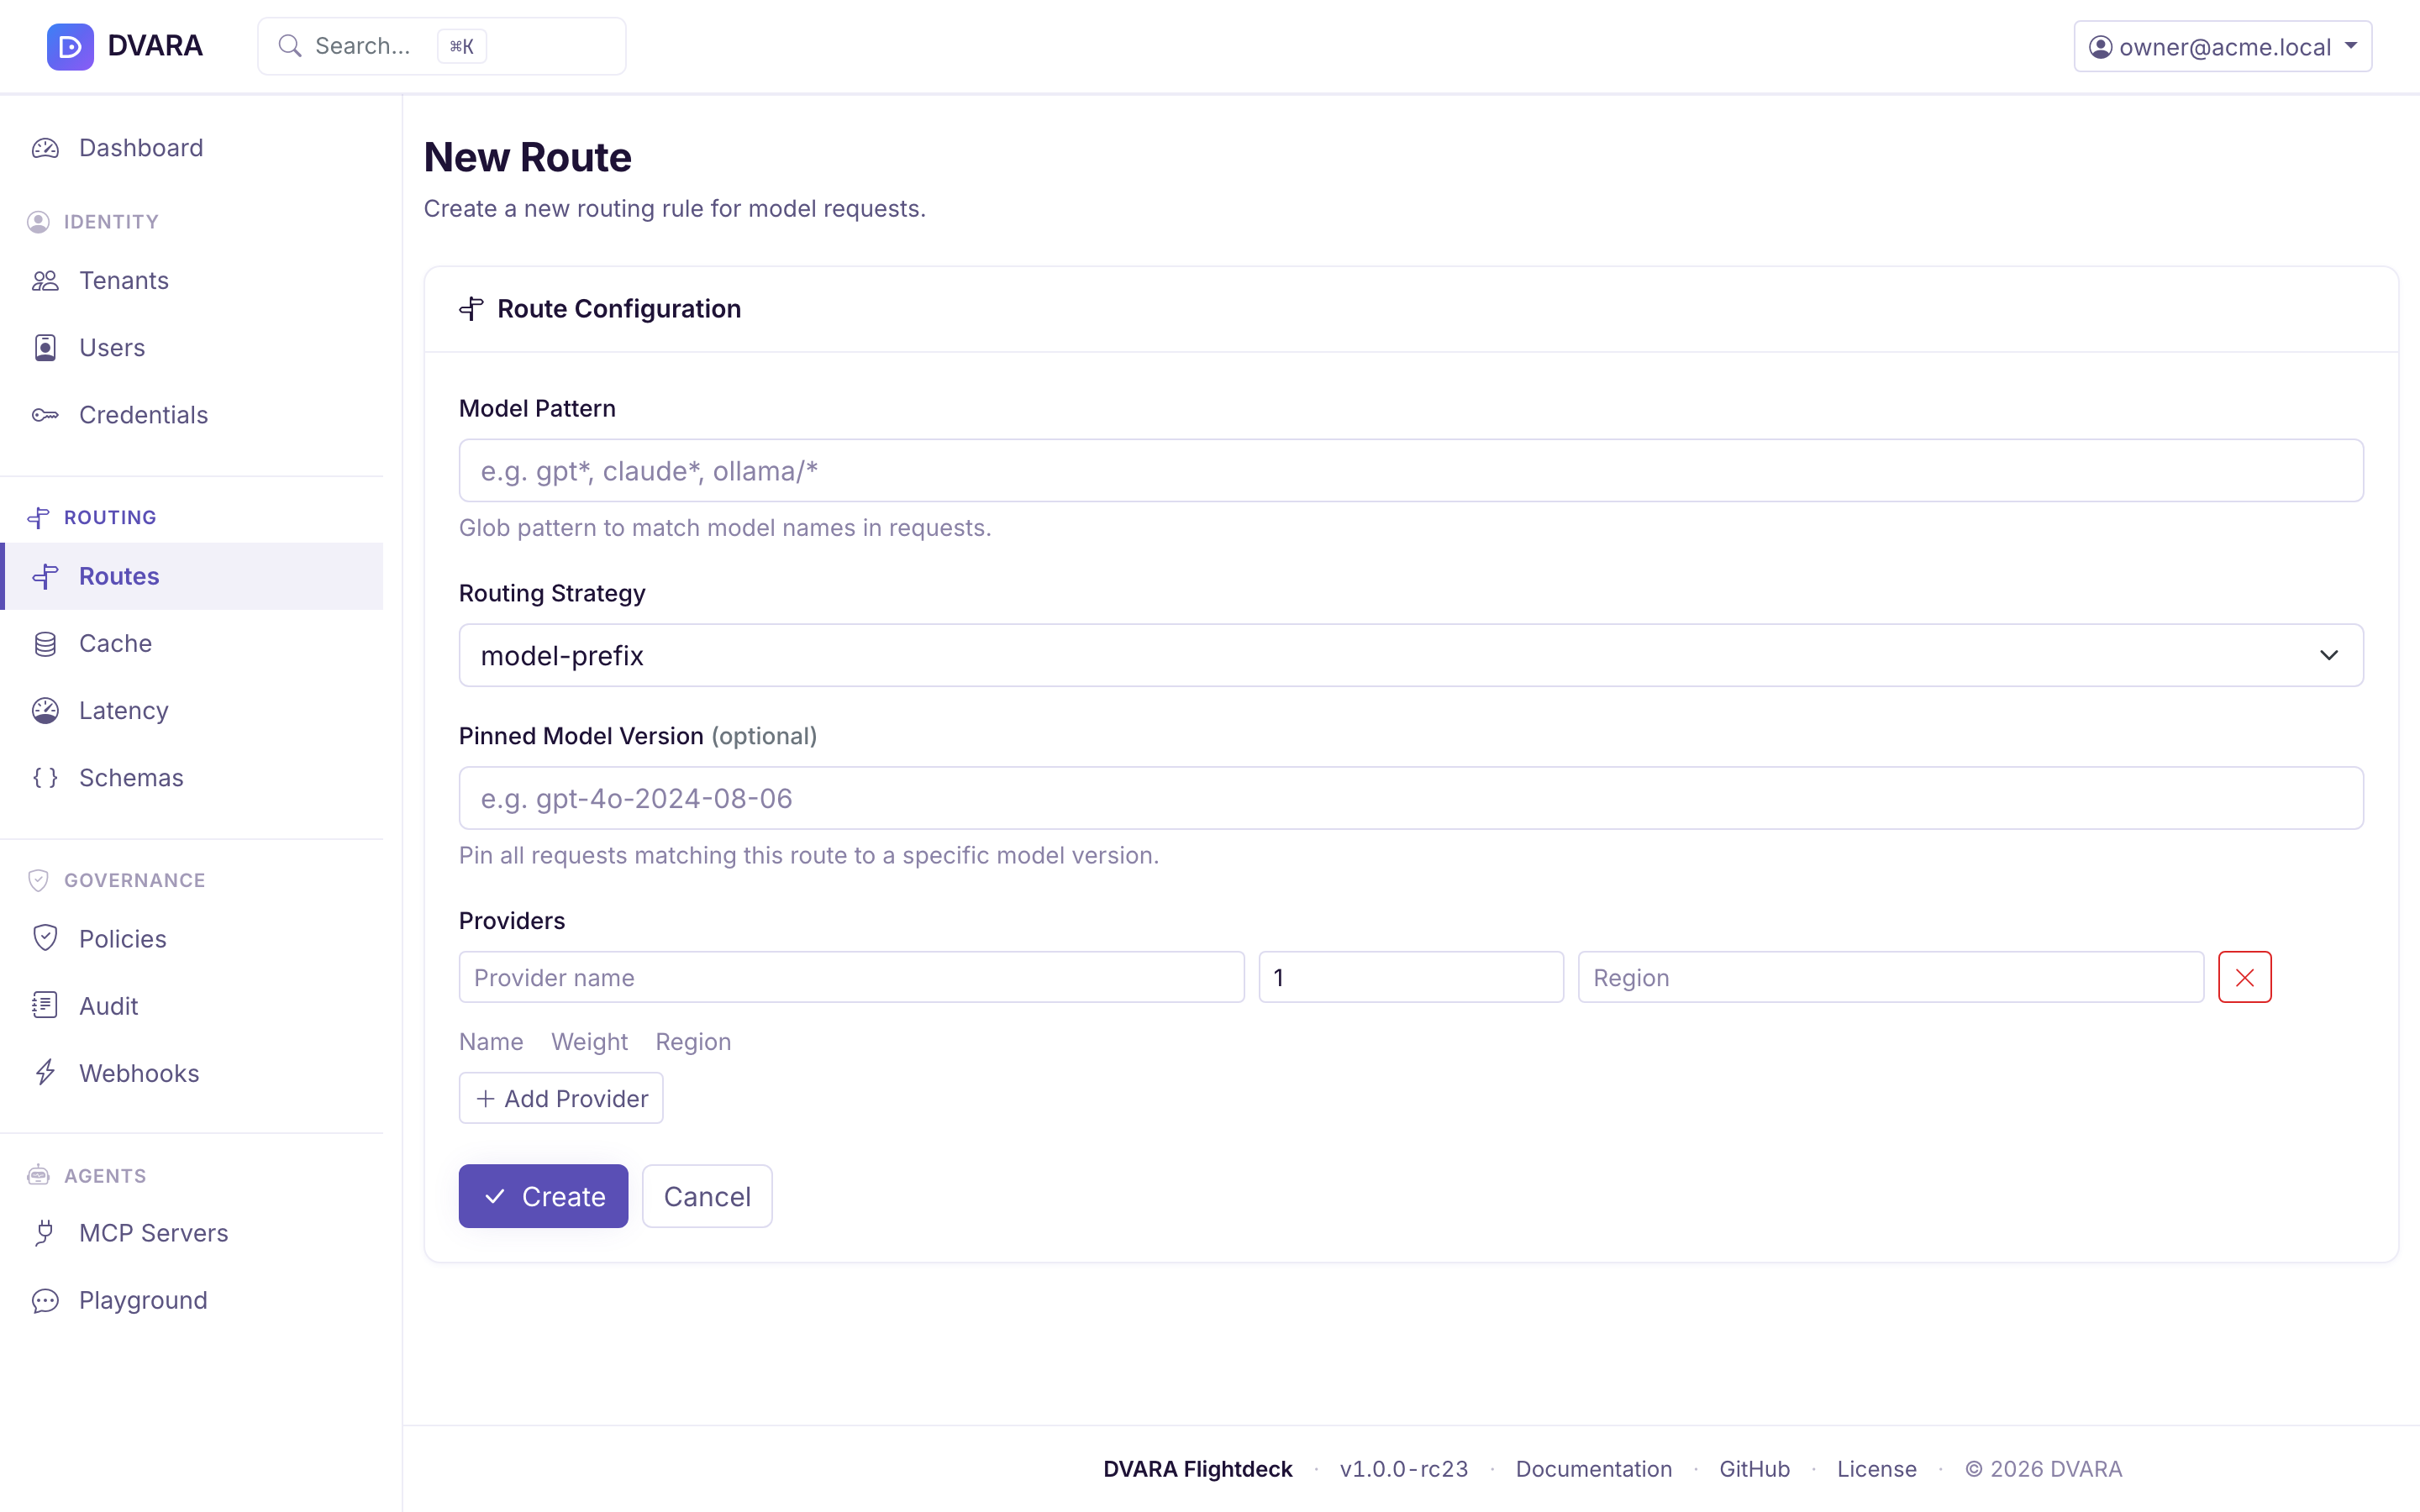
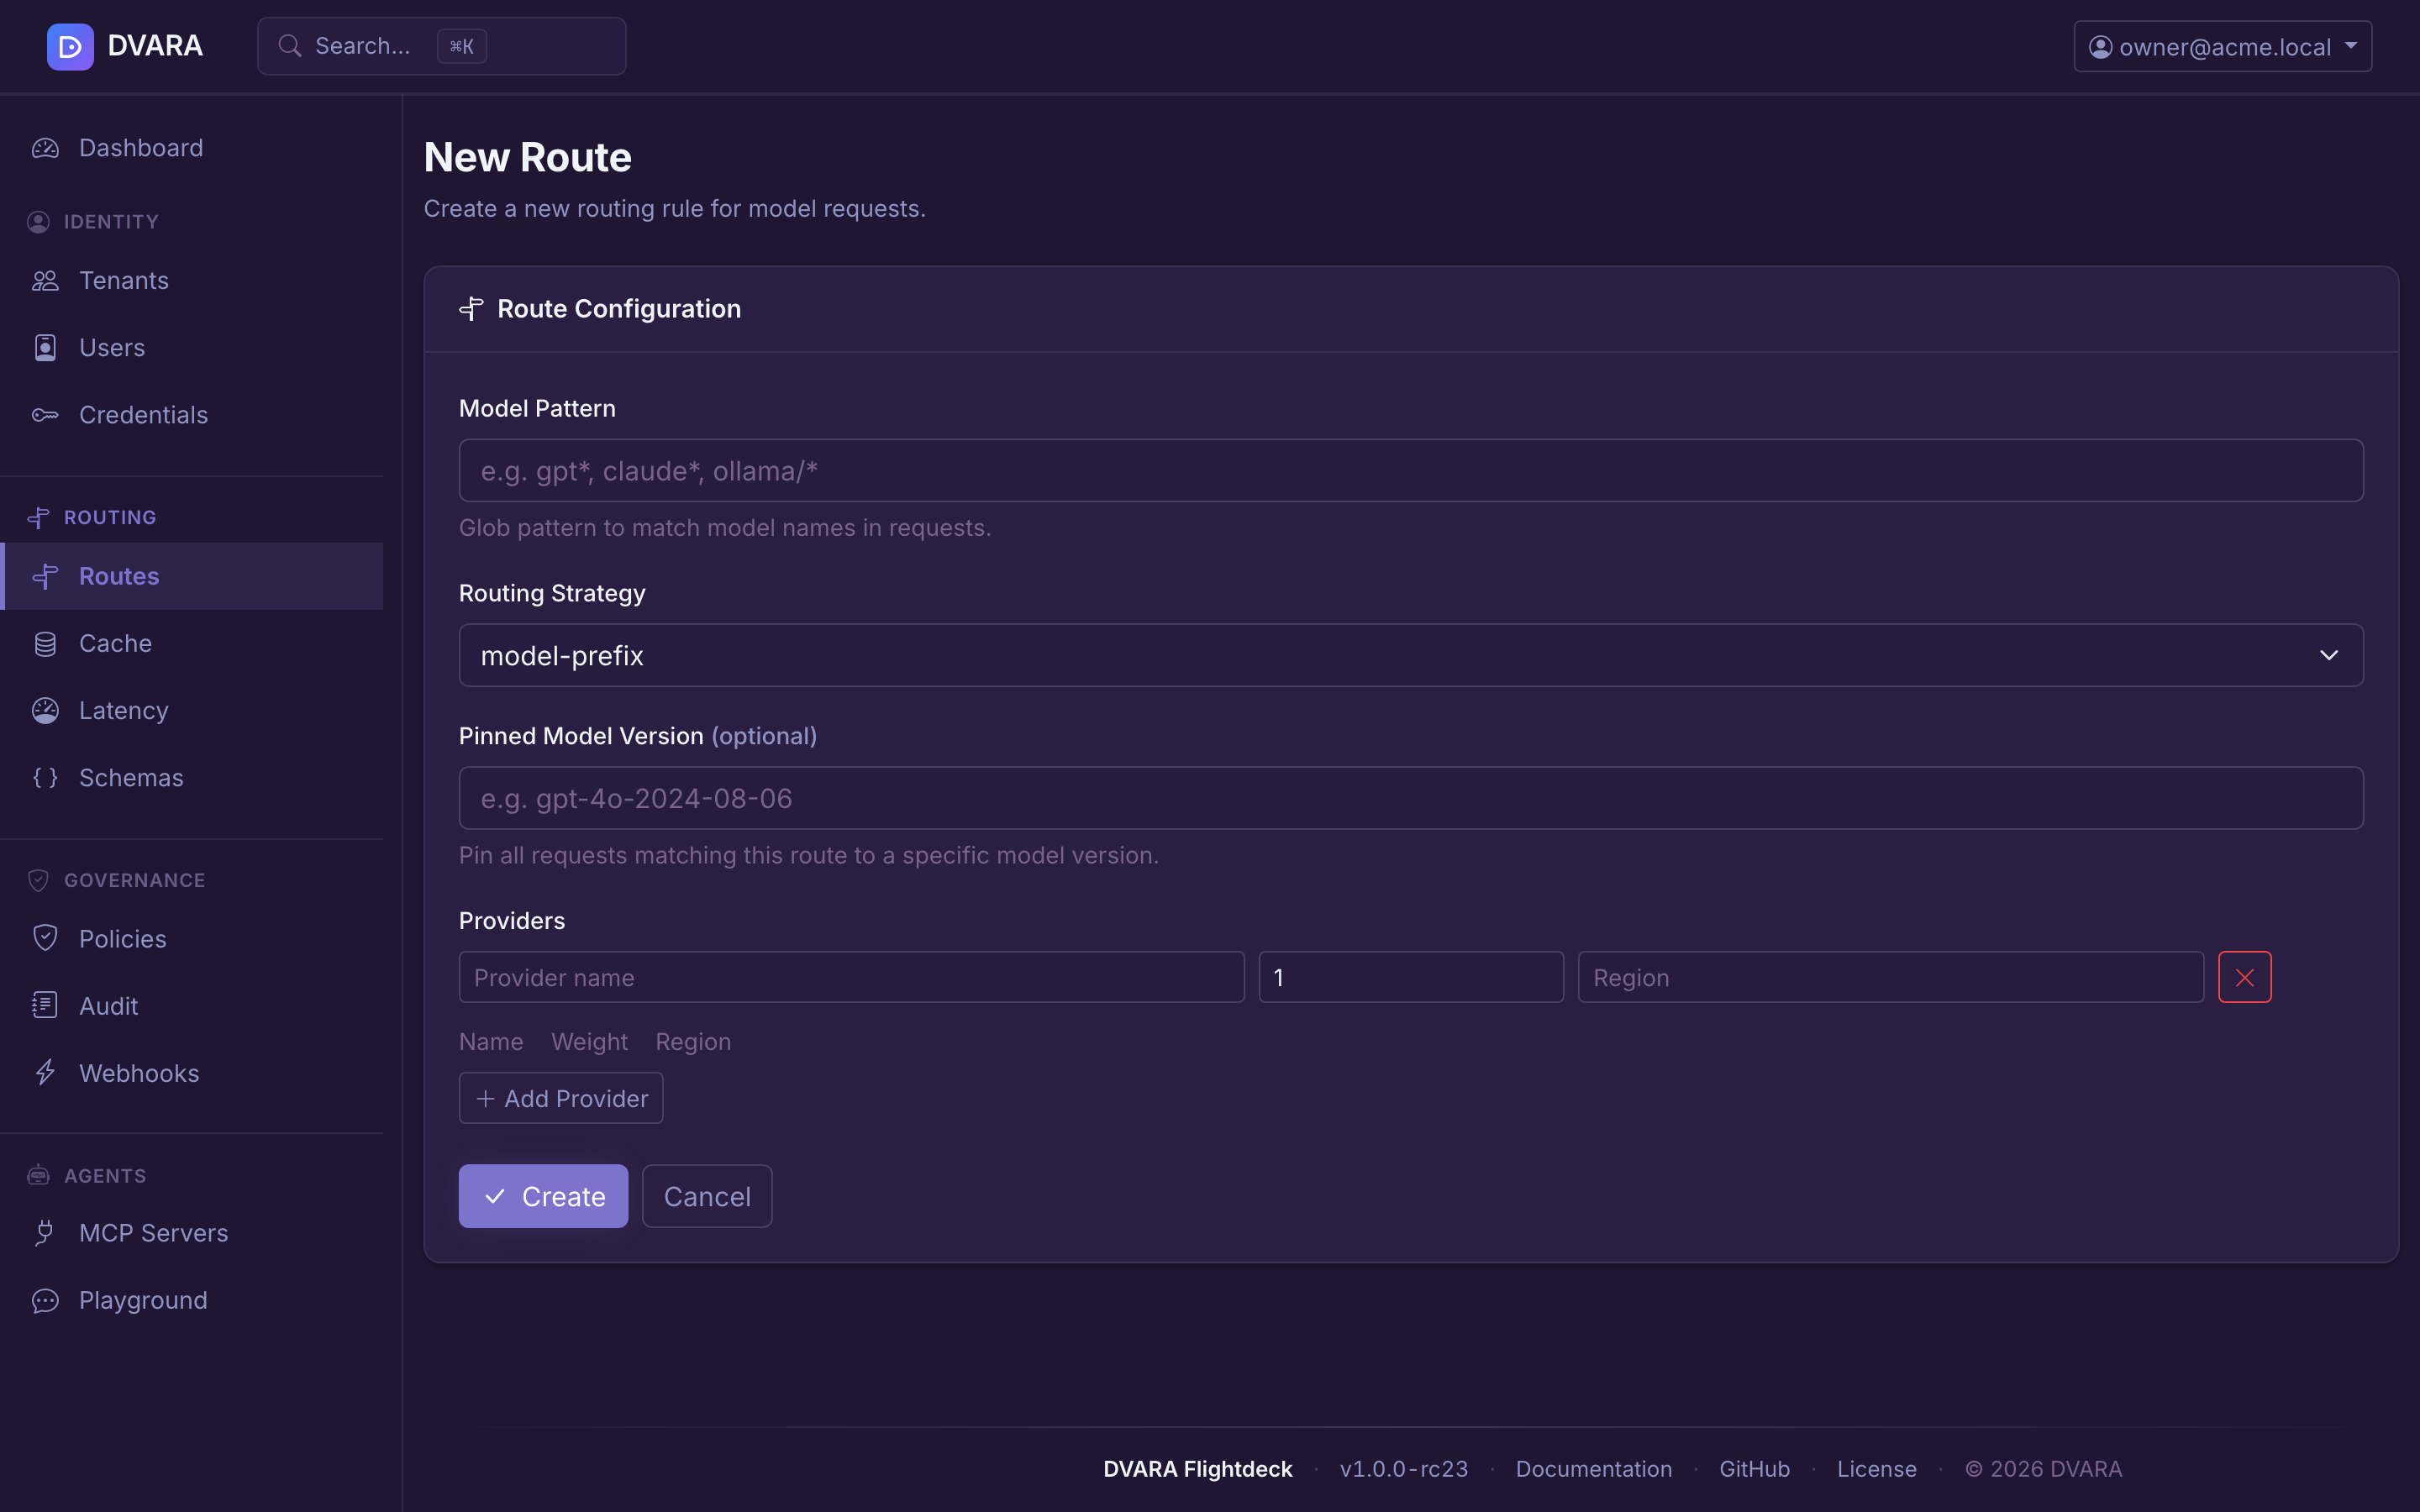
Click New Route to create a route with:
- Model Pattern — glob pattern to match model names (e.g.
gpt*,claude*,ollama/*) - Routing Strategy —
model-prefix,round-robin,weighted,latency-aware,cost-aware,canary,geo-aware,intelligent - Pinned Model Version — optional, pins requests to a specific model version
- Providers — dynamic table of provider entries with name, weight, and region. Add / remove rows as needed.
Changes propagate to every gateway instance within a few seconds — no restart and no deployment required. Routes are platform-global (no tenant scope); policies, by contrast, are tenant-scoped or global (blank tenant = global).
Every route mutation (ROUTE_CREATED / _UPDATED / _ROLLED_BACK / _DELETED) and policy mutation (POLICY_CREATED / _UPDATED / _STATUS_CHANGED / _ROLLED_BACK / _PROMOTED / _DELETED) emits a signed audit event — from the Console UI, the Automation API, and the tenant Portal (policies only).
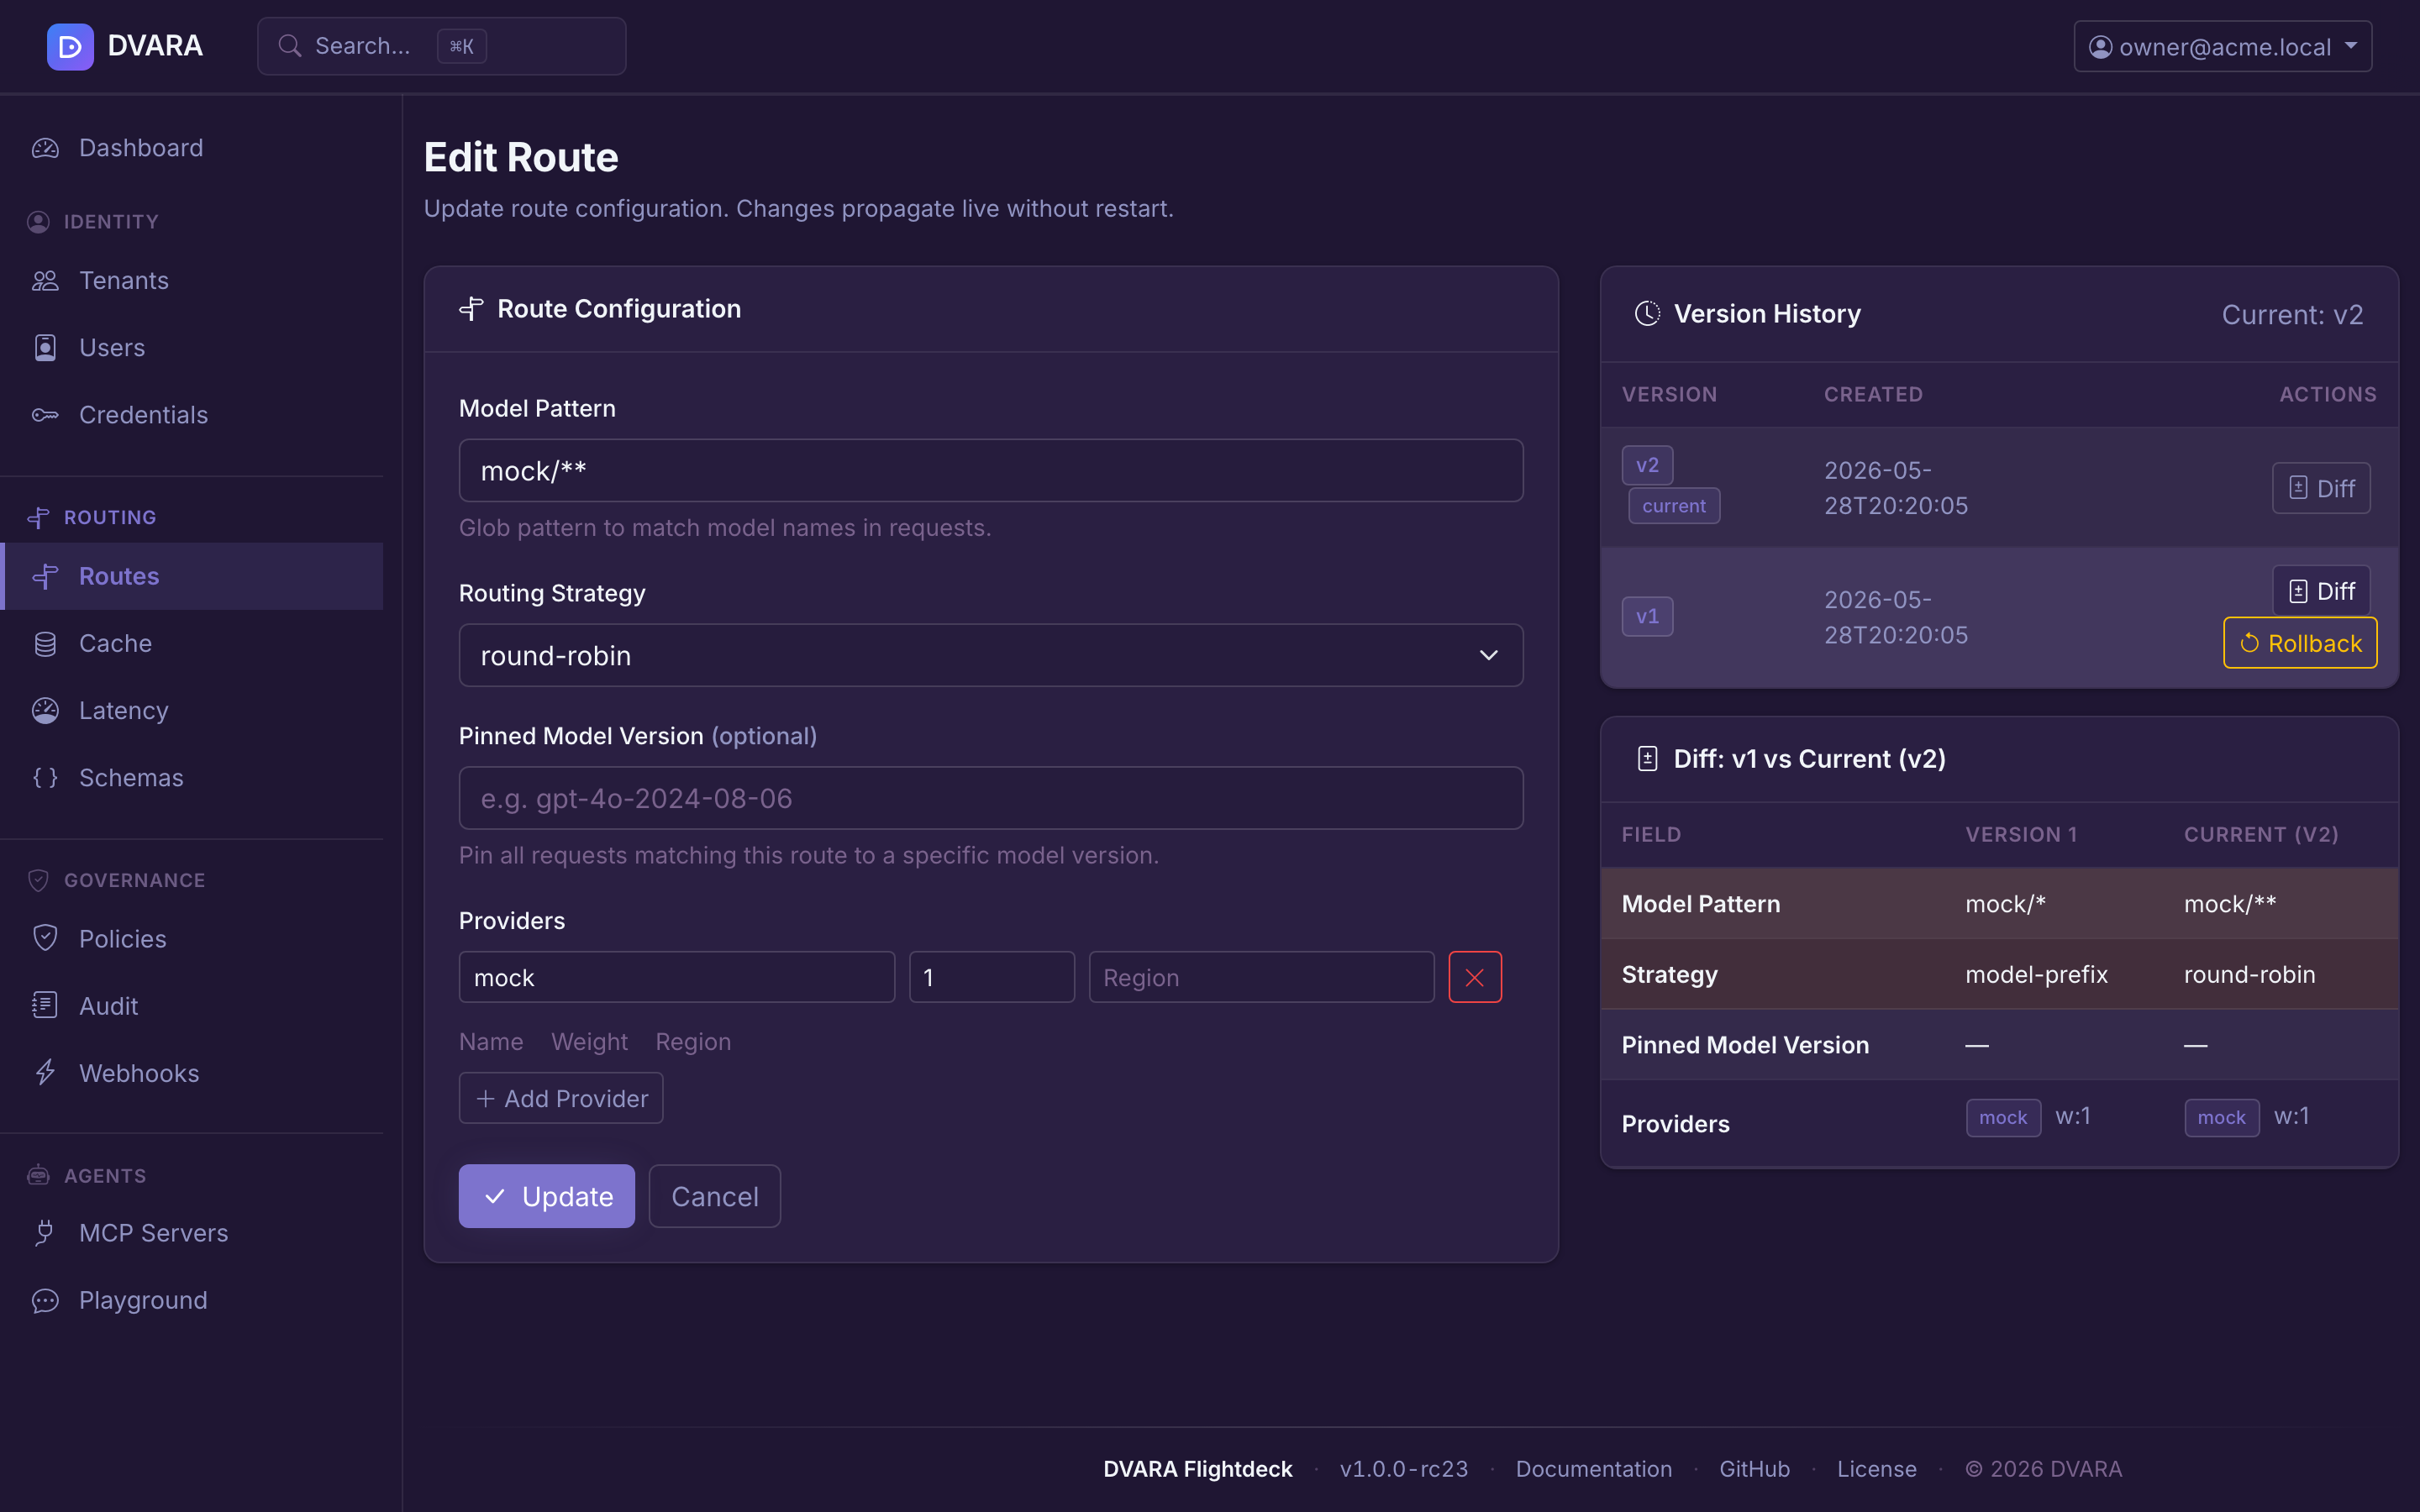
Version history
In edit mode, the right panel shows the route's version history (last 10 retained). Each version has two actions:
- Diff — loads a field-by-field comparison between the selected version and the current configuration. Changed fields are highlighted with an amber background.
- Rollback — rolls back the route to the selected version (creates a new version with the restored configuration). Requires confirmation.
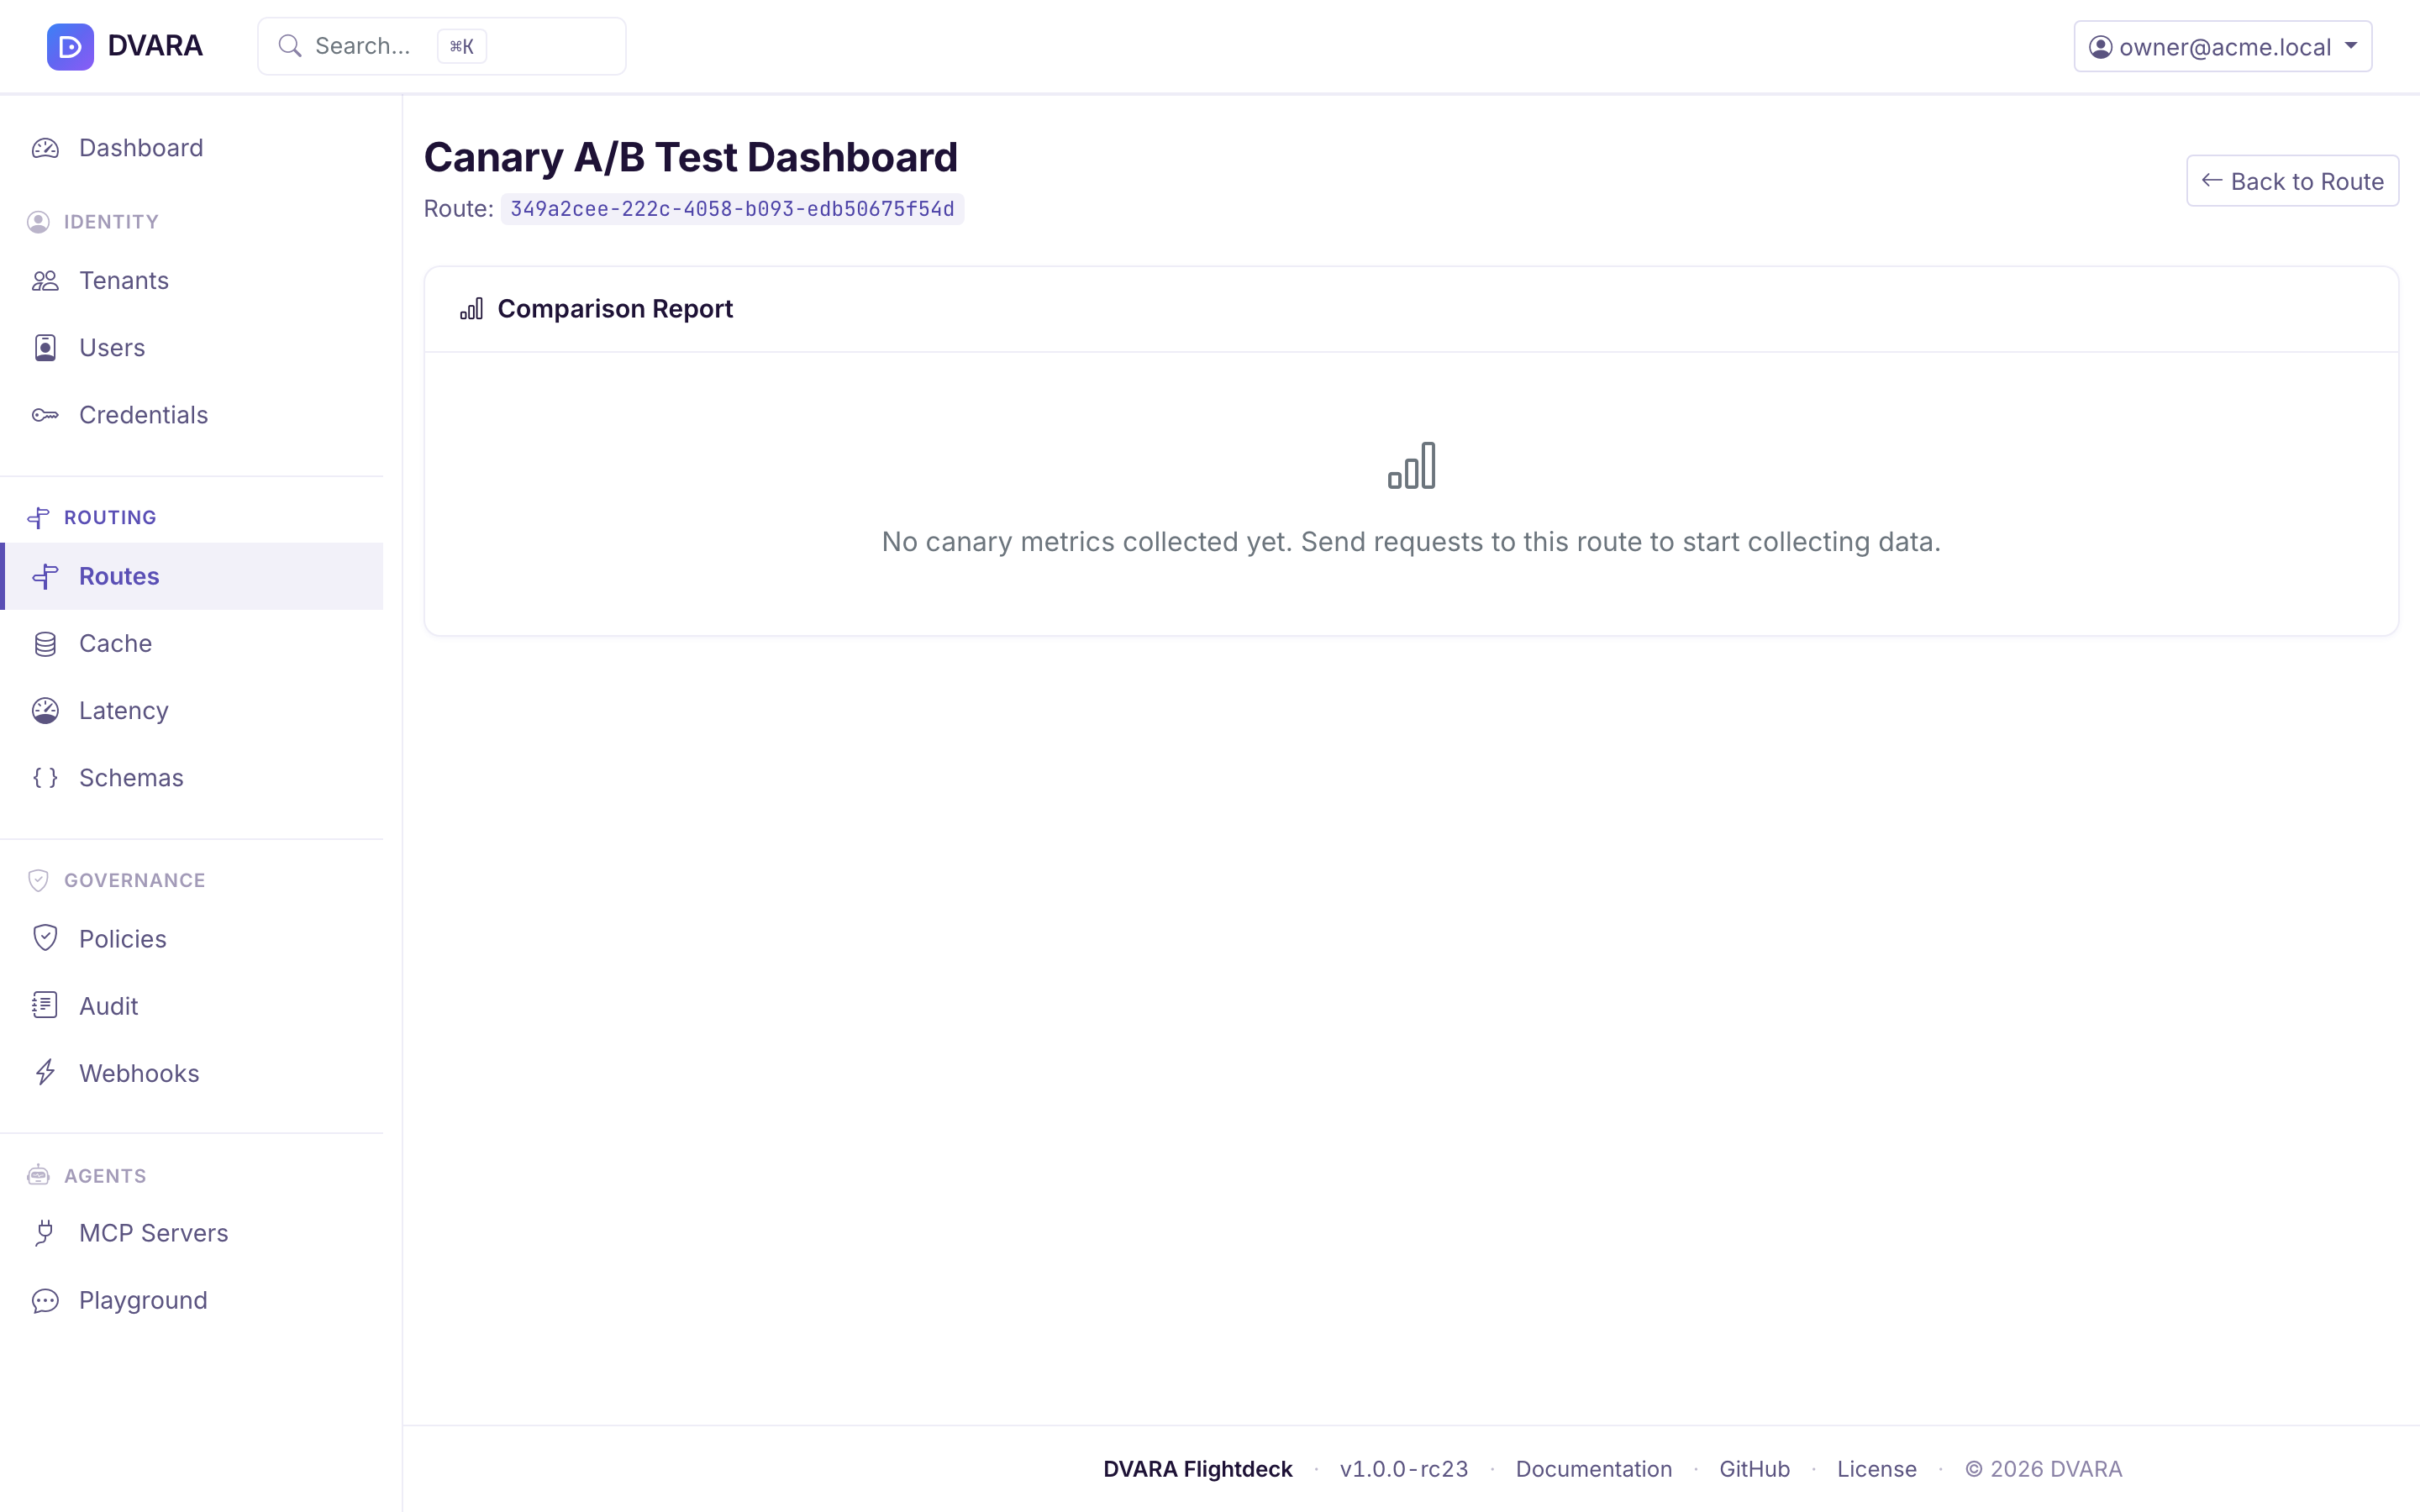
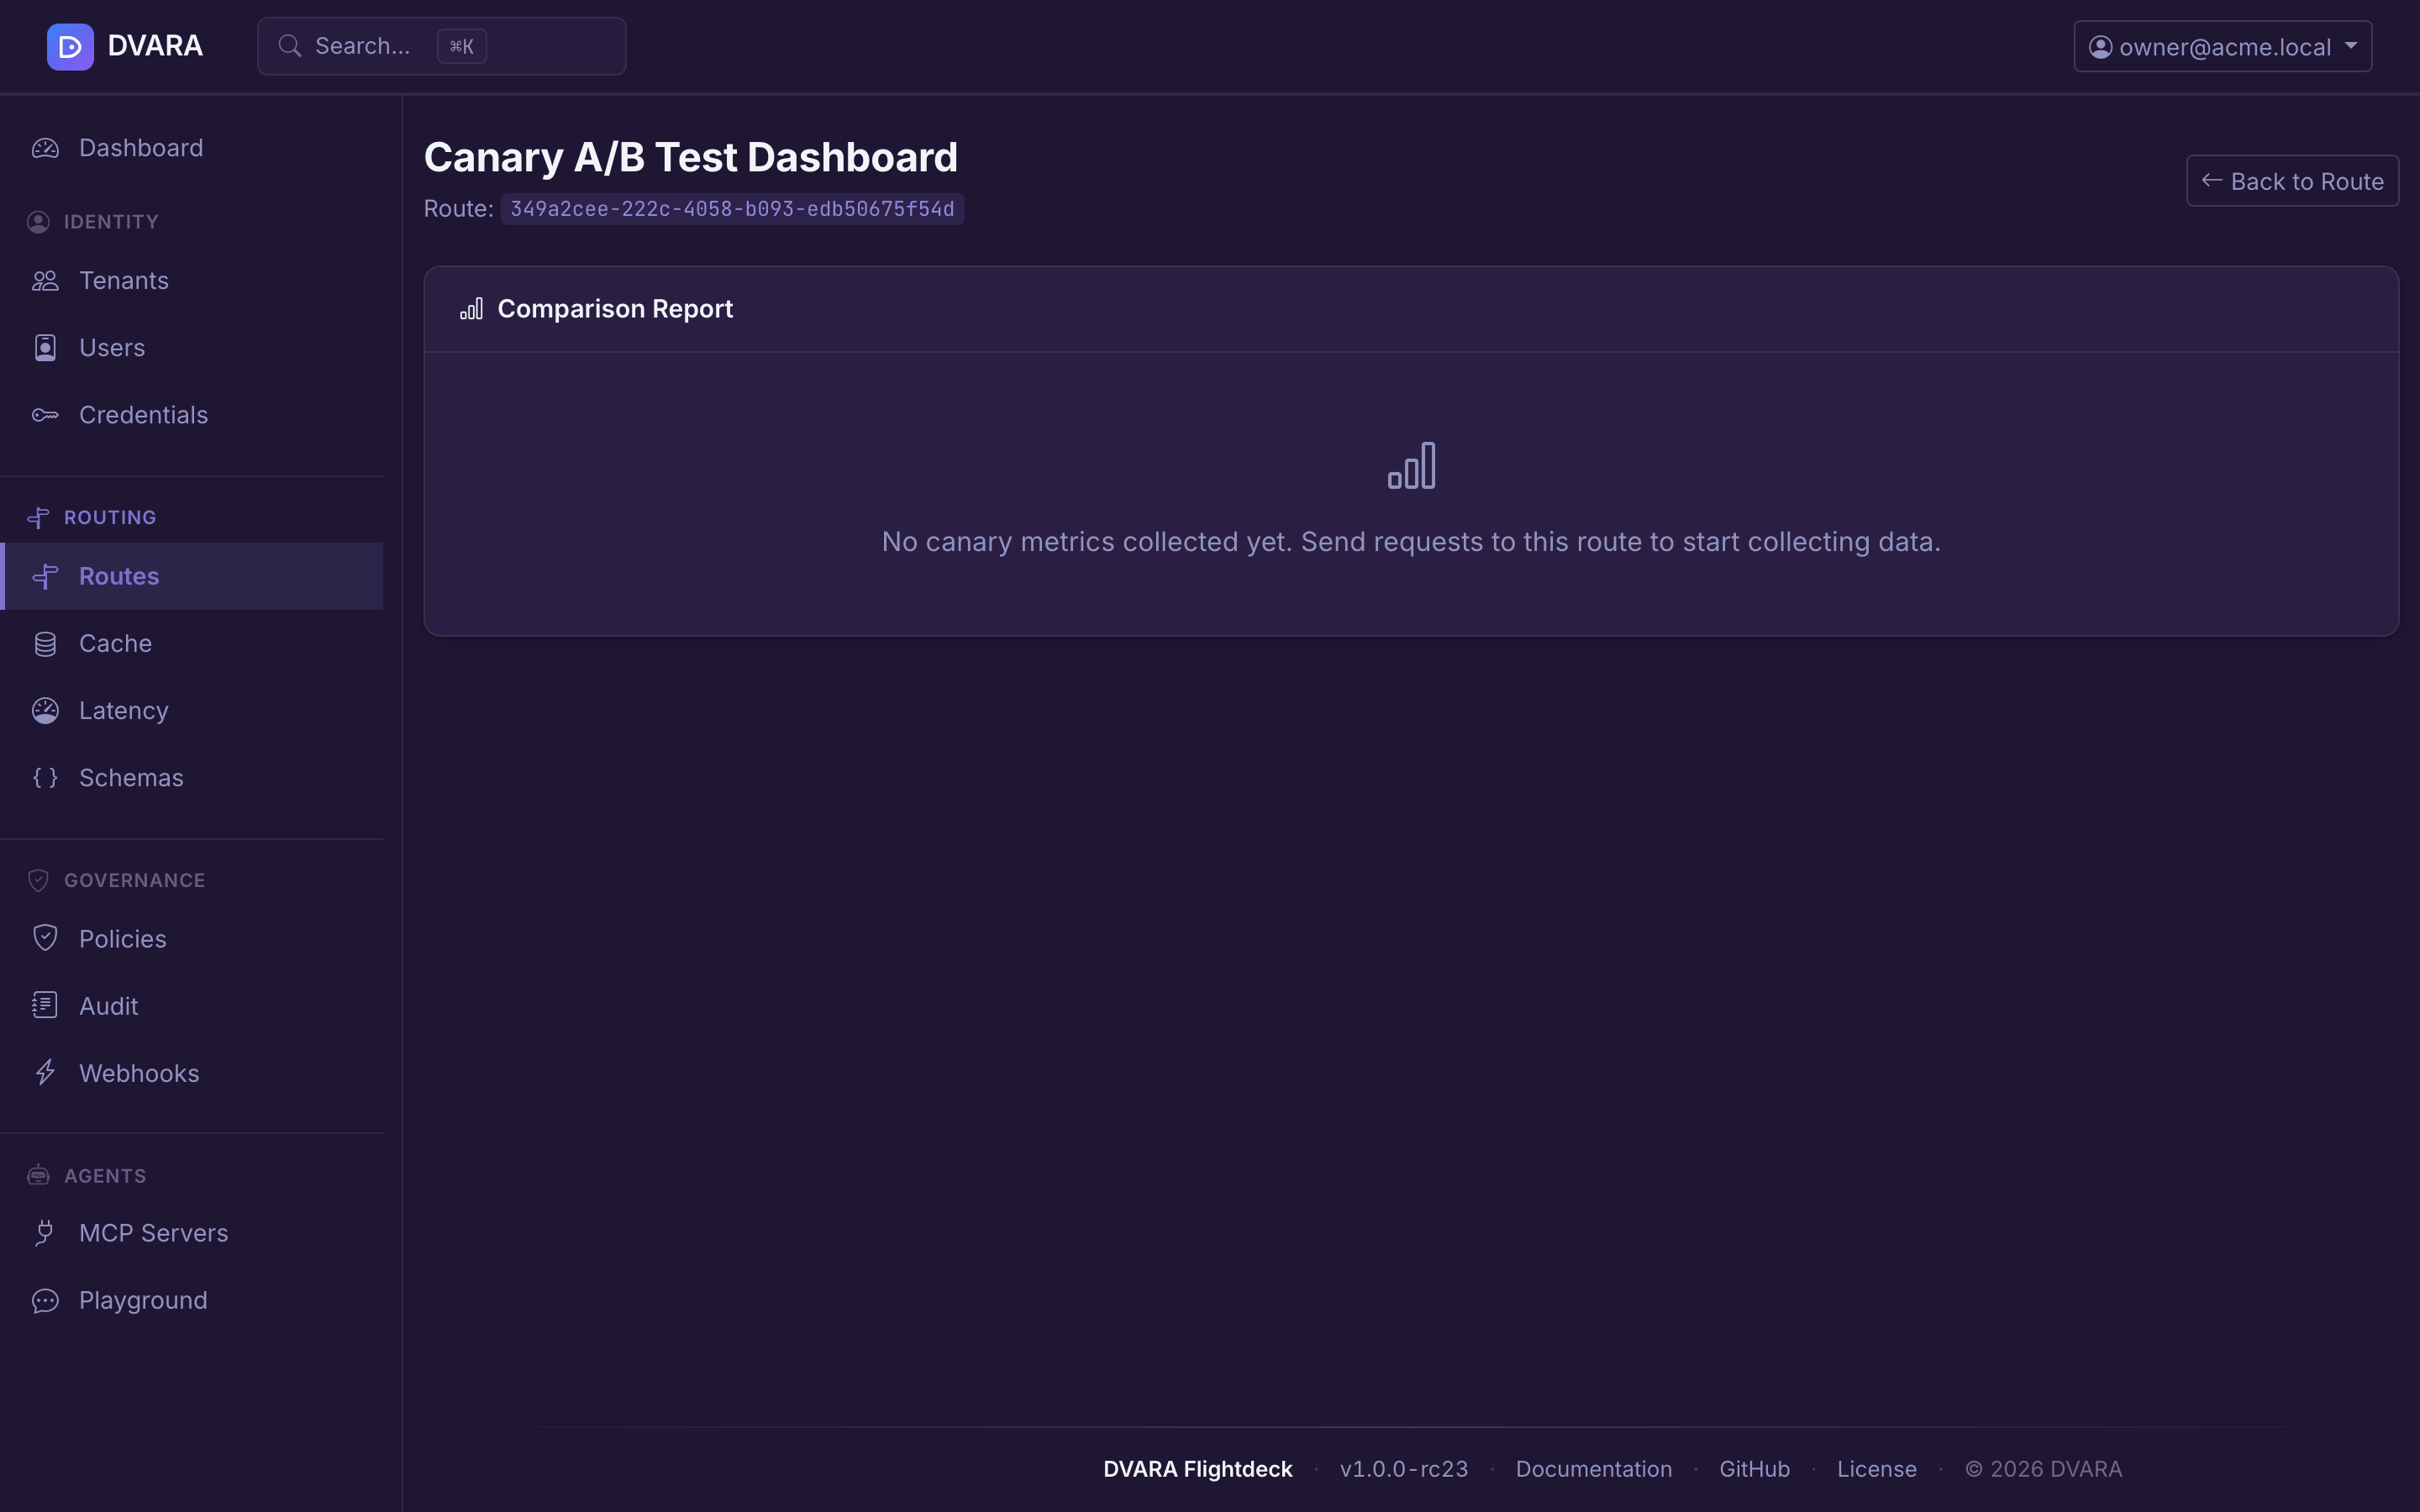
Canary A/B testing
When a route uses the canary strategy, a dedicated canary dashboard is available at Routes > (route) > Canary.
Dashboard features:
- Canary configuration — baseline provider, candidate provider, current split percentage, and tenant scope
- Live metrics (auto-refreshes every 5 seconds) — side-by-side comparison of baseline vs. candidate:
- Request count
- Error count and error rate
- Total and average latency
- Total and average cost
- Split adjustment — update the traffic split percentage on the live route without restarting
- Reset — clear all canary metrics and start fresh
Canary and shadow metrics are persisted and survive pod restarts, deployments, and autoscaling events. Counters are aggregated cluster-wide — the dashboard shows a single combined view across every gateway instance, not a per-pod slice. Deleting a route cleans up its live metrics automatically.
Policy management
Open Governance → Policies in the sidebar.
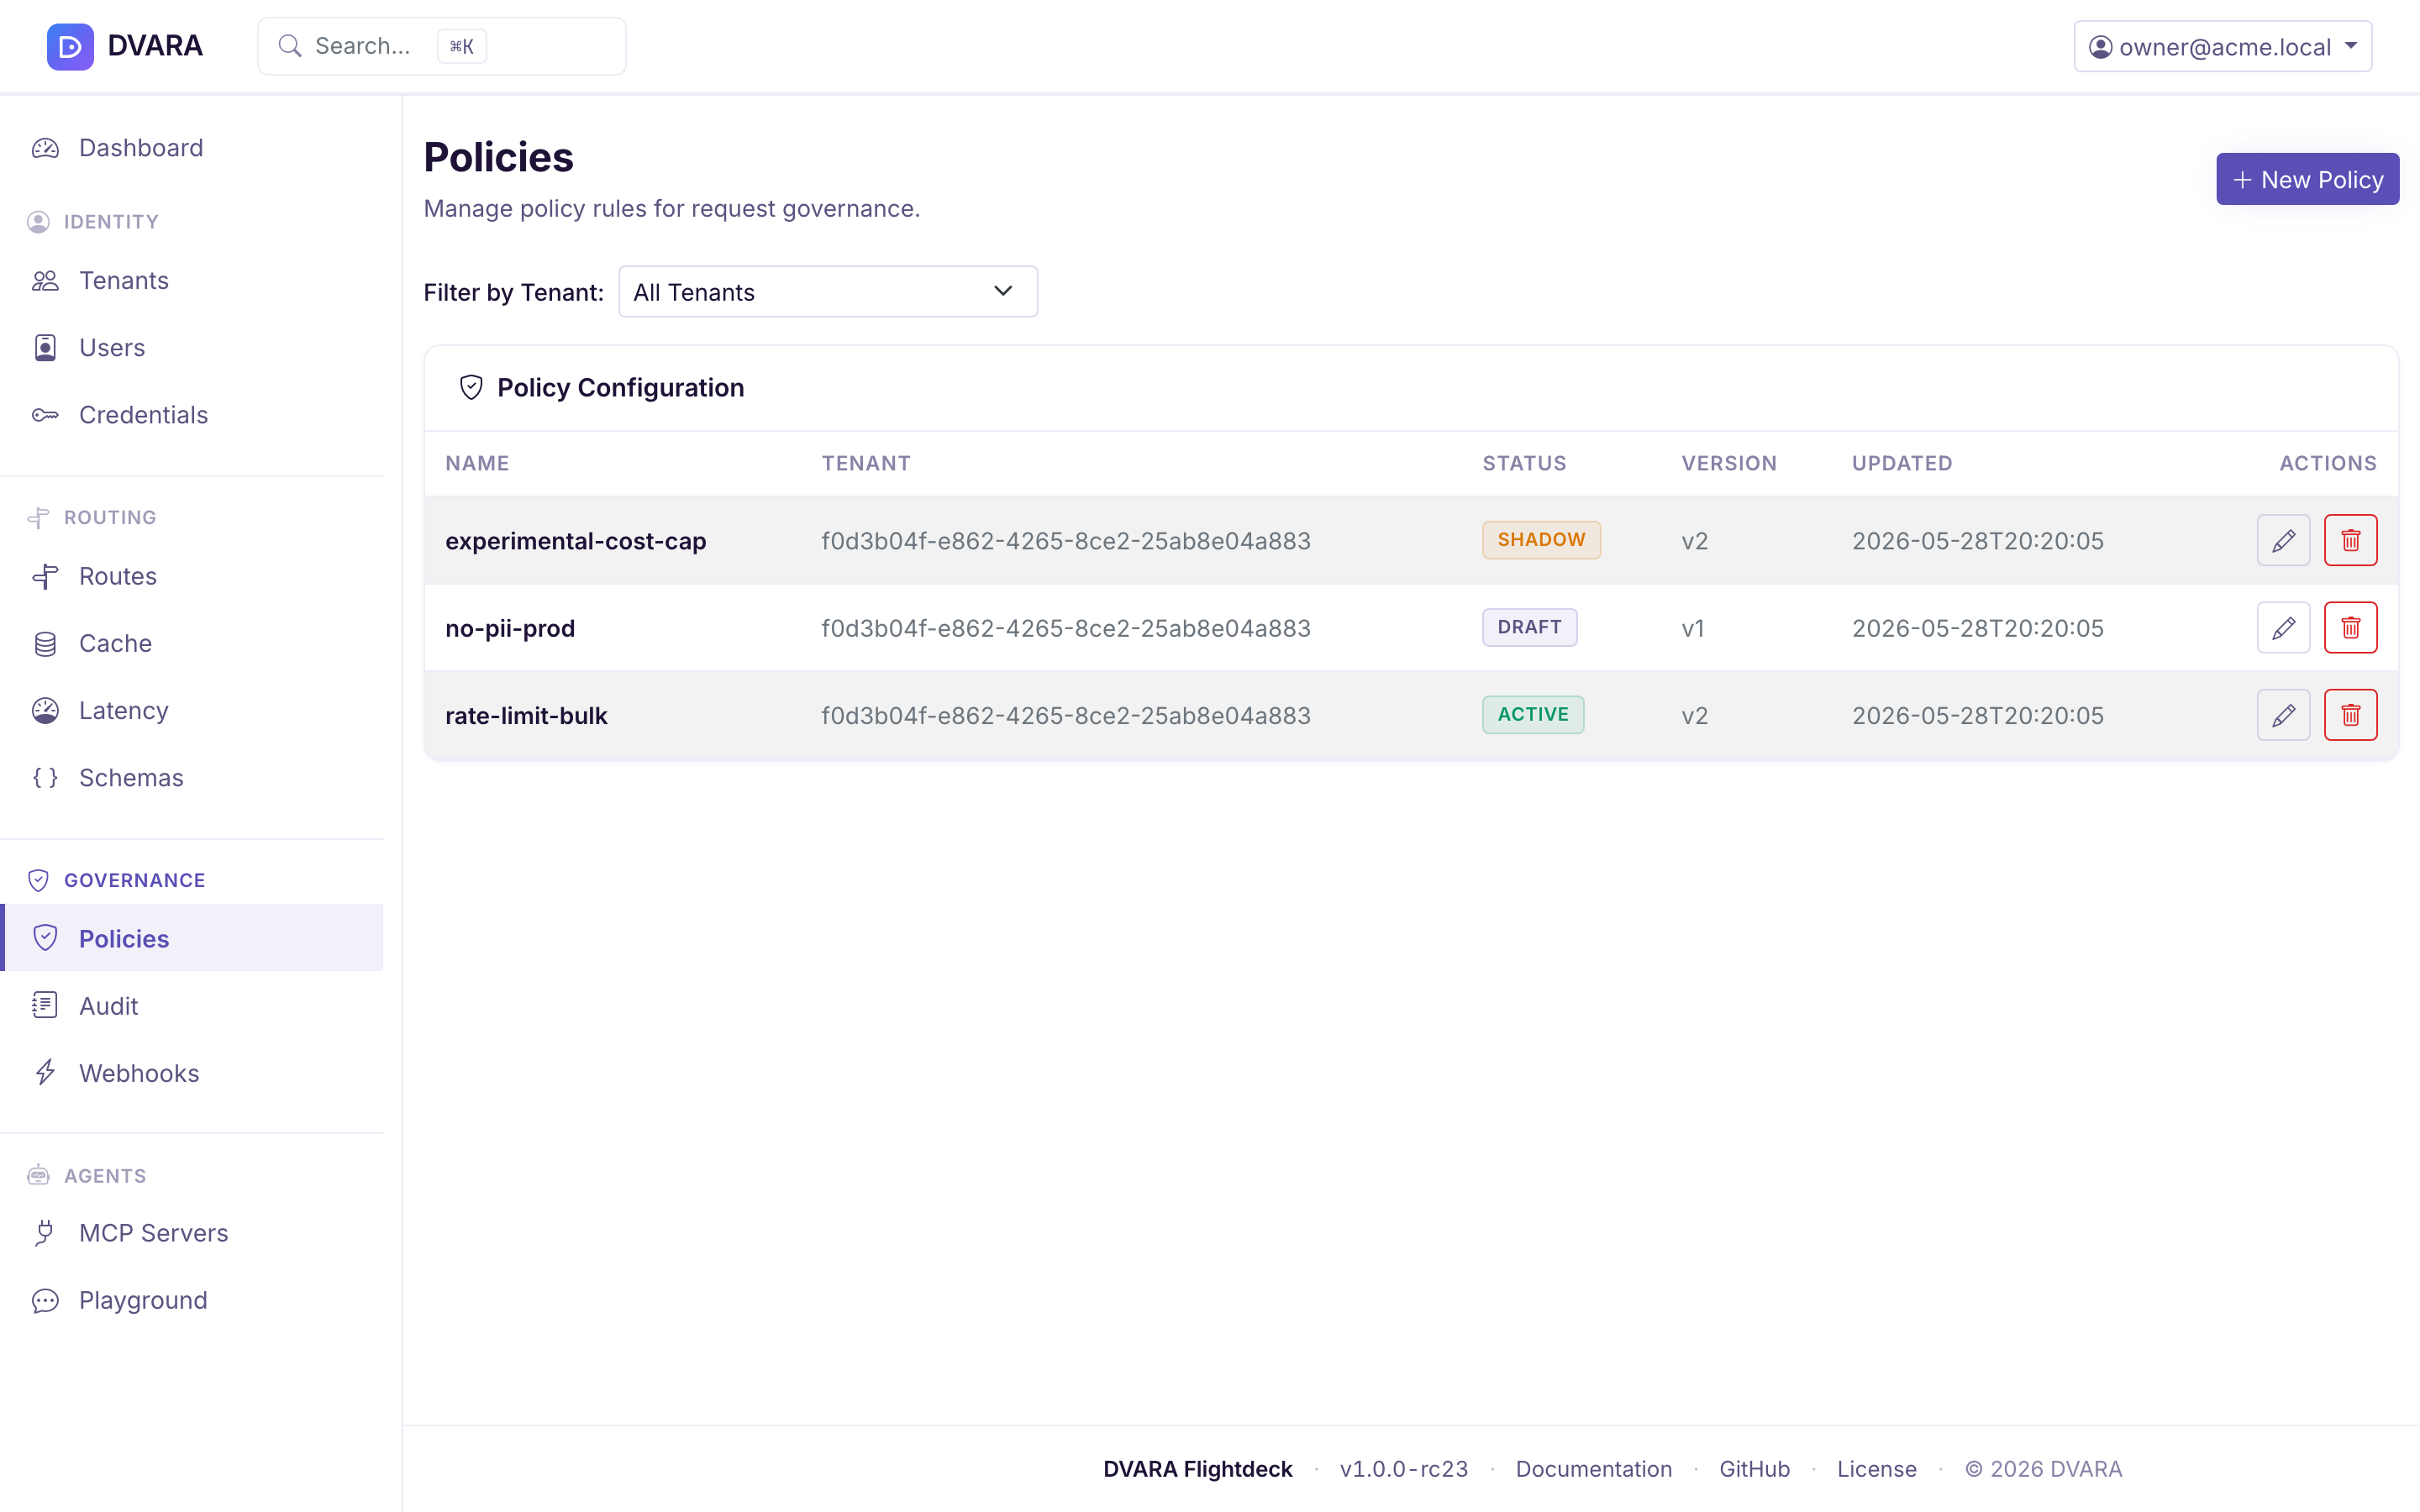
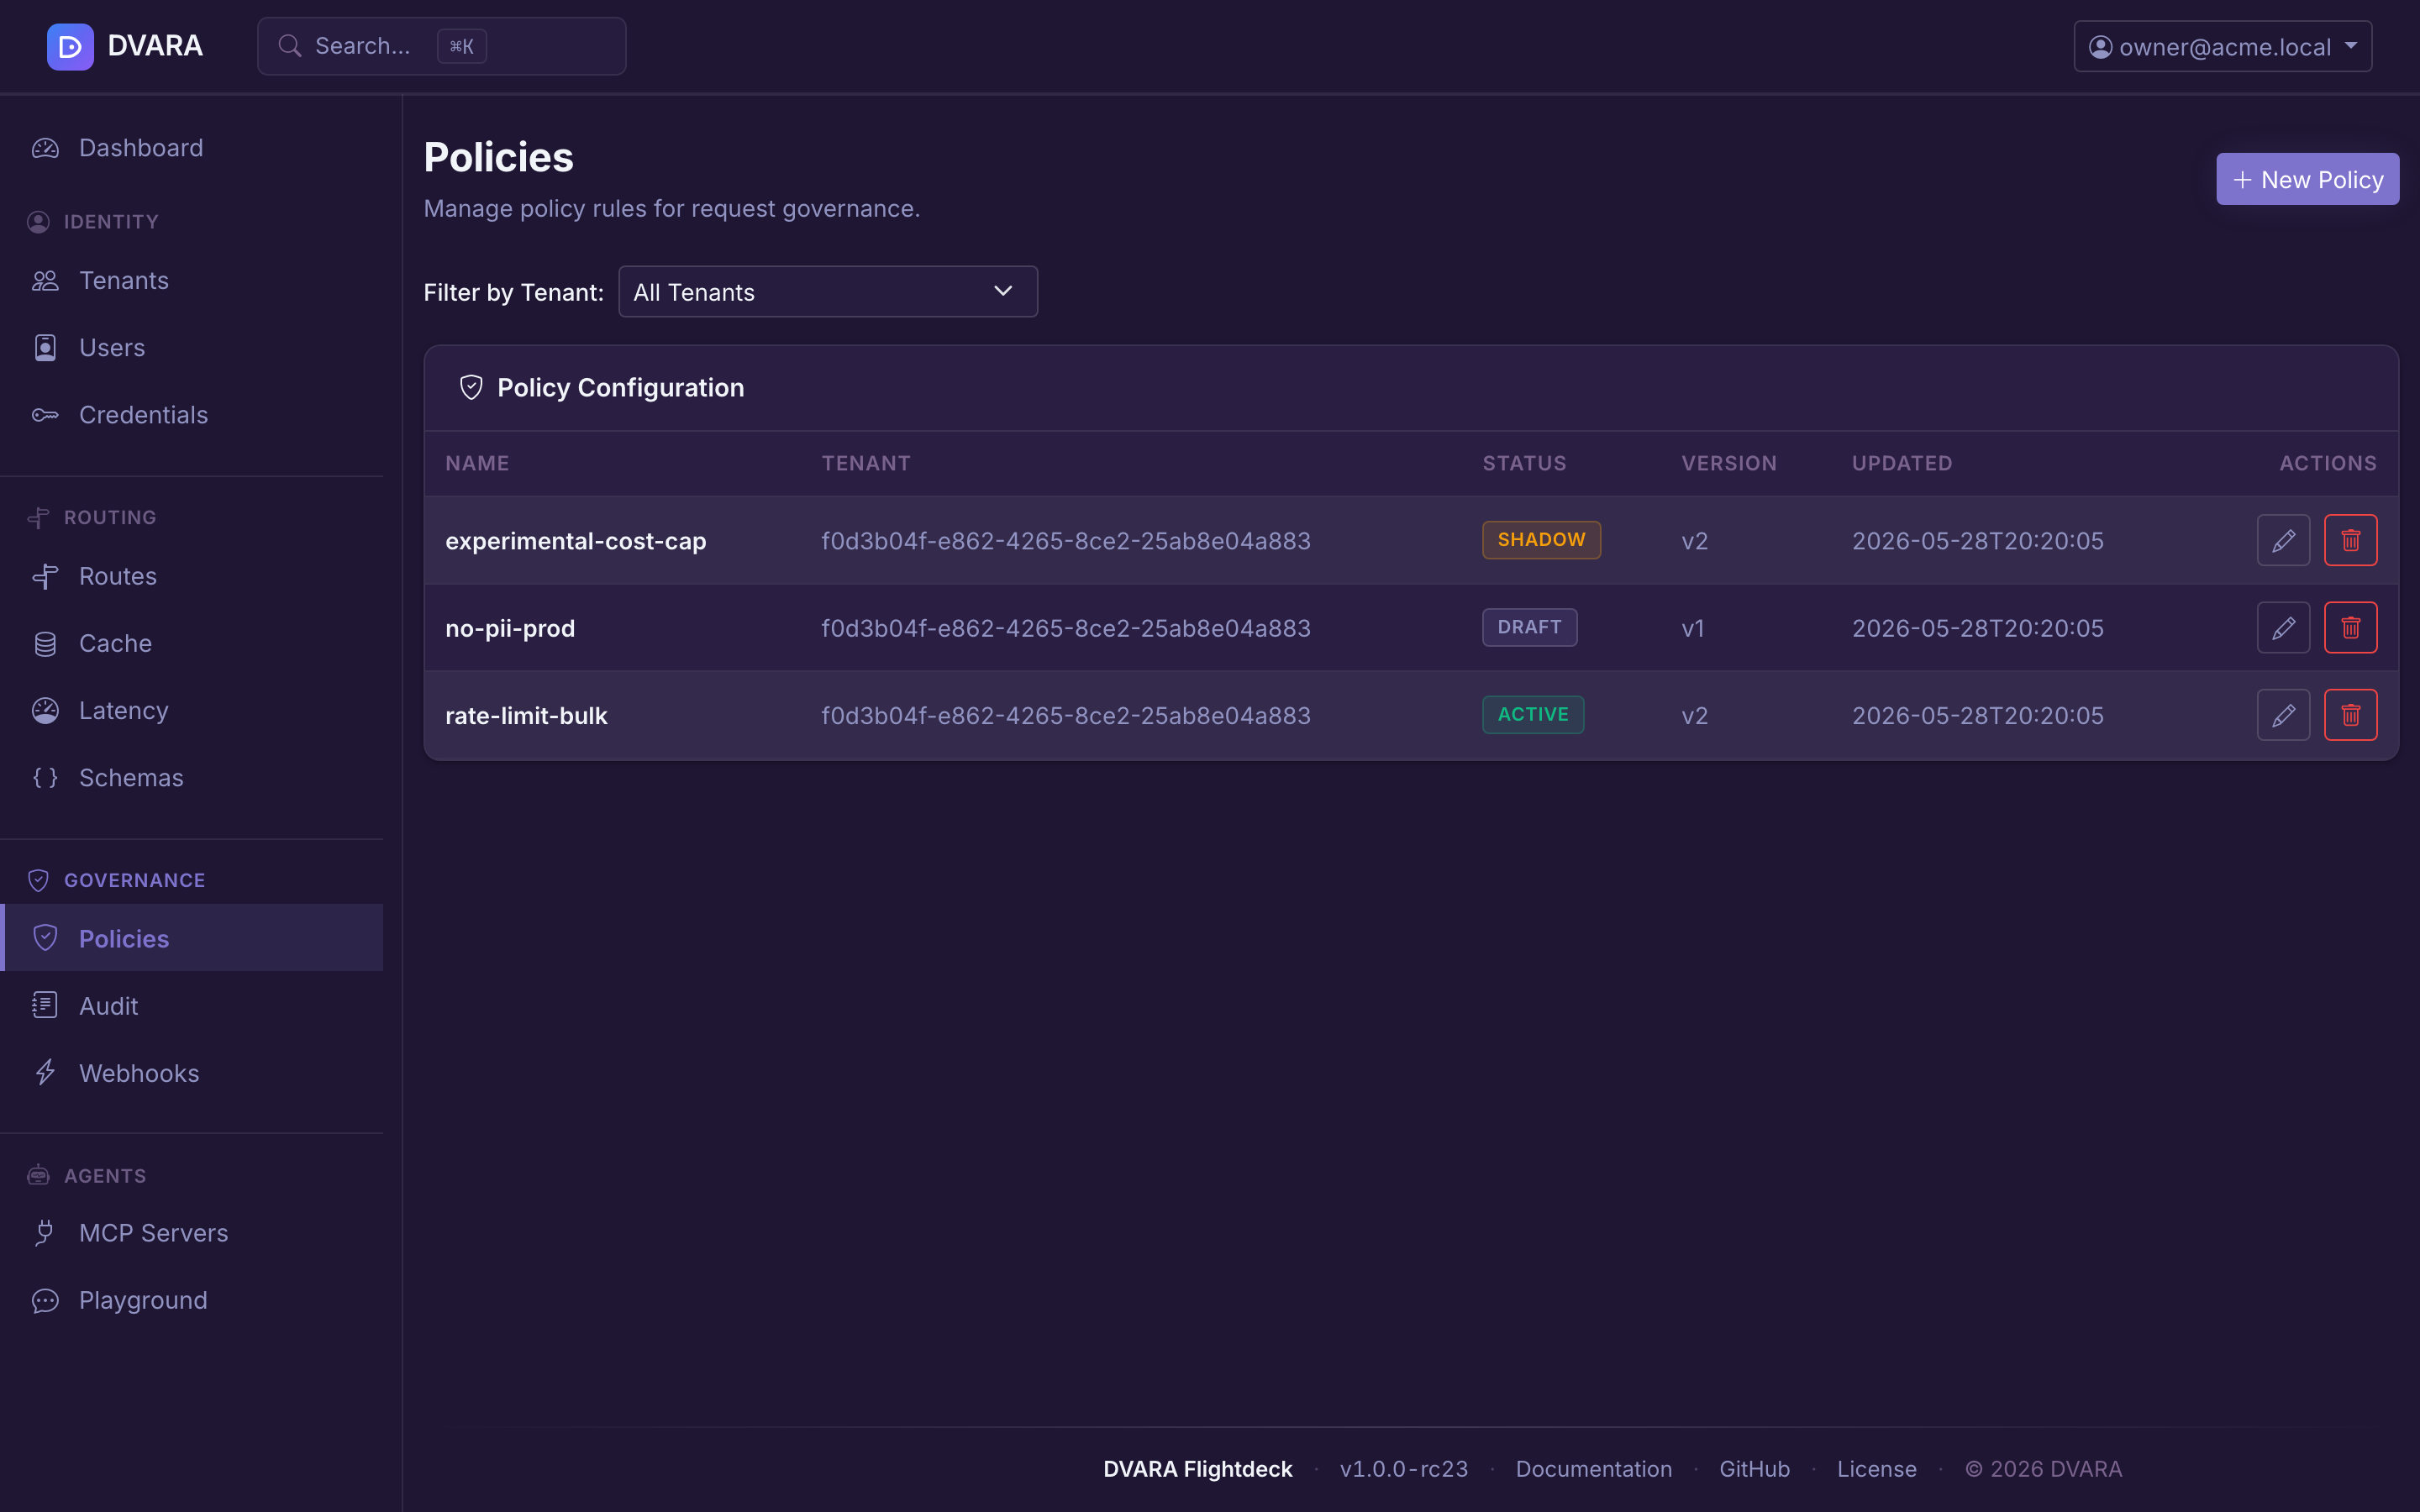
Policy list
Lists every policy with ID, name, tenant, status badge (DRAFT / ACTIVE / SHADOW / ARCHIVED), version, and last updated timestamp. Auto-refreshes every 10 seconds.
Use the Tenant dropdown filter to narrow the list. Status badges are color-coded: blue for DRAFT, green for ACTIVE, purple for SHADOW, grey for ARCHIVED.
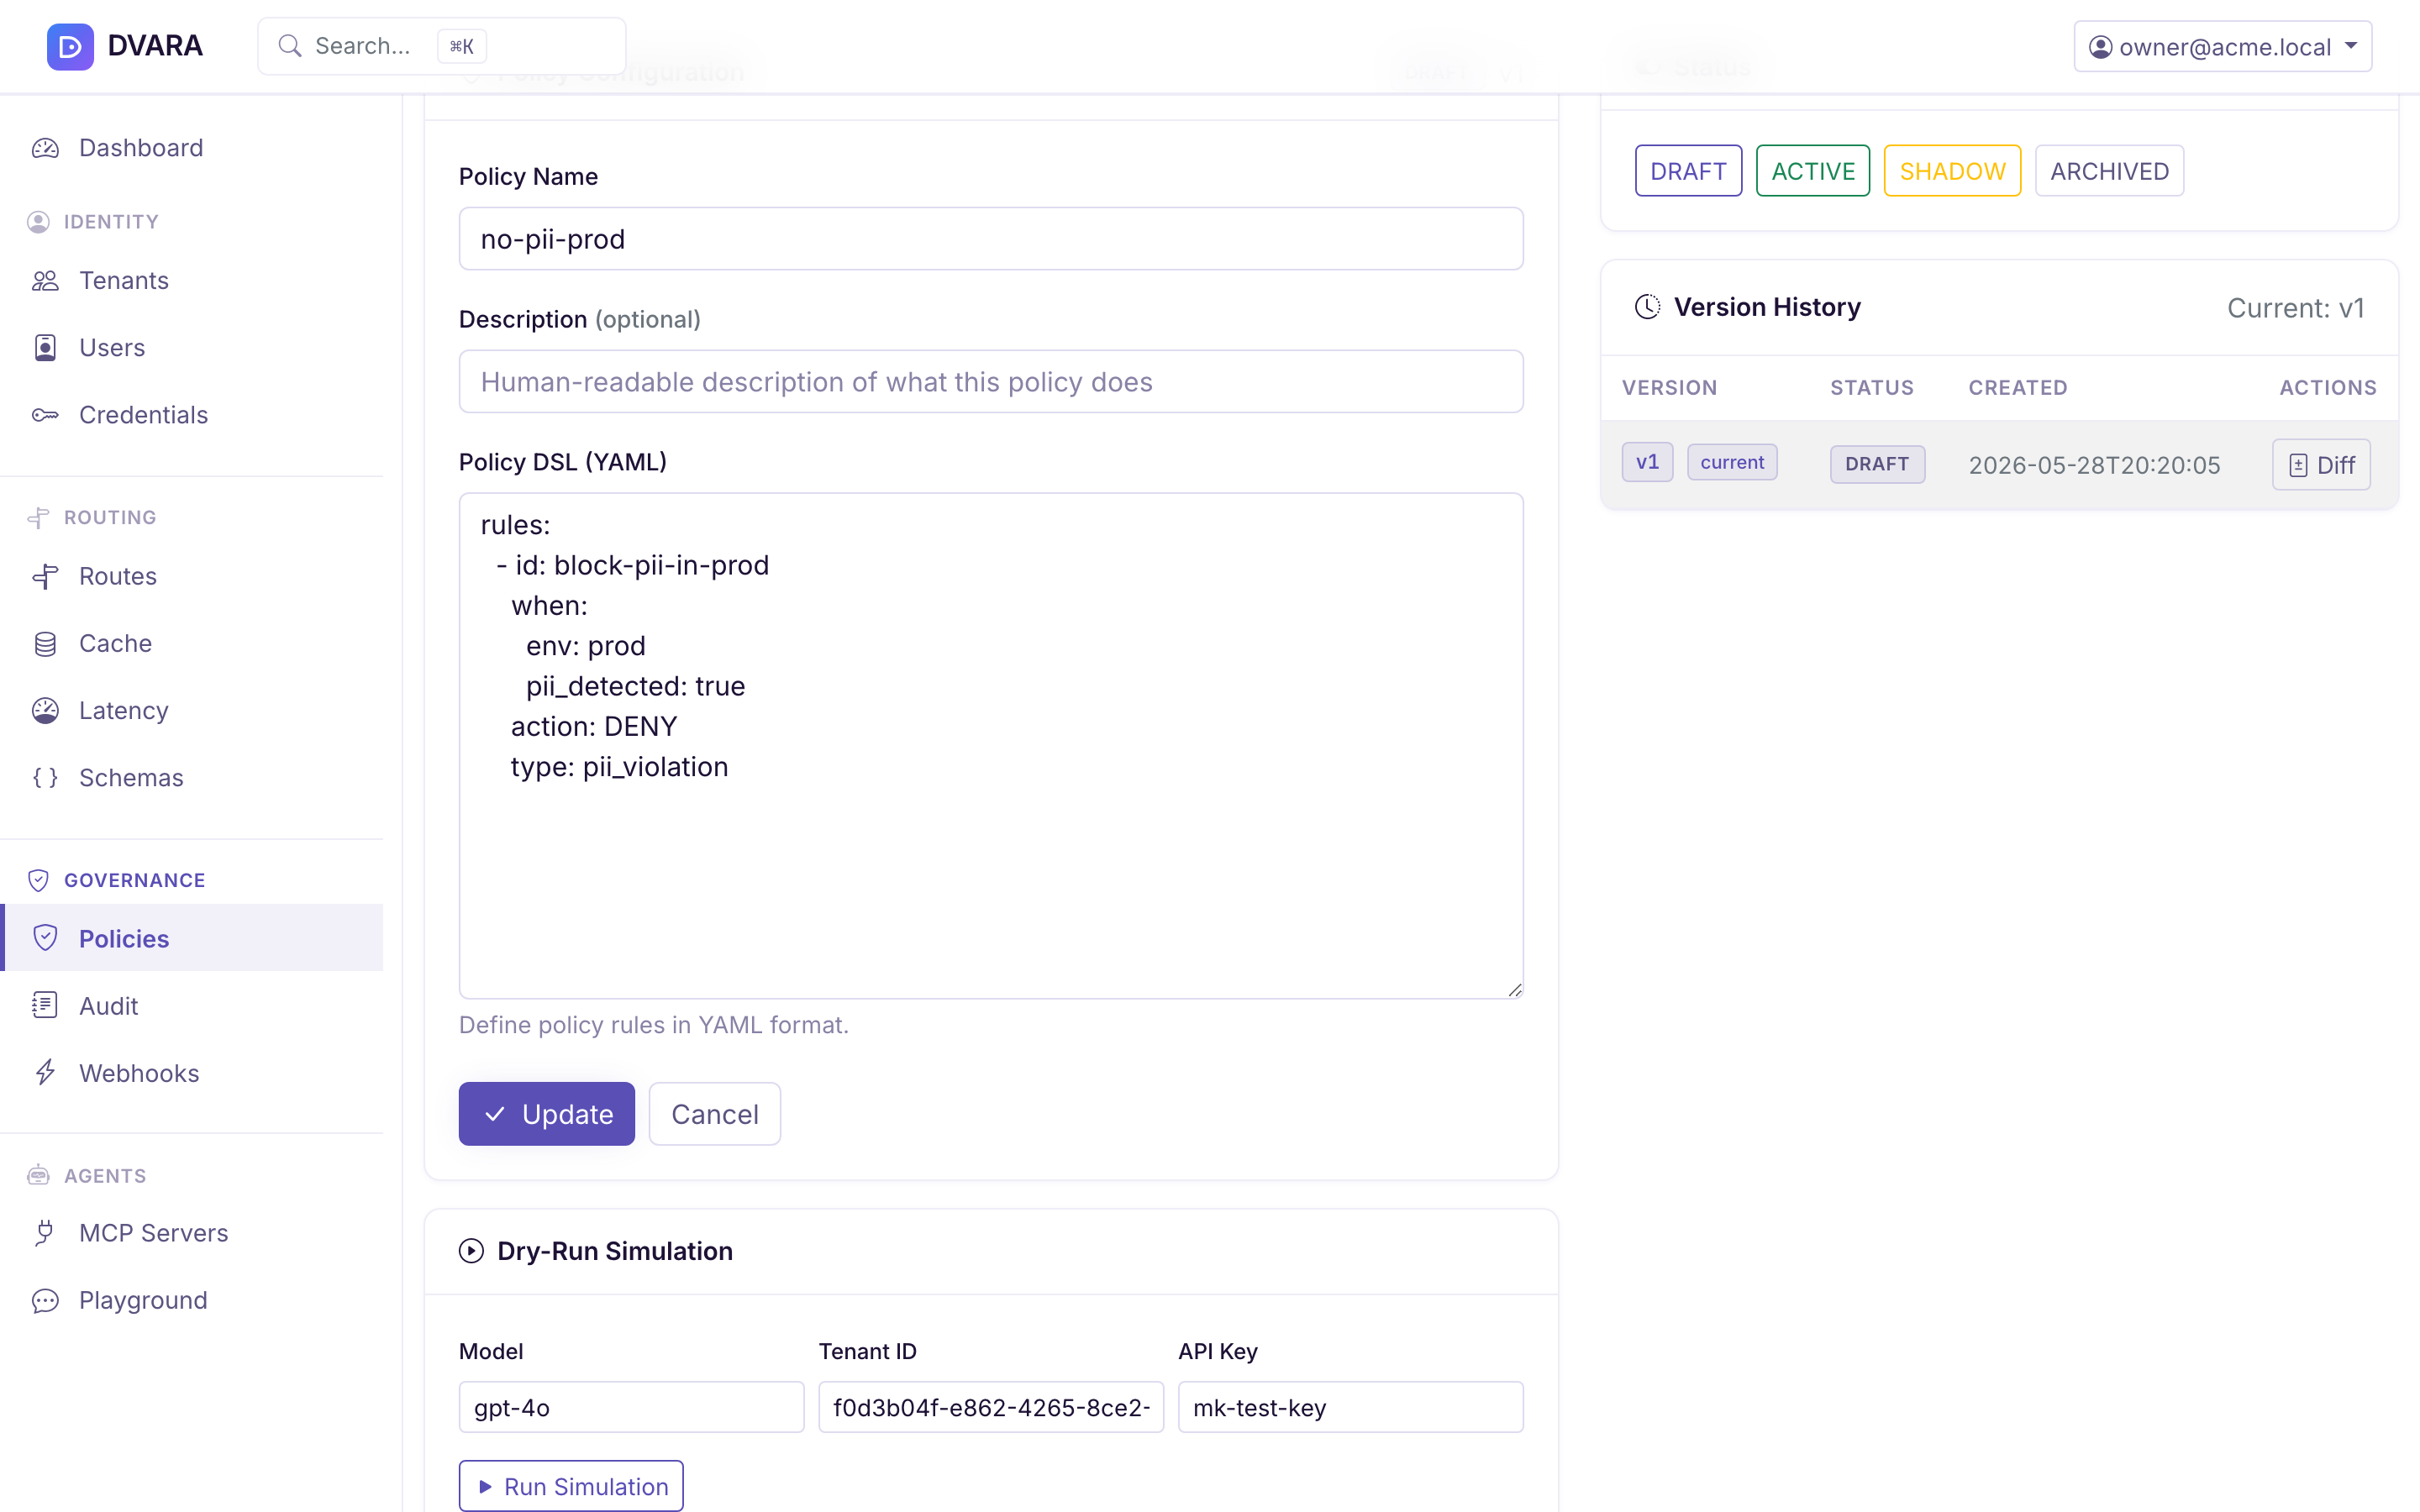
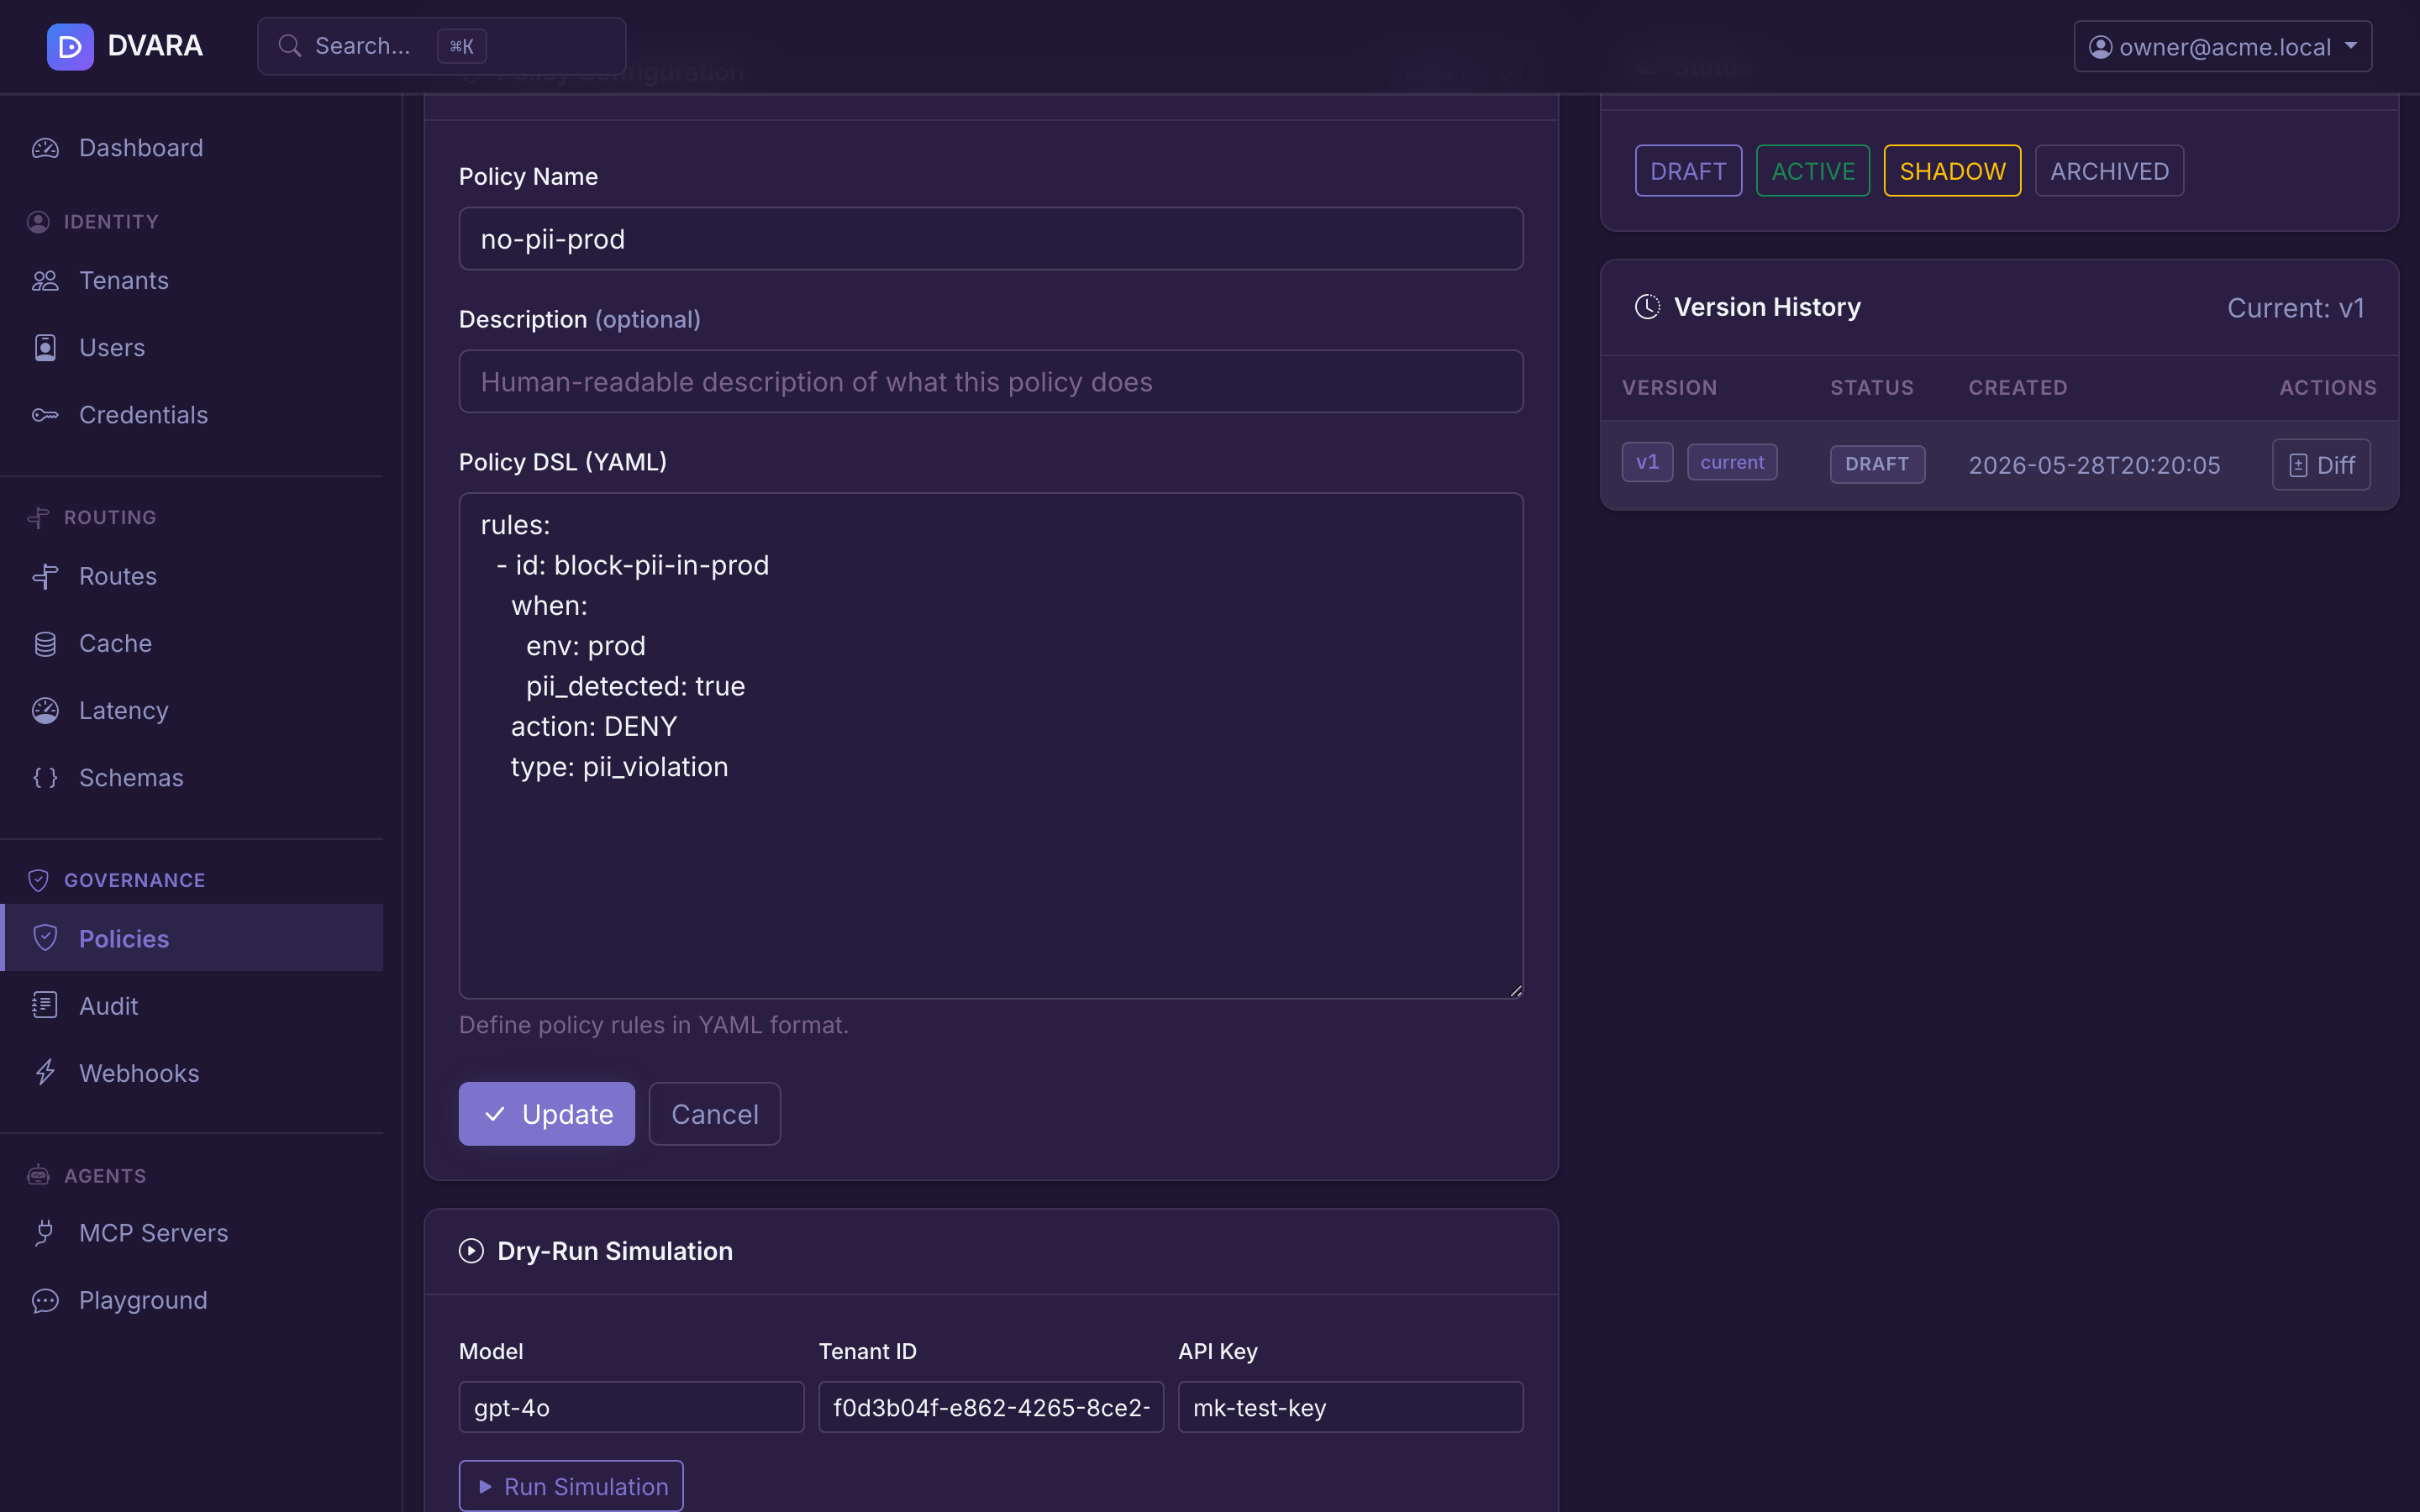
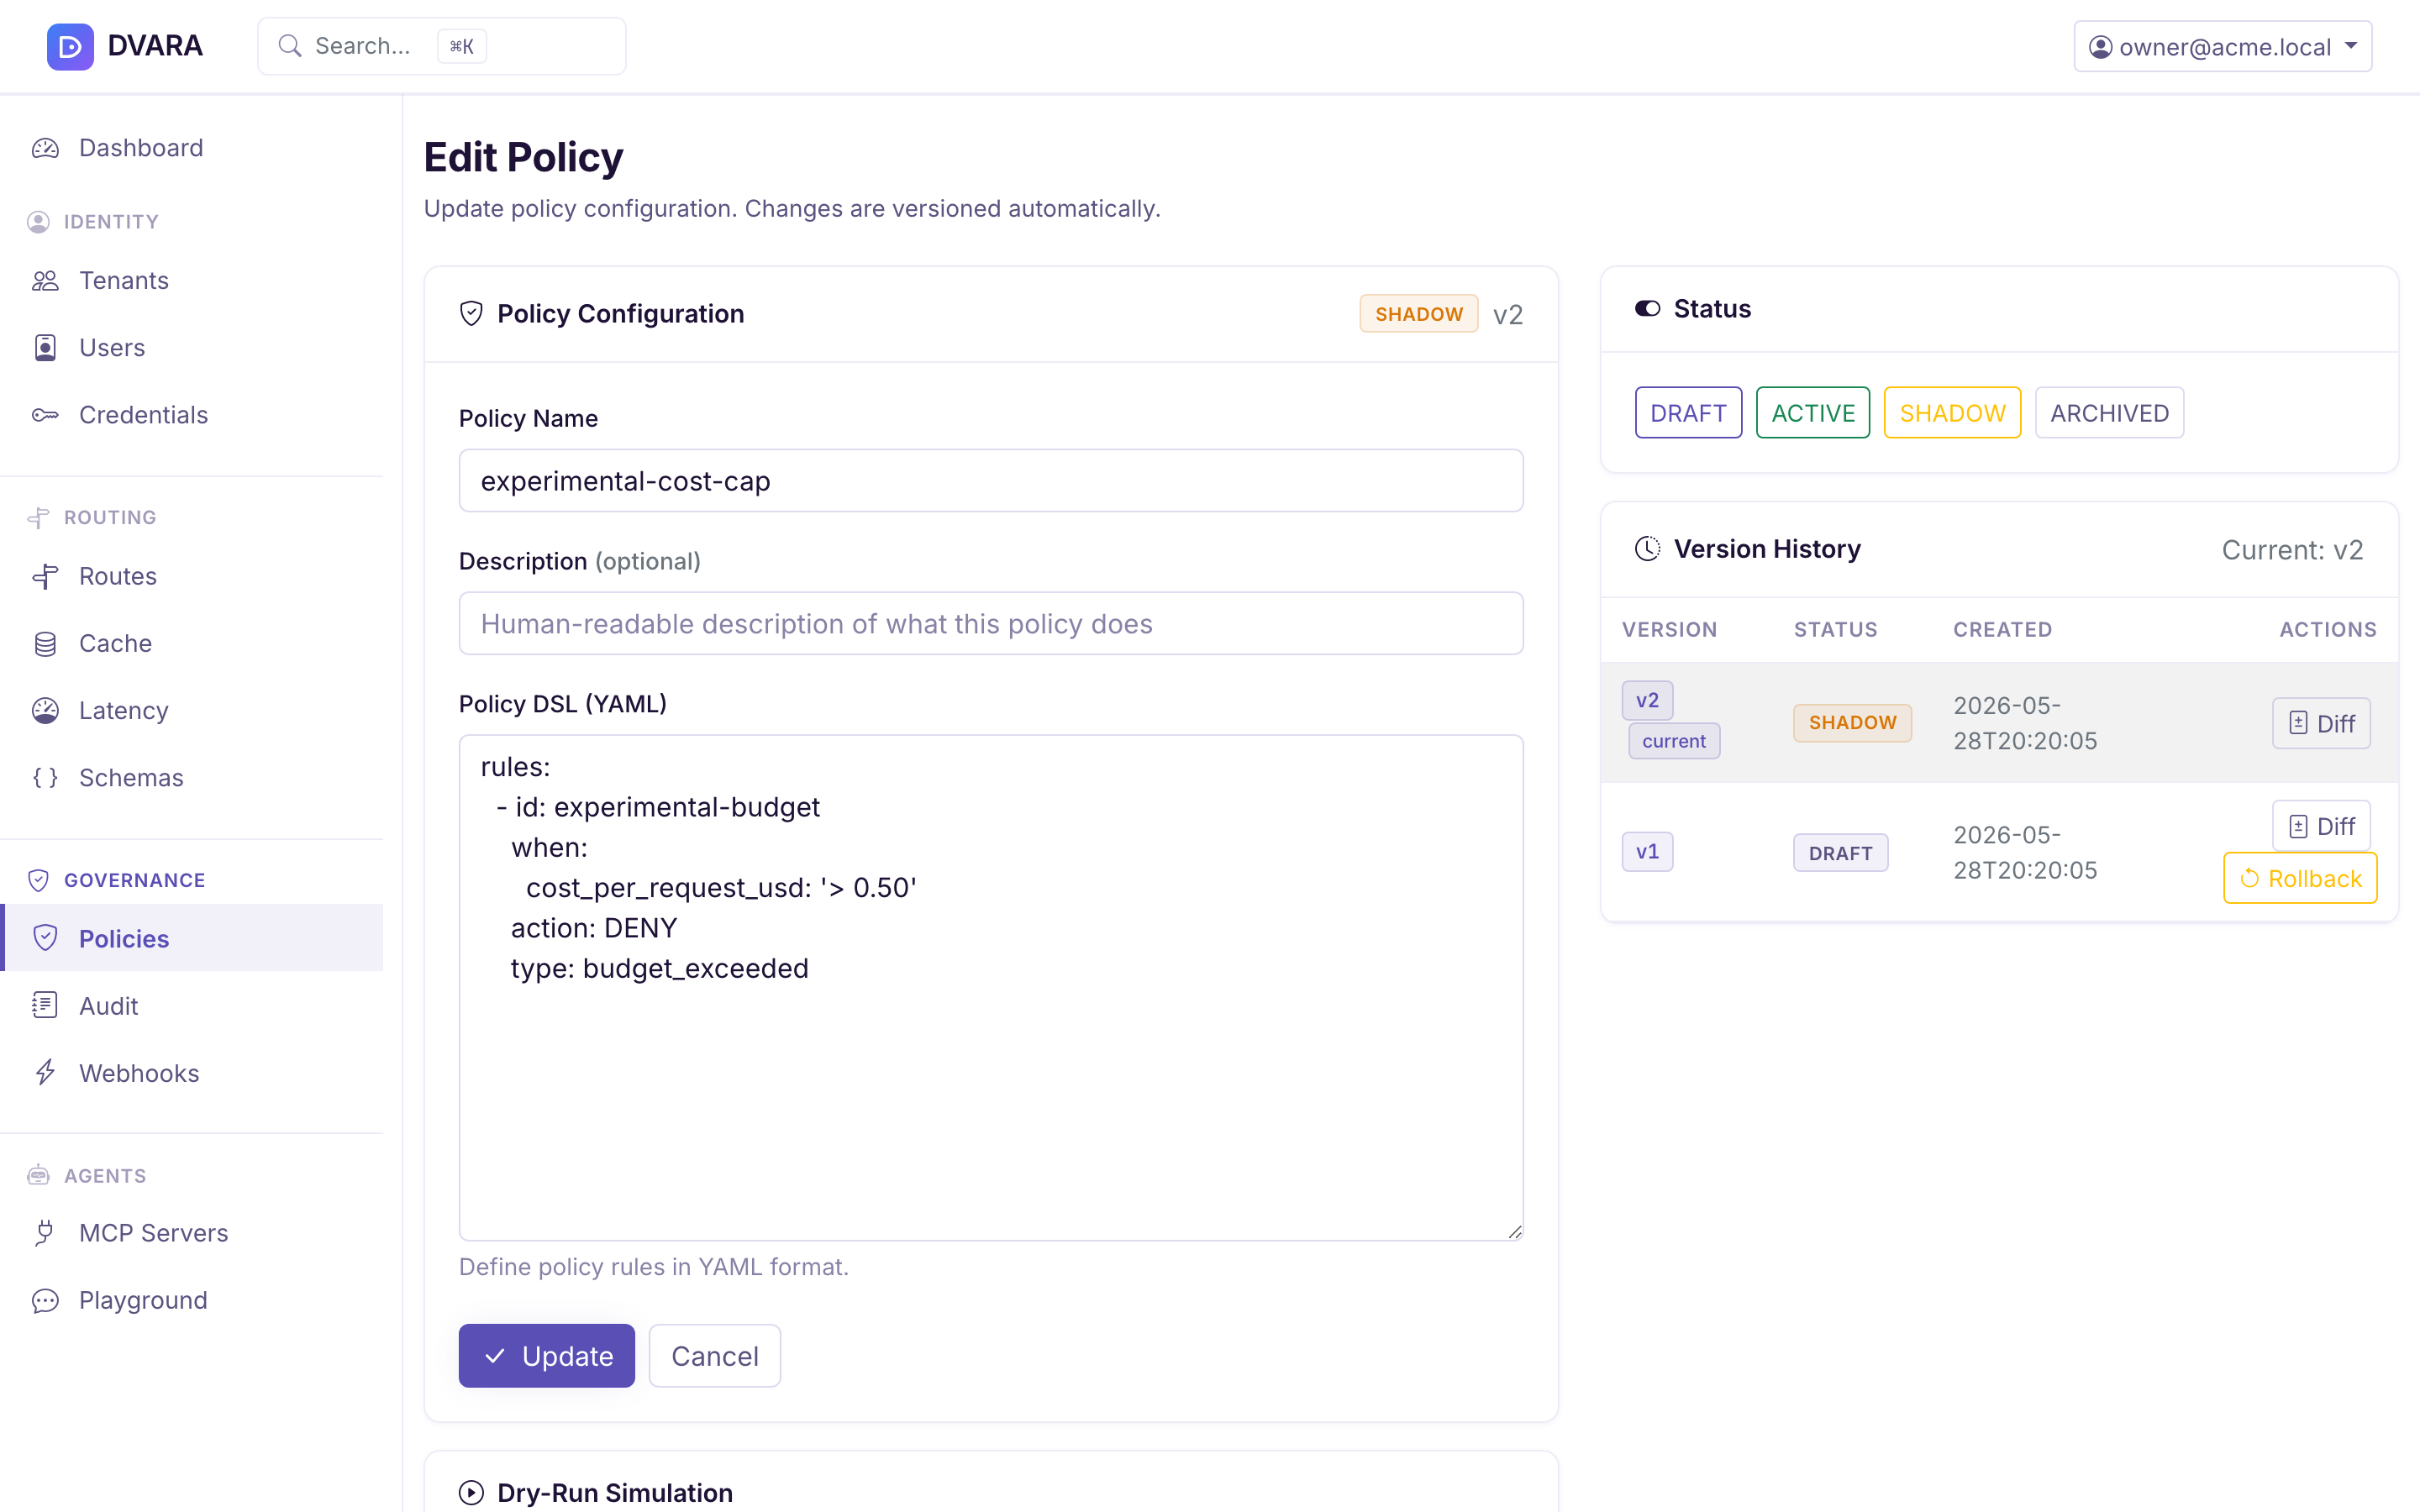
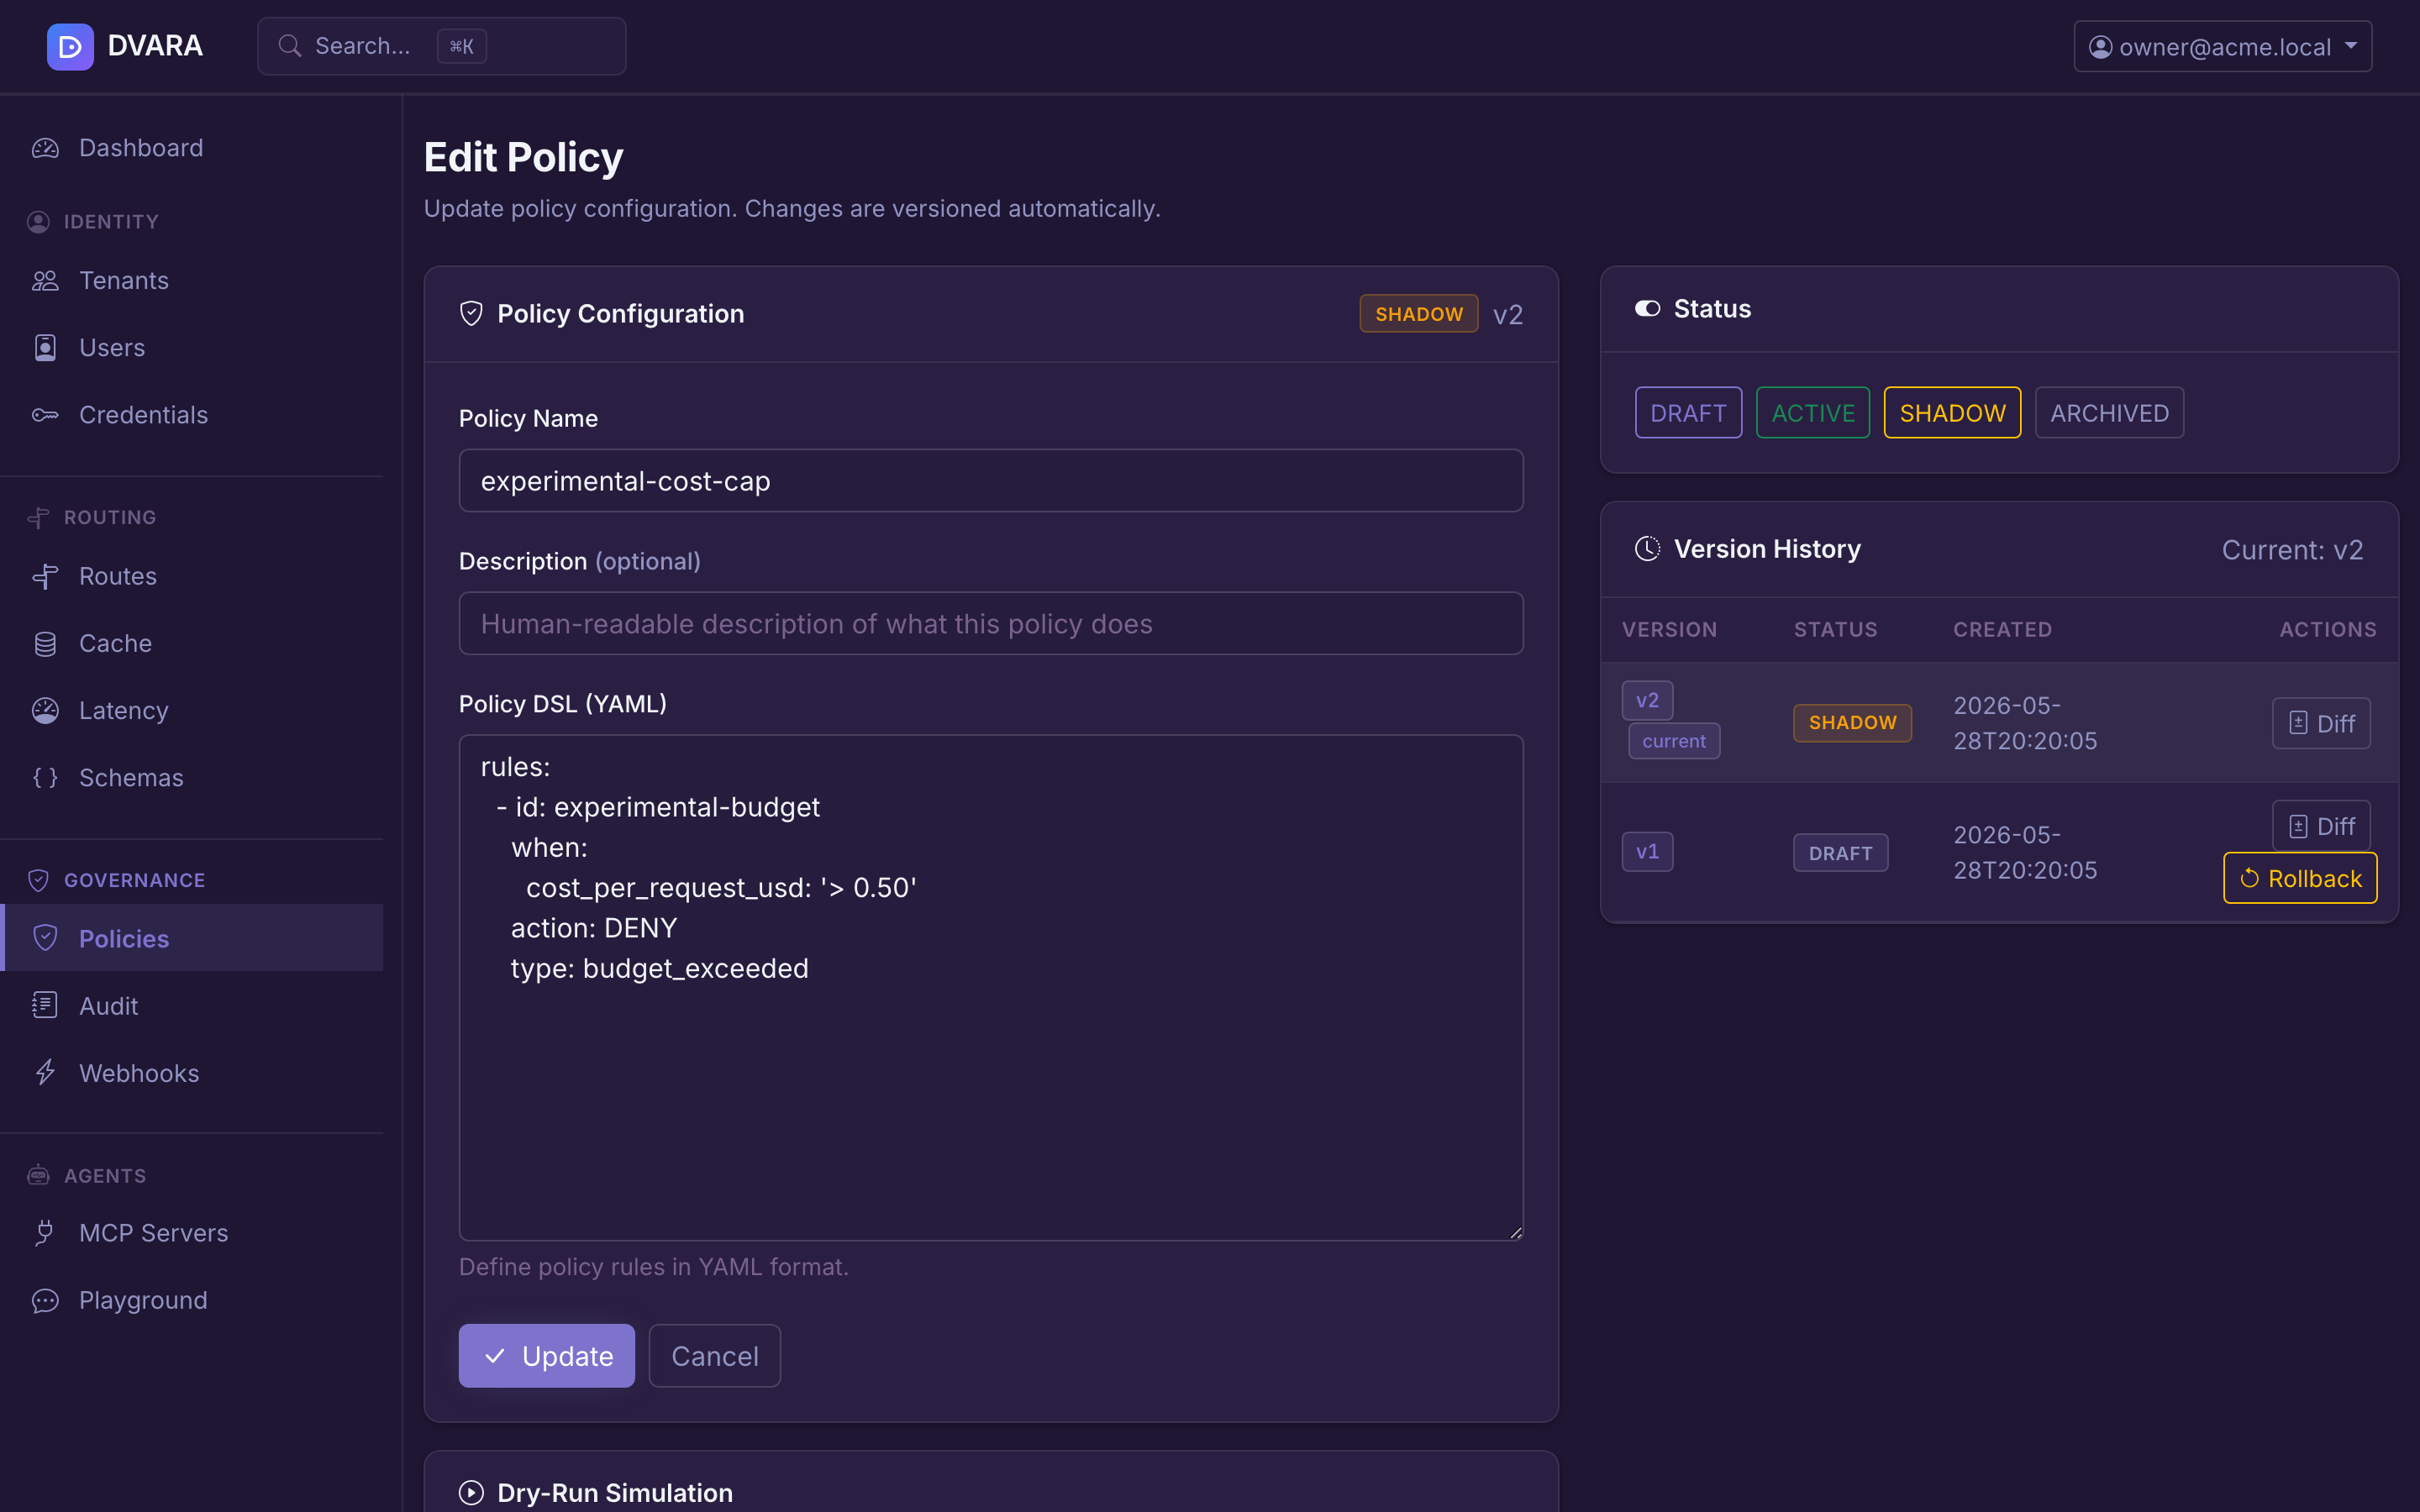
Create / edit policy
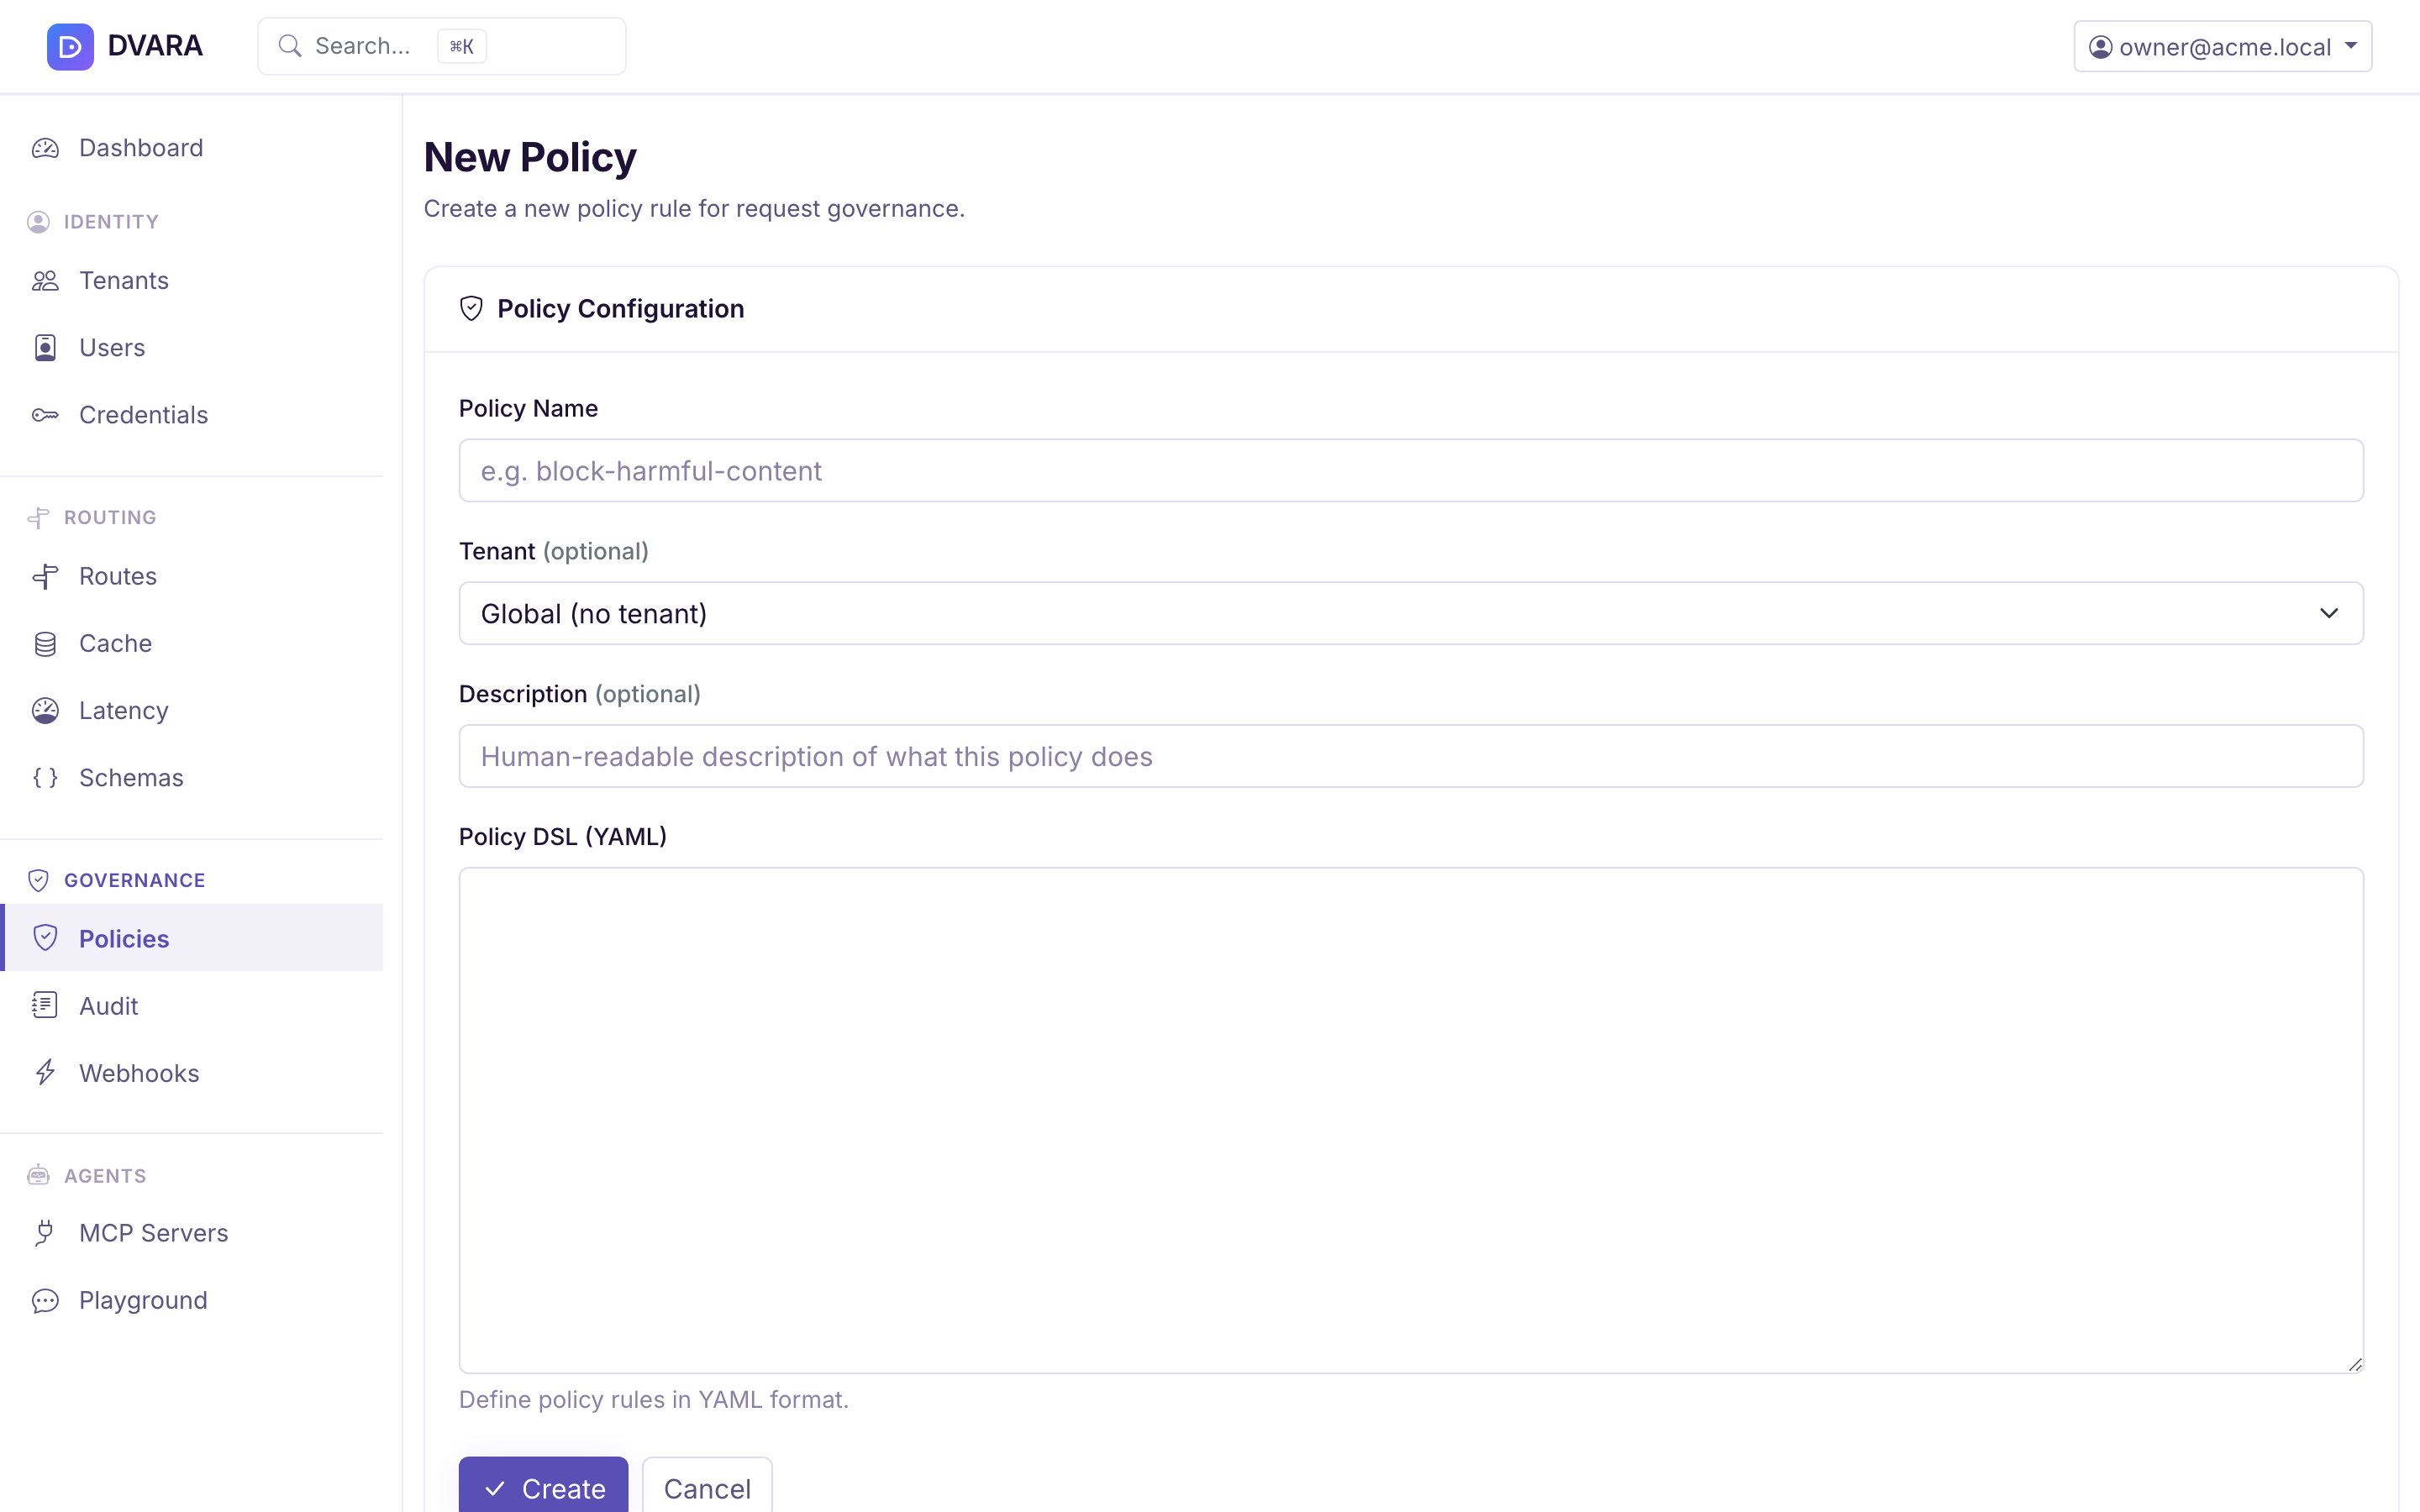
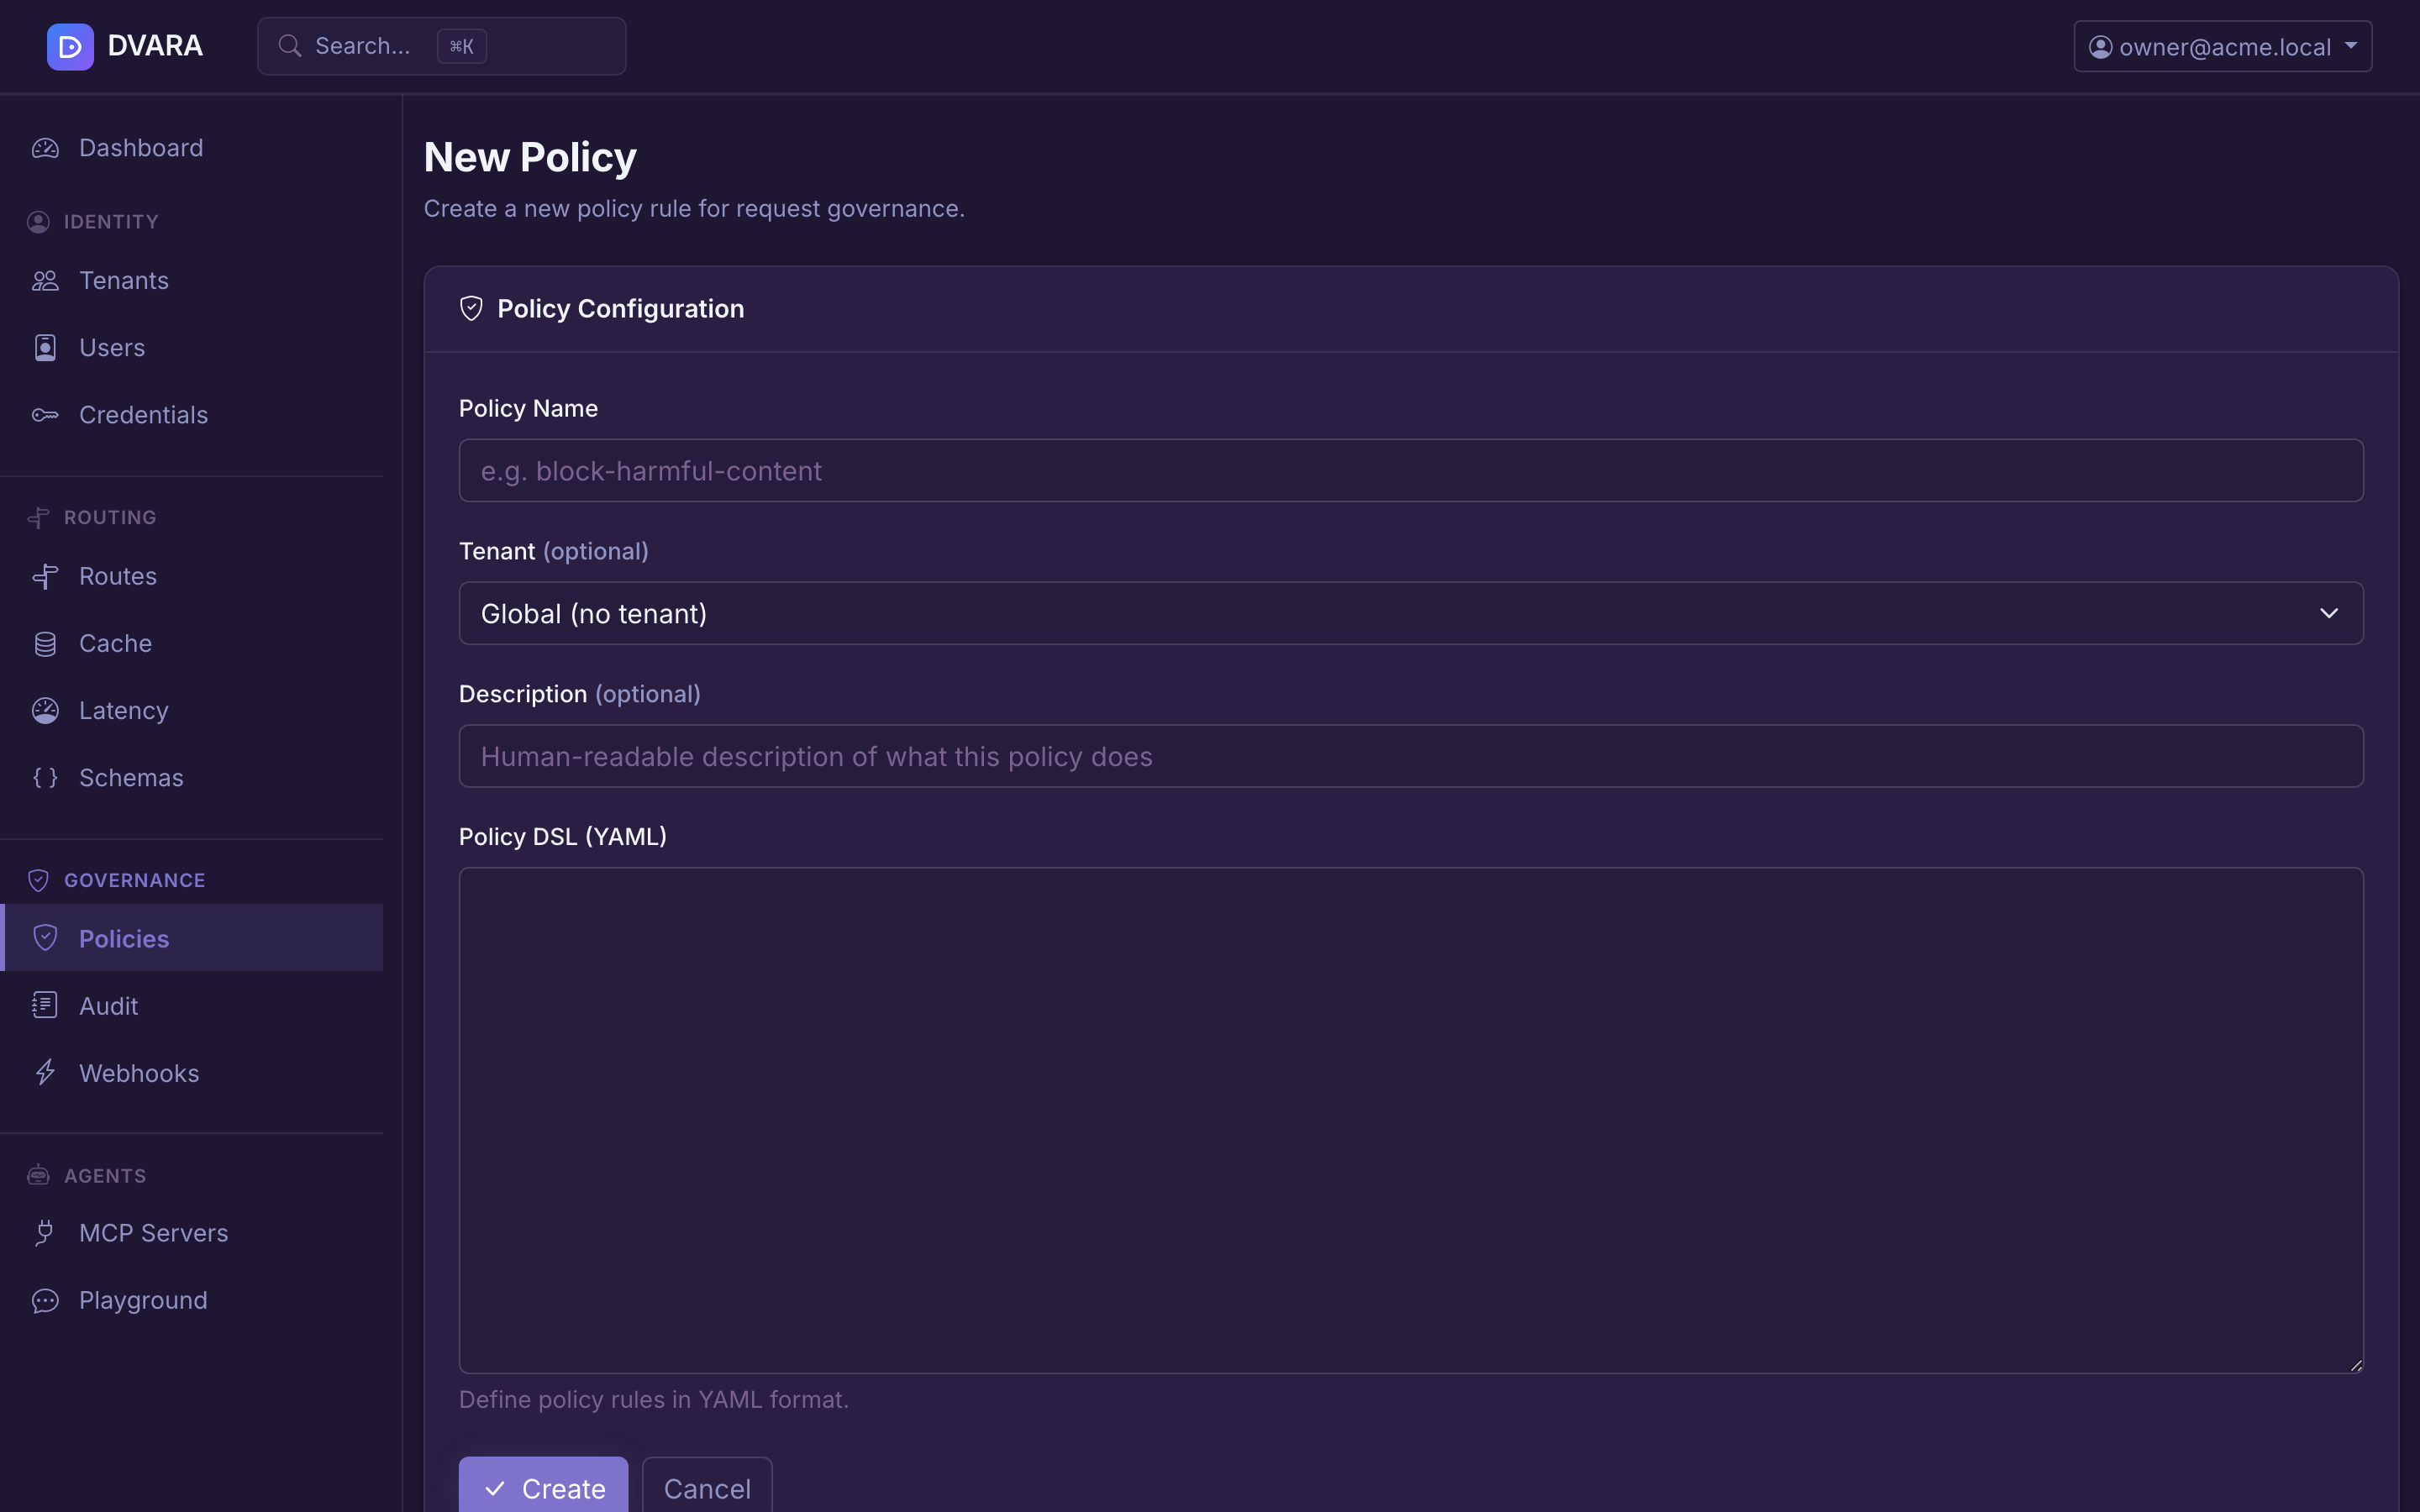
Click New Policy to create a policy with:
- Name — human-readable policy name
- Tenant ID — scope to a tenant (blank = global)
- DSL — YAML policy rules, edited in an in-browser YAML editor with syntax highlighting
- Status — lifecycle status (
DRAFT,ACTIVE,SHADOW,ARCHIVED)
In edit mode, the right panel shows:
- Version History — same diff and rollback functionality as routes
- Status Changes — change the policy lifecycle status
- Dry-Run — simulate the policy against a sample request and see the decision plus timing
DSL validation at submit time
The YAML is compiled and validated before the policy is persisted. Authoring mistakes that would have silently produced a no-op rule before now fail the submit immediately with HTTP 400 INVALID_POLICY_DSL and a compiler error pointing at the rule id and offending key:
- Unknown keys. Anything that isn't a recognised top-level / rule / condition key — including typos like
condition:(singular) and non-existent fields liketenant:as a per-rule condition — is rejected with a hint at the correct shape. The DSL is closed-schema; YAML comments use#as usual but extra unknown keys are not silently absorbed. - Unknown rule actions. Rules accept exactly two actions:
DENYandWARN_AGENT(case-insensitive). Typos likeaction: warn(silently fell through to DENY before) oraction: shadow(a customer reaching for a per-rule shadow that isn't a real product feature) are rejected with a pointer at the policy-lifecycleSHADOWstatus — see Shadow policy dashboard below. - Conflict detection at promotion time. When you flip a policy from
DRAFTtoACTIVE(or promote a SHADOW), the conflict detector checks the candidate against every currently-active policy across all nine condition types — model, tools, MCP server/tool/args, data_residency (flags disjoint allowed-region sets that no request can satisfy), time_of_day (flags redundant rules + timezone mismatches on overlapping ranges), max_tokens, and budget_utilization (flags different thresholds firing at different cap utilization levels). Conflicts are returned as warnings on the status-change response; the policy still activates but operators see the overlap.
CEL expressions for patterns the closed-form matchers can't compose
For patterns the closed-form conditions: matchers above can't express — anything that needs OR, NOT, or arithmetic across fields — a rule can use a per-rule expression: field instead of conditions:. The value is a CEL (Common Expression Language) string compiled and type-checked at submit time. CEL is the sandboxed expression language Kubernetes admission policies, Envoy, Cilium, and gRPC use for the same problem class — no I/O, no host calls, no loops, deterministic, halting-decidable.
rules:
  - id: gpt4o-outside-eu-or-large-requests
    expression: |
      request.model == "gpt-4o" &&
      (context.region != "EU" || request.message_count >= 50)
    action: DENY
    deny_message: "gpt-4o restricted outside EU or for ≥ 50 messages"
That single rule covers a pattern that would otherwise require three separate conditions: rules.
expression: and conditions: are mutually exclusive on the same rule — specifying both fails the submit; specifying neither also fails (a matcher-less rule is almost certainly an authoring mistake). Mixing rule kinds within the same policy is fine — author whichever shape fits each rule.
Evaluation context (closed surface): request.{model, tenant_id, message_count, total_input_chars, metadata[key]}, context.{region, tenant_region}, budget.utilization_pct, plus the CEL standard library (string methods in receiver form — s.startsWith(t), s.contains(t), s.matches(regex) — list/map indexing, in, comprehensions). Two CEL-API notes worth keeping in mind while authoring: (a) every request.* / context.* / budget.* field is declared as Dyn at the type-checker level so the surface can evolve without breaking compiled policies — cast with string(...) before calling string methods (string(request.model).matches("^gpt-.*$"), not matches(request.model, "...")); (b) the embedded CEL library only registers receiver-style overloads for the string methods, so matches(s, regex) fails to compile and s.matches(regex) is the working shape. Temporal functions (now(), hour(ts, tz)) are not in v1 — for time-of-day deny windows use the existing conditions: { time_of_day: ... } matcher.
Static conflict detection is skipped for CEL rules — equivalence between arbitrary CEL expressions is undecidable in general. The promotion endpoint emits one "skipped — verify manually via dry-run" warning per CEL rule on the candidate policy; non-CEL rules in the same policy still get the full 9-detector check above.
Shadow policy dashboard
When a policy is in SHADOW status, a dedicated shadow dashboard monitors divergence between the shadow and currently-active policy decisions without affecting real traffic.
Accessing the dashboard:
- From the policies list: click the eye icon next to any SHADOW-status policy
- From the policy editor: click View Shadow Dashboard in the status panel
Dashboard features:
- Period Selector — toggle between 1 h, 24 h, and 7 d time windows
- Stats Panel (auto-refreshes every 5 seconds) — three cards:
- Total Evaluations — number of times the shadow policy was evaluated
- Divergent Count — times shadow would have denied when active allowed
- Divergence Rate — percentage of evaluations that diverged
- Rule Breakdown Table — divergence counts grouped by rule ID
- Recent Divergent Events Table — latest divergent events with timestamp, request ID, model, tenant, active decision, and shadow decision
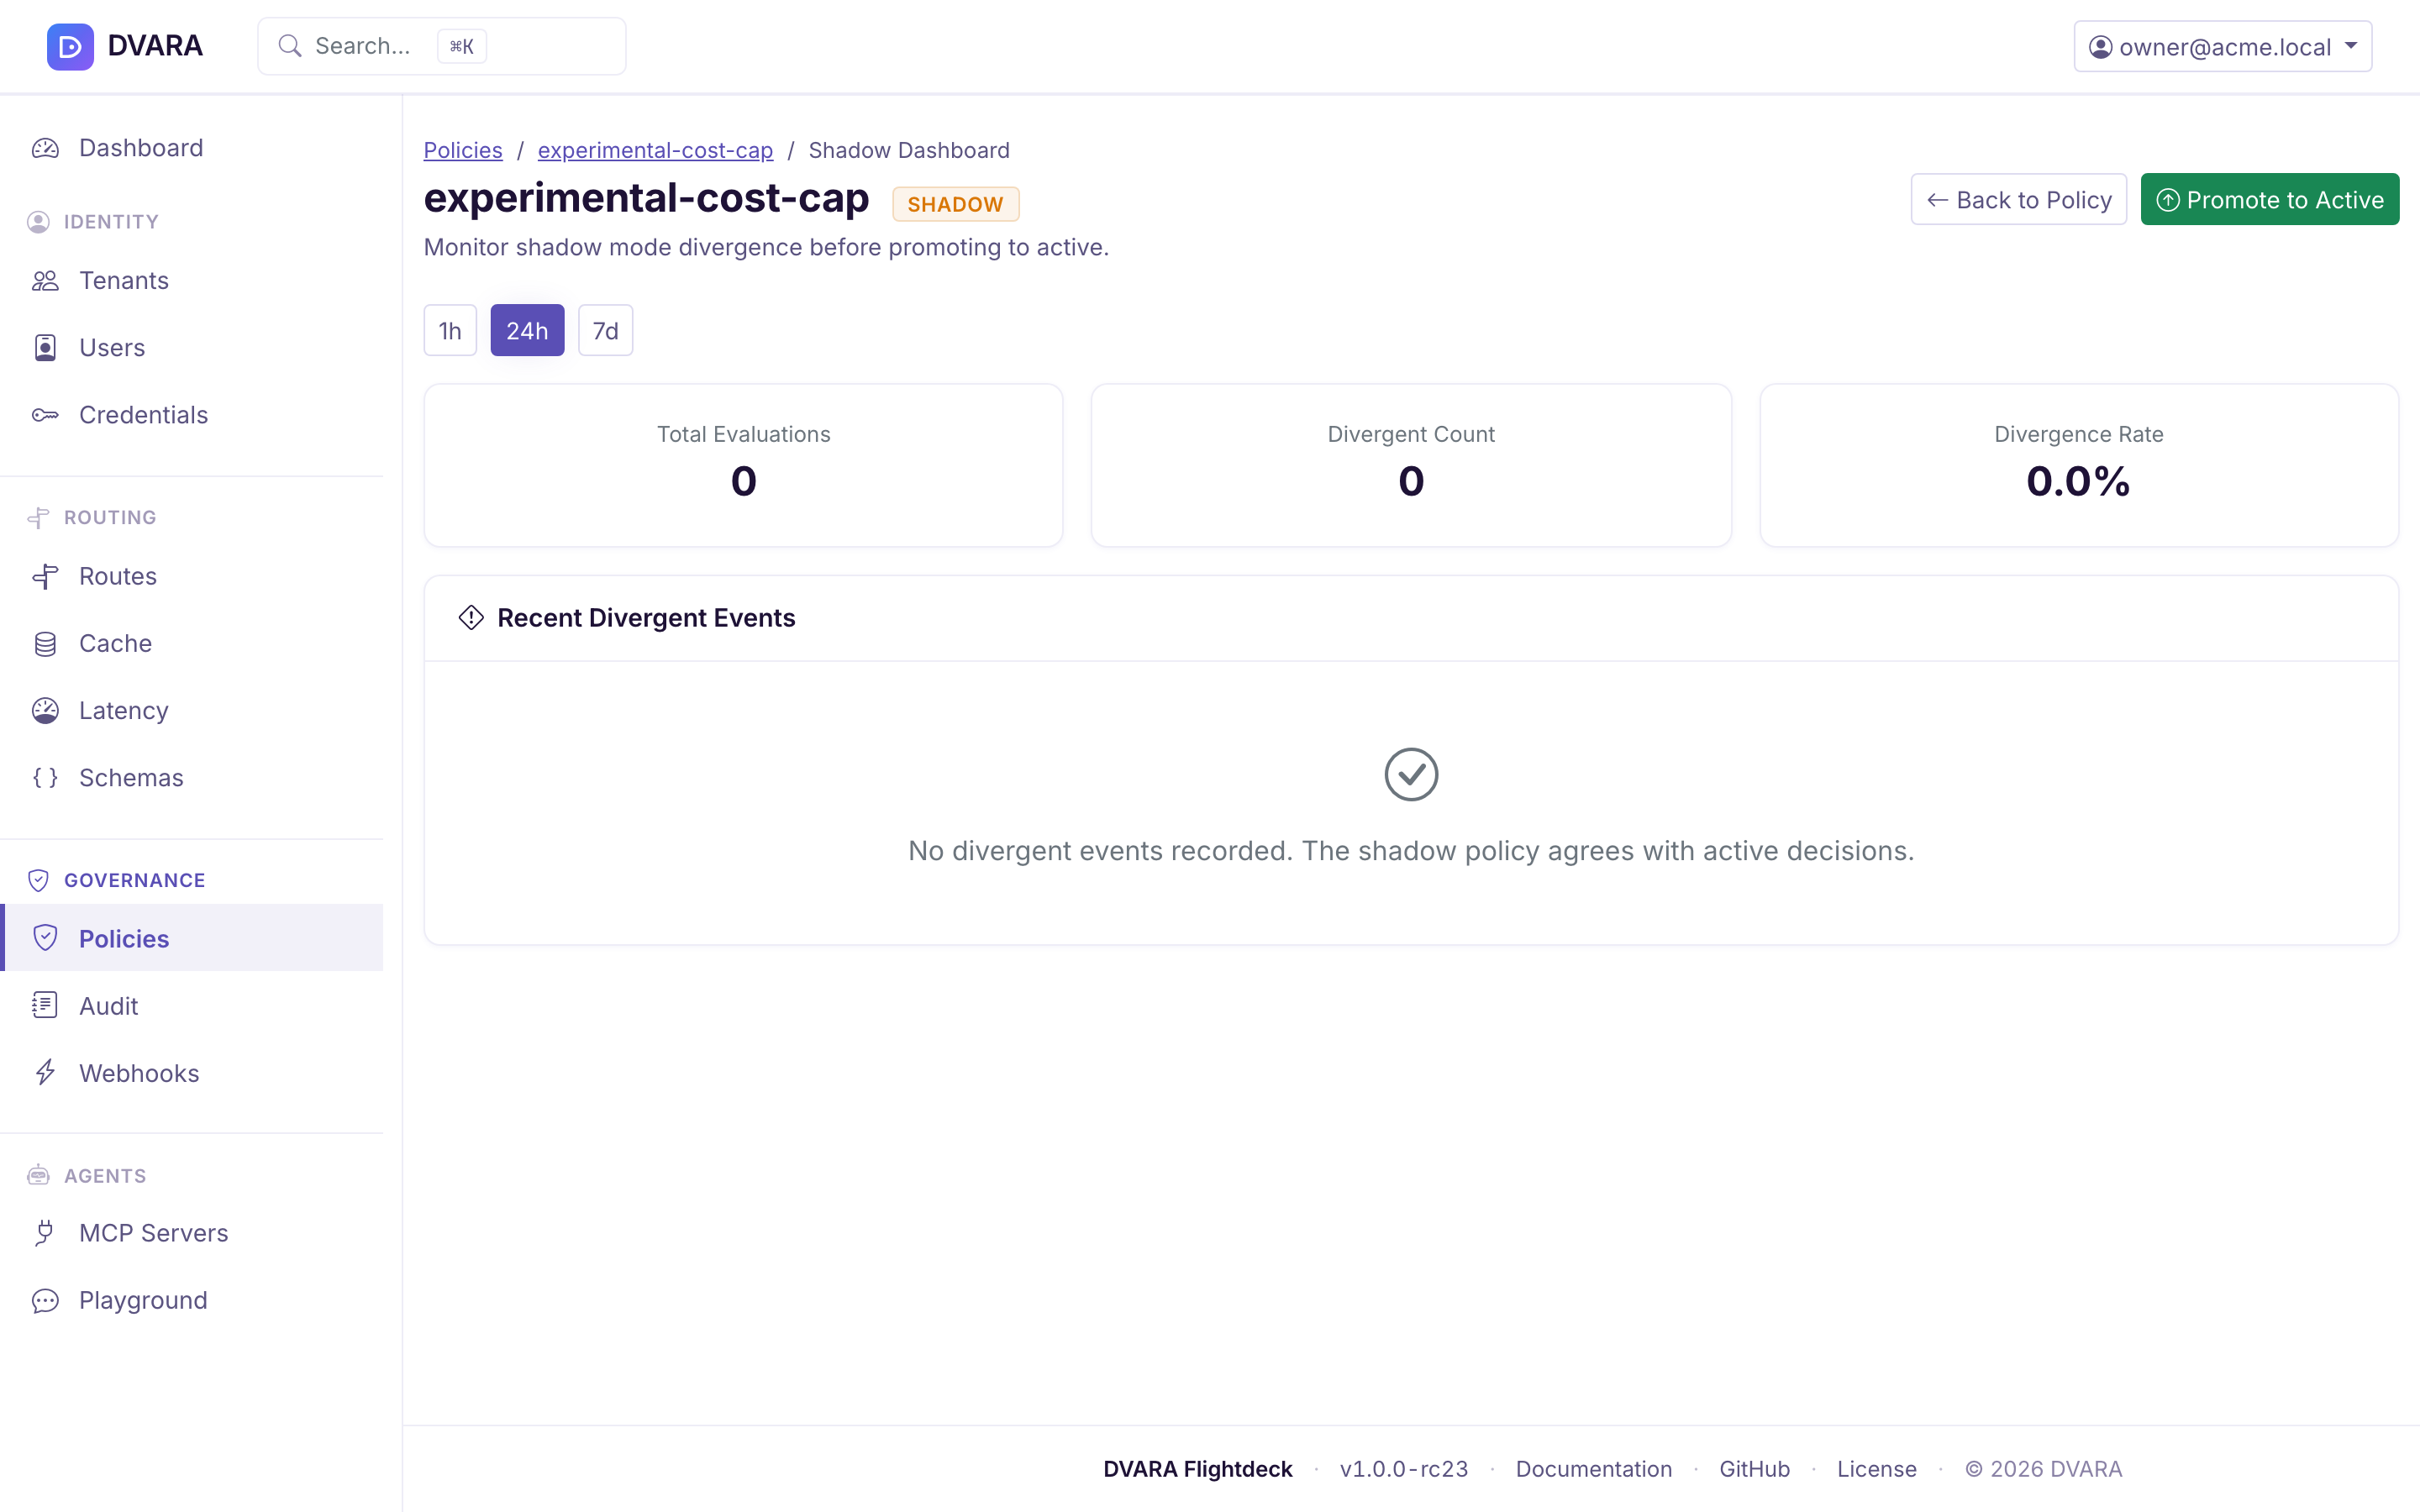
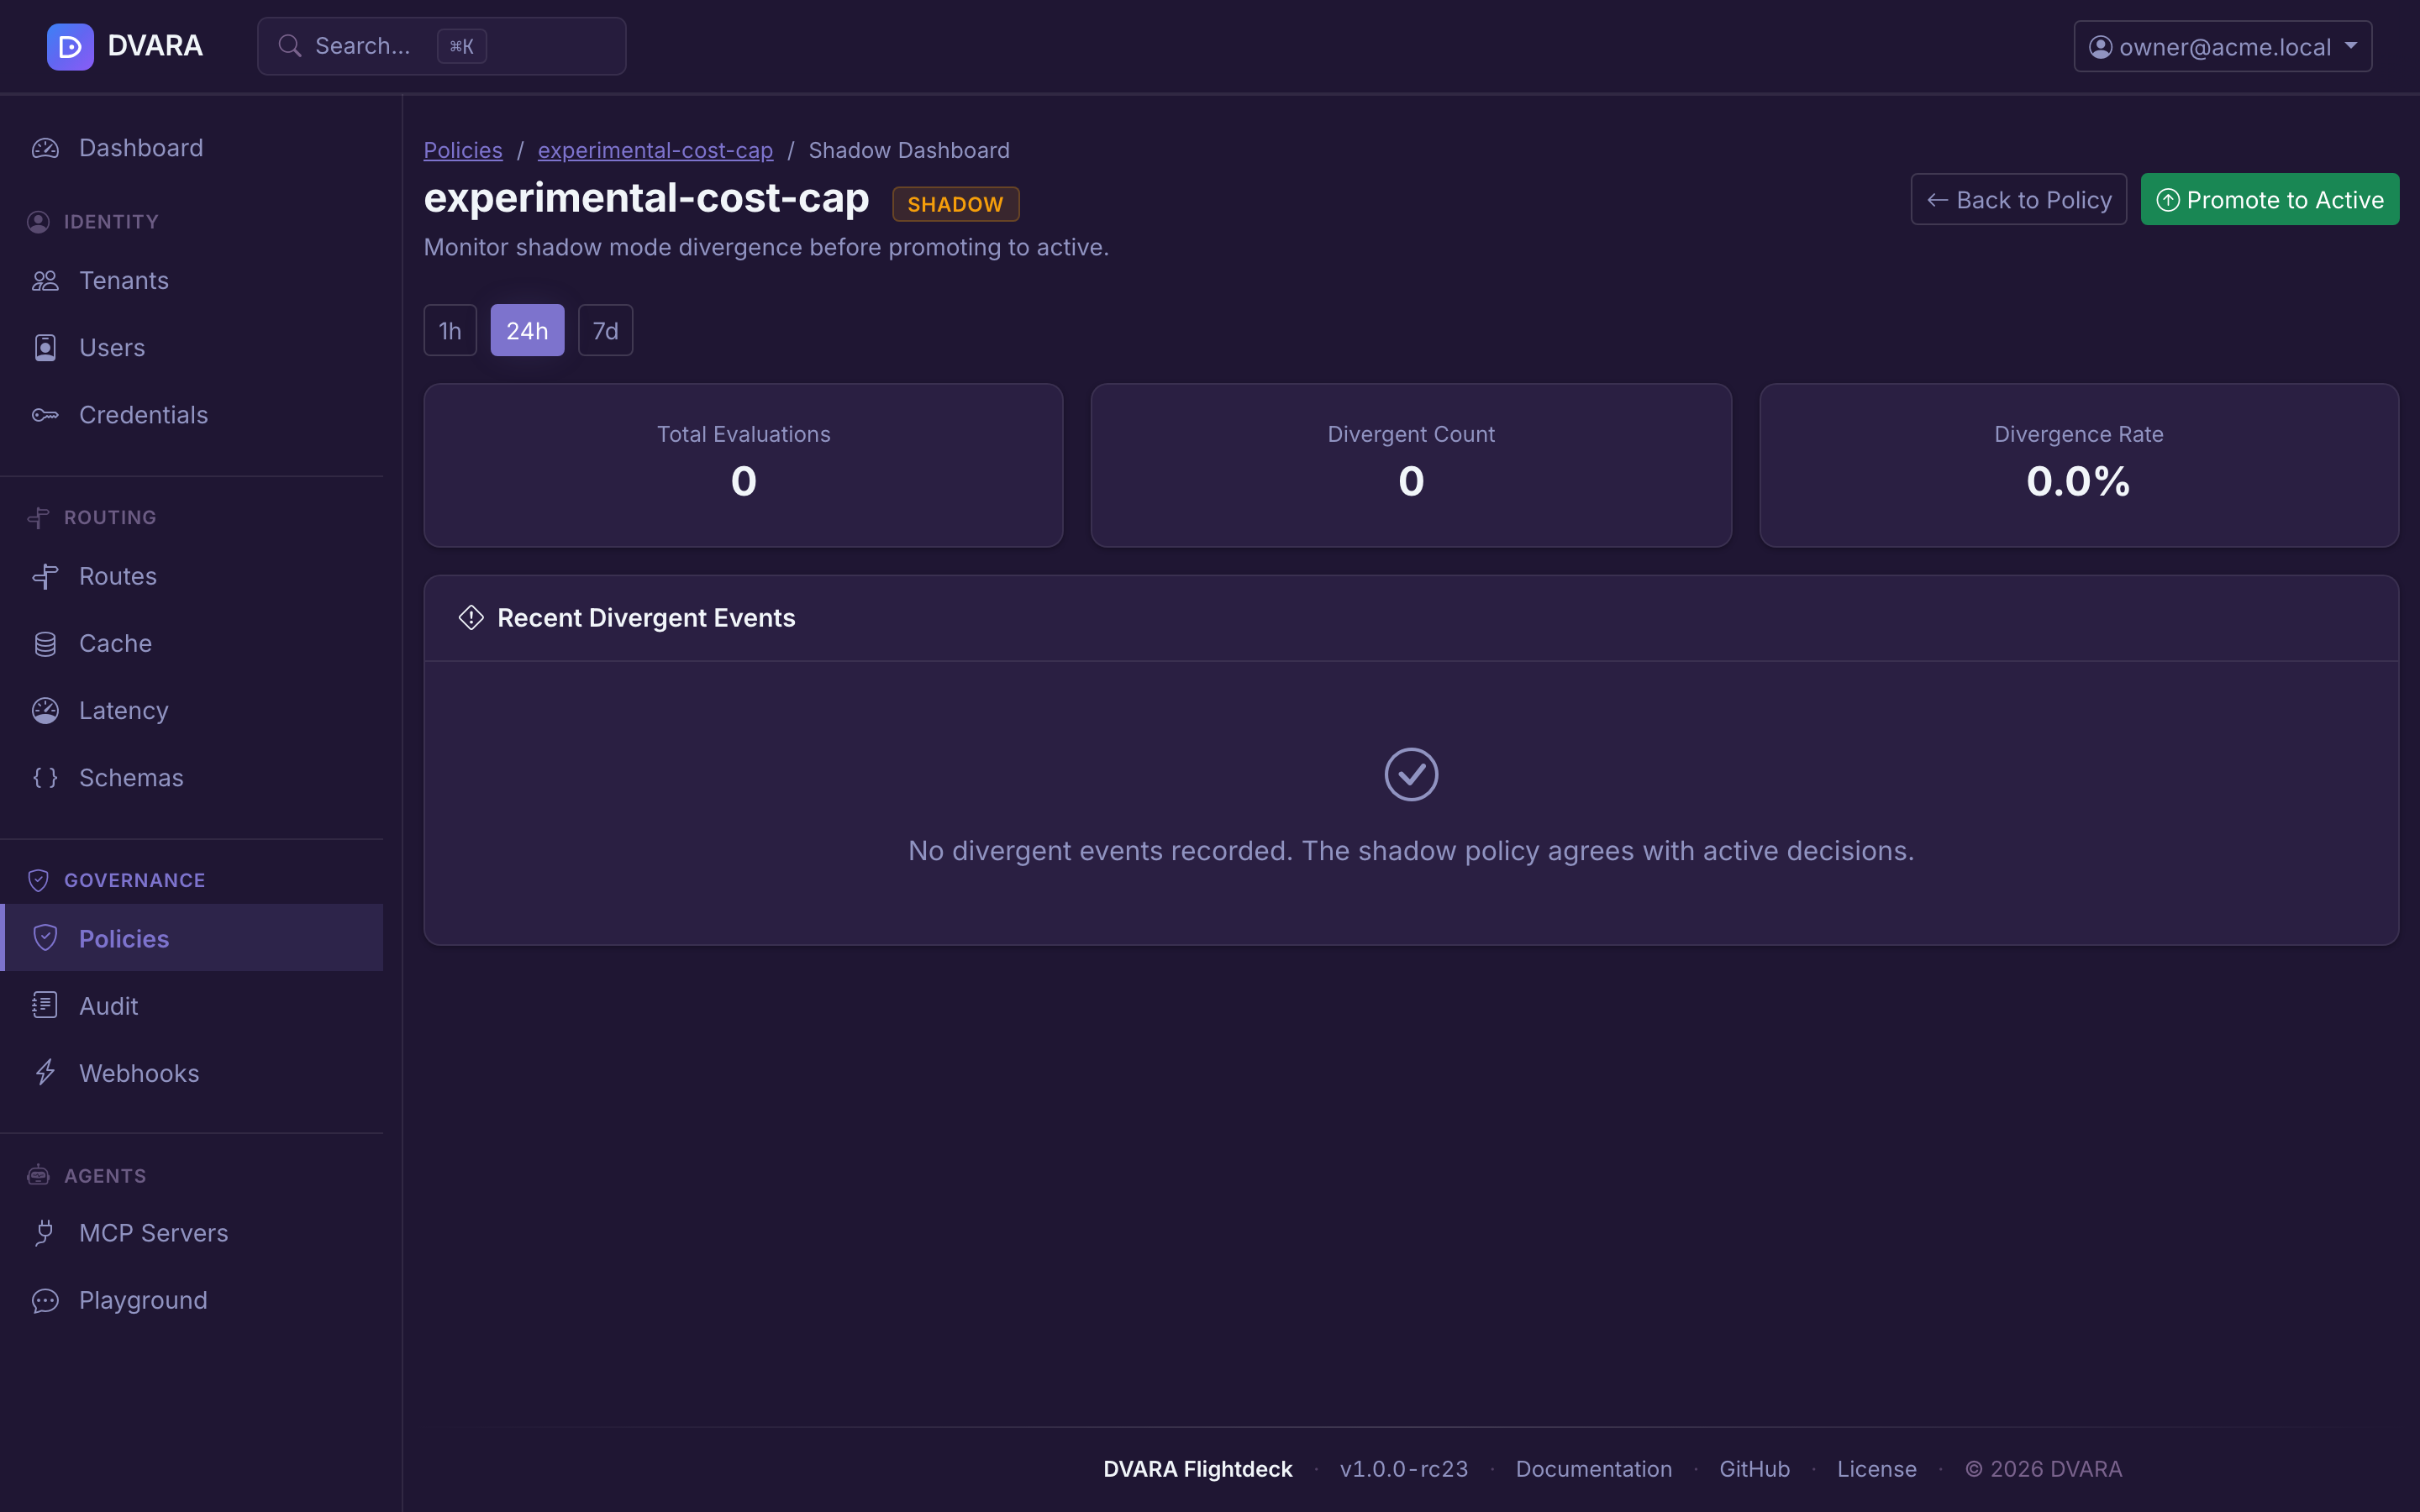
Promoting a shadow policy
Click Promote to Active to transition the policy from SHADOW to ACTIVE status. This:
- Runs conflict detection against existing active policies (warnings shown if conflicts are found)
- Changes the policy status to ACTIVE
- Clears all shadow event data for the policy
Output schemas
Structured-output JSON schemas that clients reference by ID (instead of sending inline on every request) live under Routing → Schemas in the sidebar (owner and policy-admin only). The page lists every registered schema with its scope (route id, model pattern, or both) and provides a create / edit form with a JSON-schema textarea plus a delete action behind a confirm gate. The same surface is available via the Admin API for GitOps pipelines that prefer to keep schemas in source control next to the apps that consume them.
See Structured Outputs → Inline schema vs. registered schema for when to register a schema, and the Admin API reference for the REST endpoints.