Read usage, search the audit log, and run compliance reports
Not included in DVARA Open Source.
The audit trail is the single source of truth for what happened in your workspace — who acted, what changed, what the data plane decided, when. Usage is the live financial lens on the same data; compliance reports are how you turn either of those into something an auditor will accept.
Sign in as any workspace role. The audit log and compliance reports work even when the gateway-connected indicator is red. Token usage and cost numbers do not refresh while it is red — they reflect the last data the data plane delivered.
Read this month's usage and cost
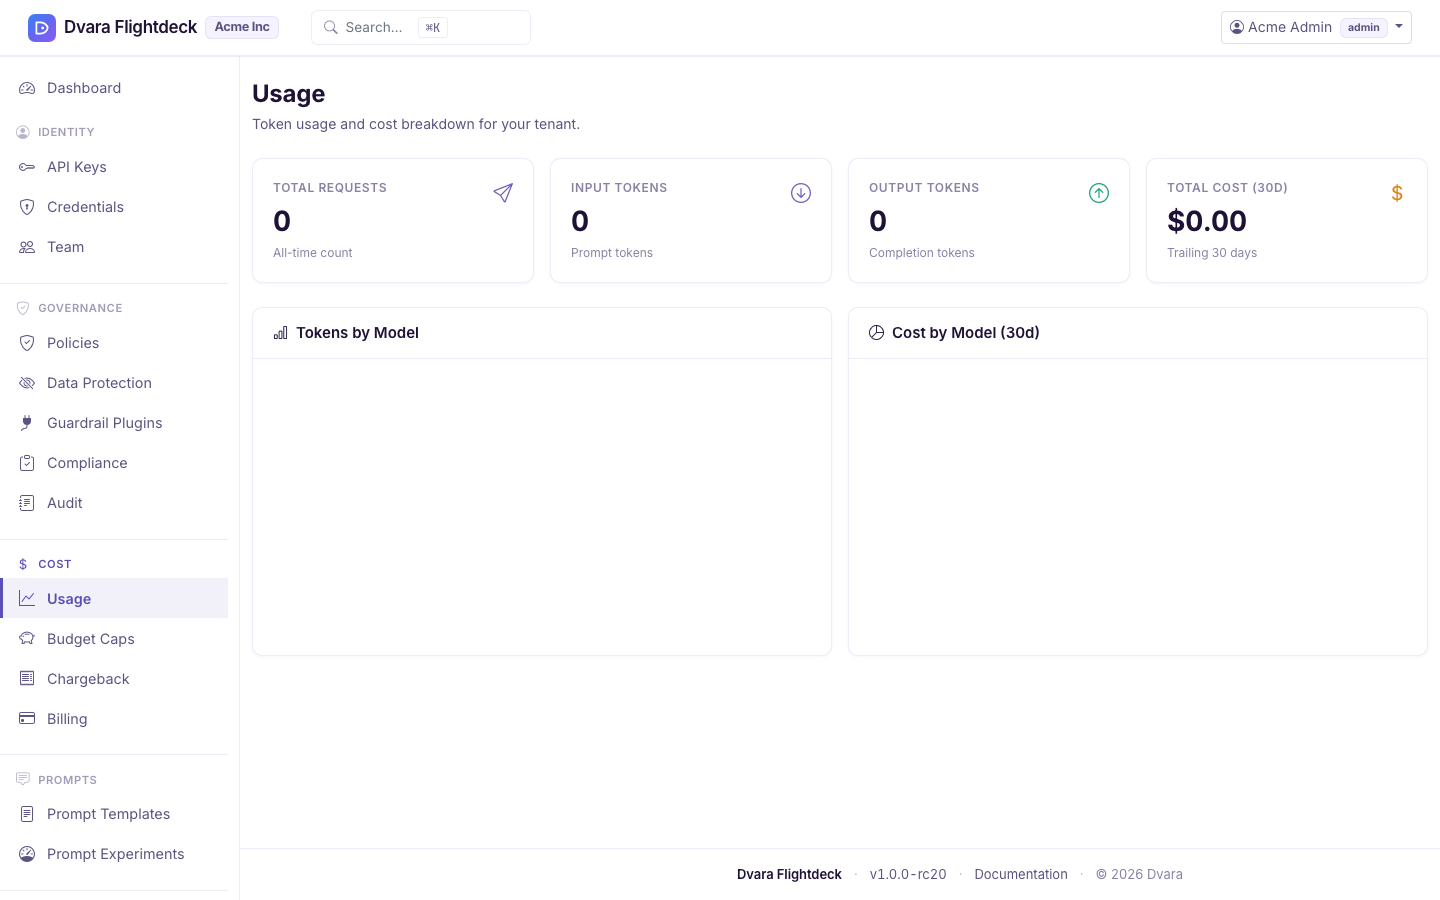
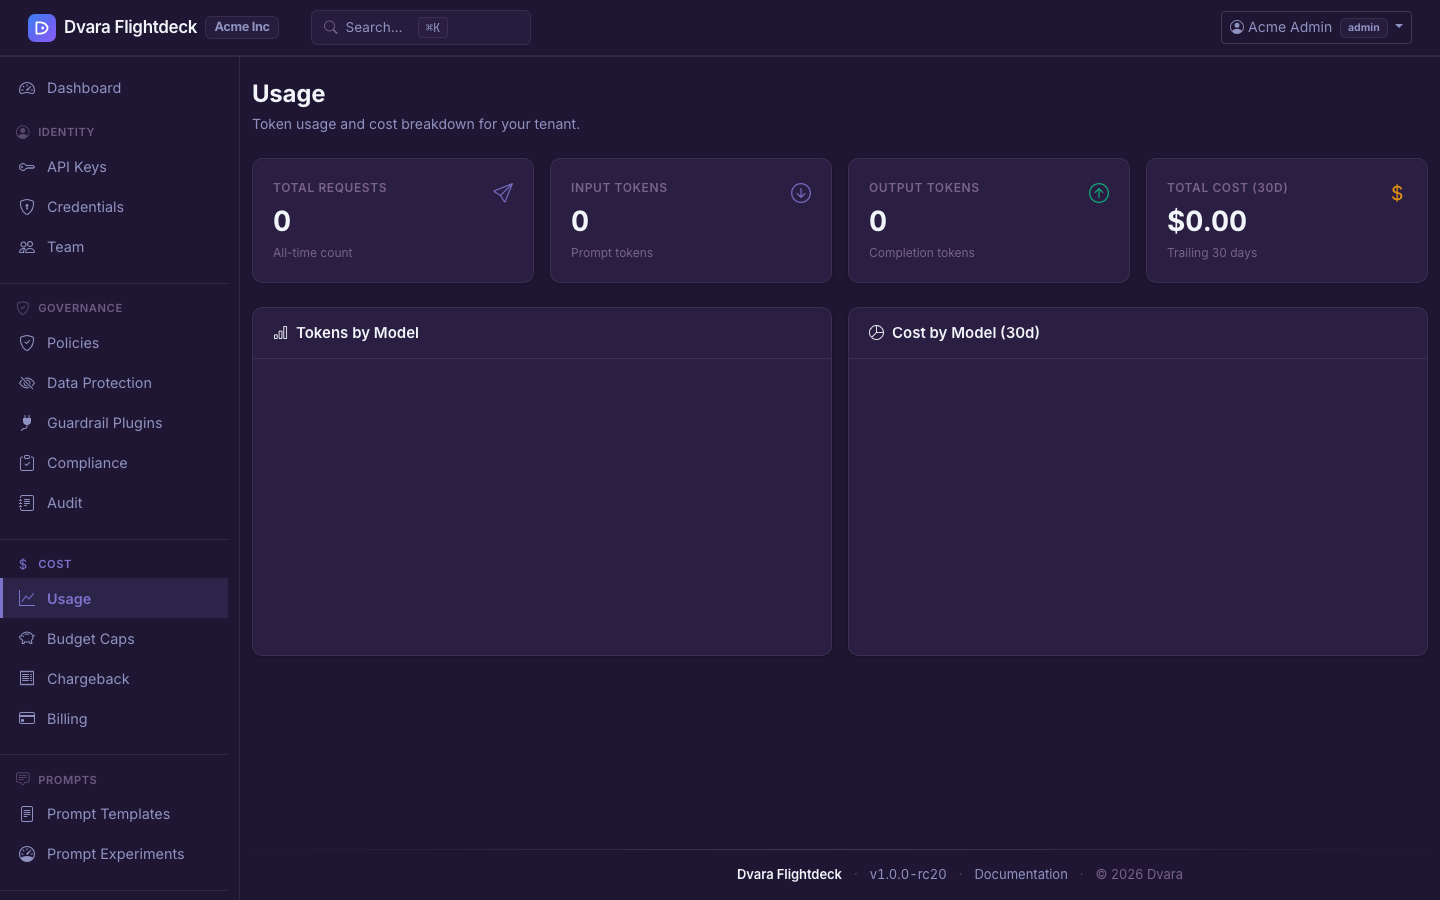
Open Usage in Flightdeck. The page shows tokens (input + output) and cost broken down by model, by provider, and over time. Numbers are scoped to your workspace and update on every successful data-plane response.
From 1.8.5 the page also shows how many input tokens were cached reads and cache writes, and how many output tokens were reasoning. Each part is inside its input or output total, so no total changes. The parts cover only calls since your install moved to 1.8.4; older calls count as zero.
The display value is in your workspace's billing currency. DVARA attributes the underlying usage and cost records to an opaque API-key ID, but the workspace Usage page page shows only workspace totals and model breakdowns. Ask an operator to use the Token Usage tab of Cost → Cost Dashboard when you need the per-request key name and public prefix. The bearer credential is not stored with the telemetry.
When the gateway-connected indicator is red, the latest data is stale. Refresh the page after the indicator turns green again.
Search the audit log
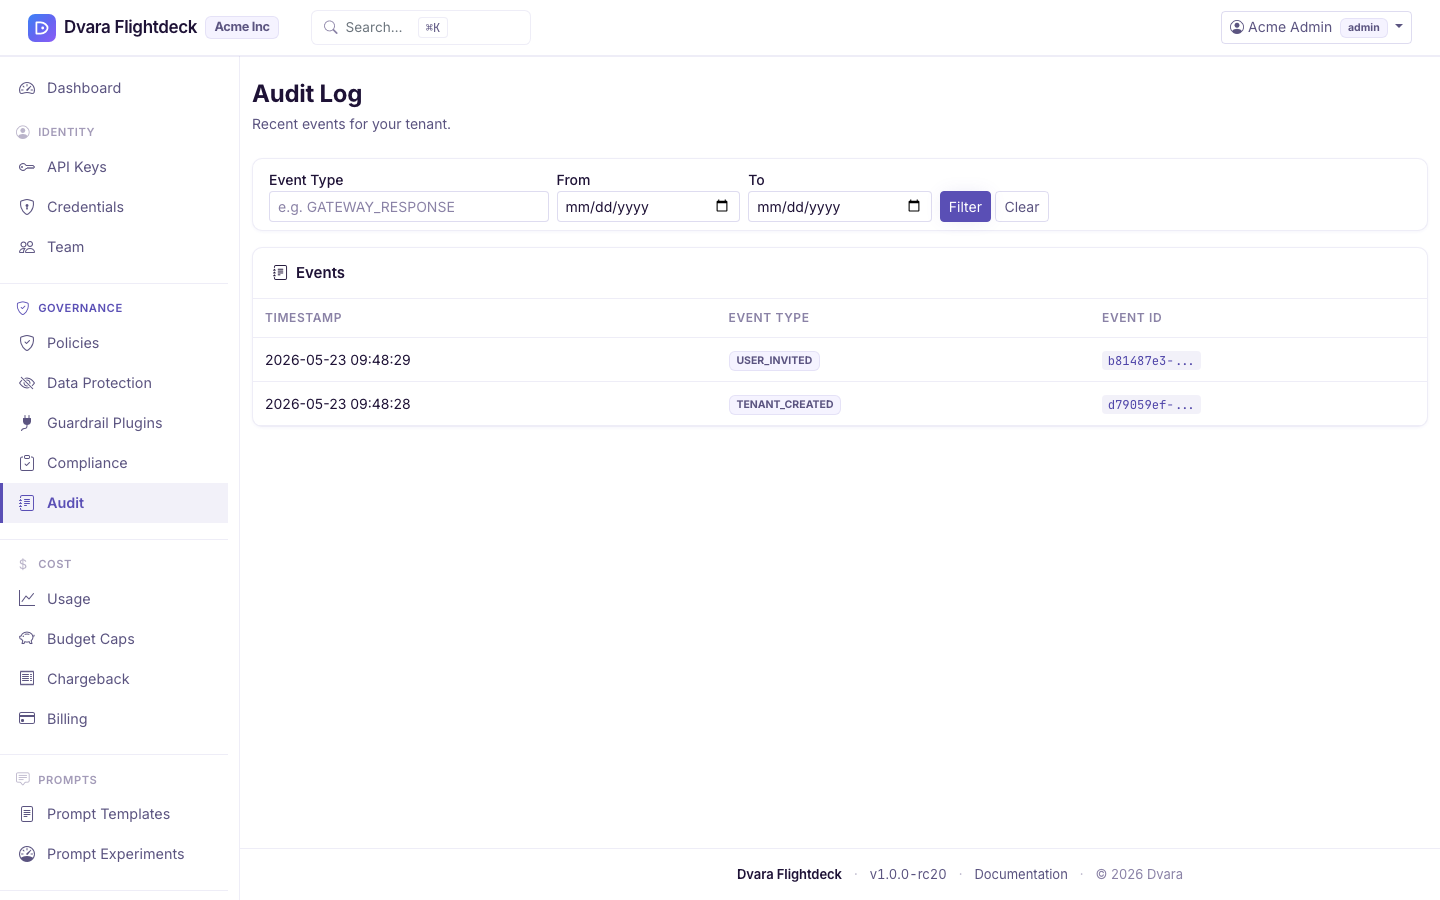
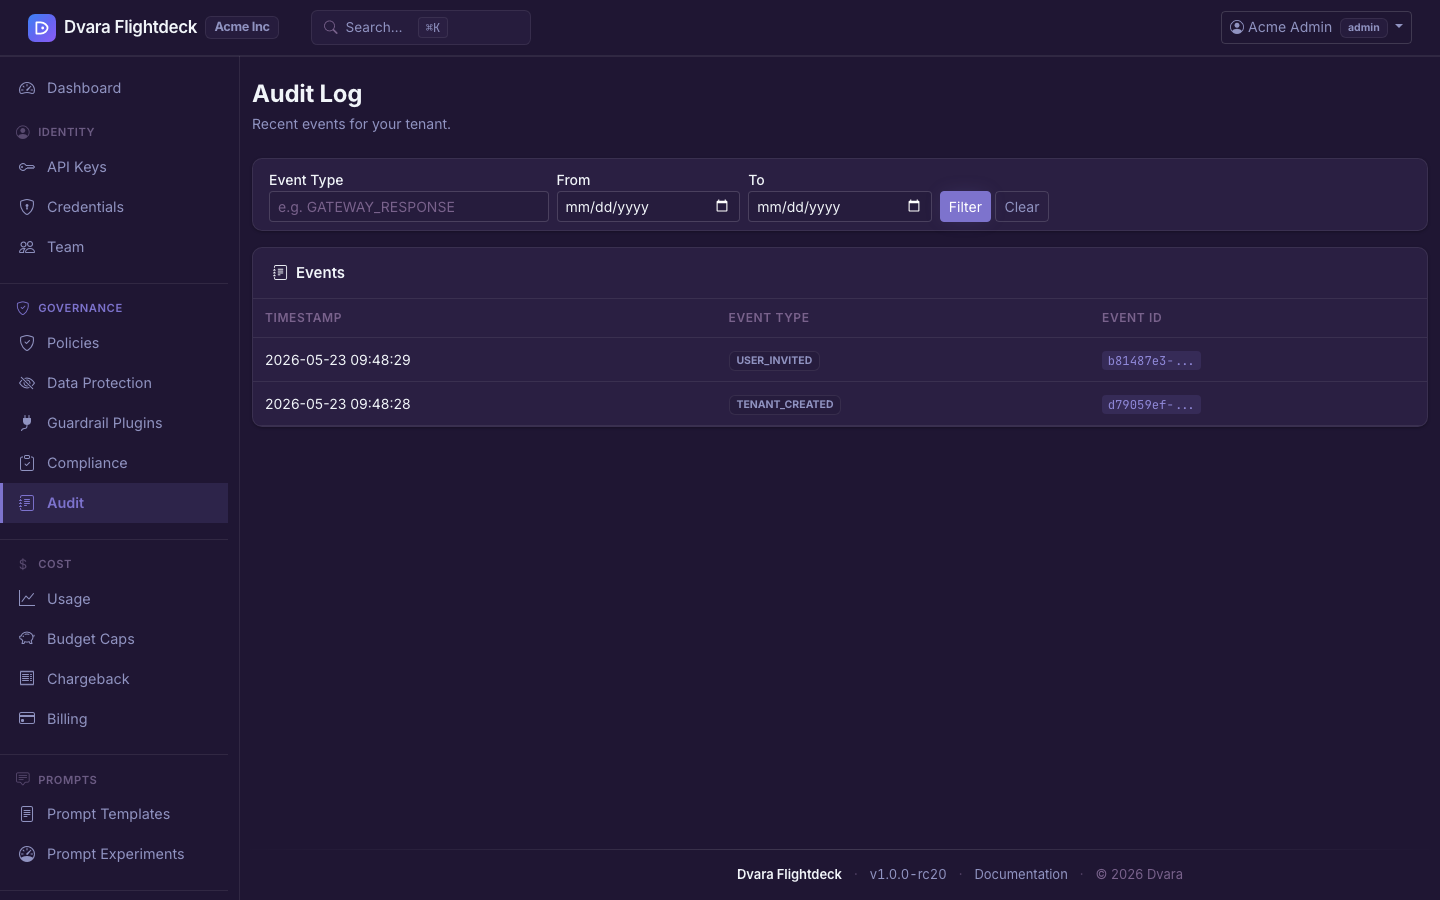
Open Audit in Flightdeck. Filter by:
- Event type — pick from a dropdown of every event DVARA emits. Each task page lists the events its actions emit; the dropdown covers the full catalog.
- Date range — any window. The audit store keeps events on the retention schedule your operator has configured (typically 90 days for prompt-bearing events, longer for structural ones).
Click a row to expand the full event payload. Common starting points:
POLICY_DENIED— what your active policies have rejectedBUDGET_CAP_HARD— requests rejected for crossing a hard budget capGUARDRAIL_BLOCKED— guardrail violations the data plane stoppedPII_DETECTED/PII_REDACTED/PII_TOKENIZED/PII_OUTPUT_LEAK— PII findings and actionsPROVIDER_CREDENTIAL_ROTATED— credential rotations (carries lineage to the previous credential)WORKSPACE_PII_CONFIG_UPDATED/WORKSPACE_GUARDRAIL_CONFIG_UPDATED— every change you make on the data protection page lands here
Gateway request events carry the same opaque API-key ID as usage, cost, and
per-key budget records. A request without an authenticated key carries
anonymous; the plaintext key is never copied into the audit payload.
The audit store is append-only through Flightdeck and the API — neither surface exposes an update or delete path for audit events. Every row is signed and chained; tampering with the trail breaks the chain on the next verification pass.
What the "gateway connected" indicator means here
Two different stores back this page, and they are independent of each other:
- The audit log is available through Flightdeck. It does not depend on the data plane. Even when the indicator is red, workspace configuration changes still produce audit events, and search continues to return them.
- Usage and cost are produced by the data plane. When the indicator is red, the data plane is not posting new usage rows, so the numbers freeze. They catch up automatically when the indicator turns green again.
Generate a SOC2, HIPAA, GDPR, RBI, or SEBI report
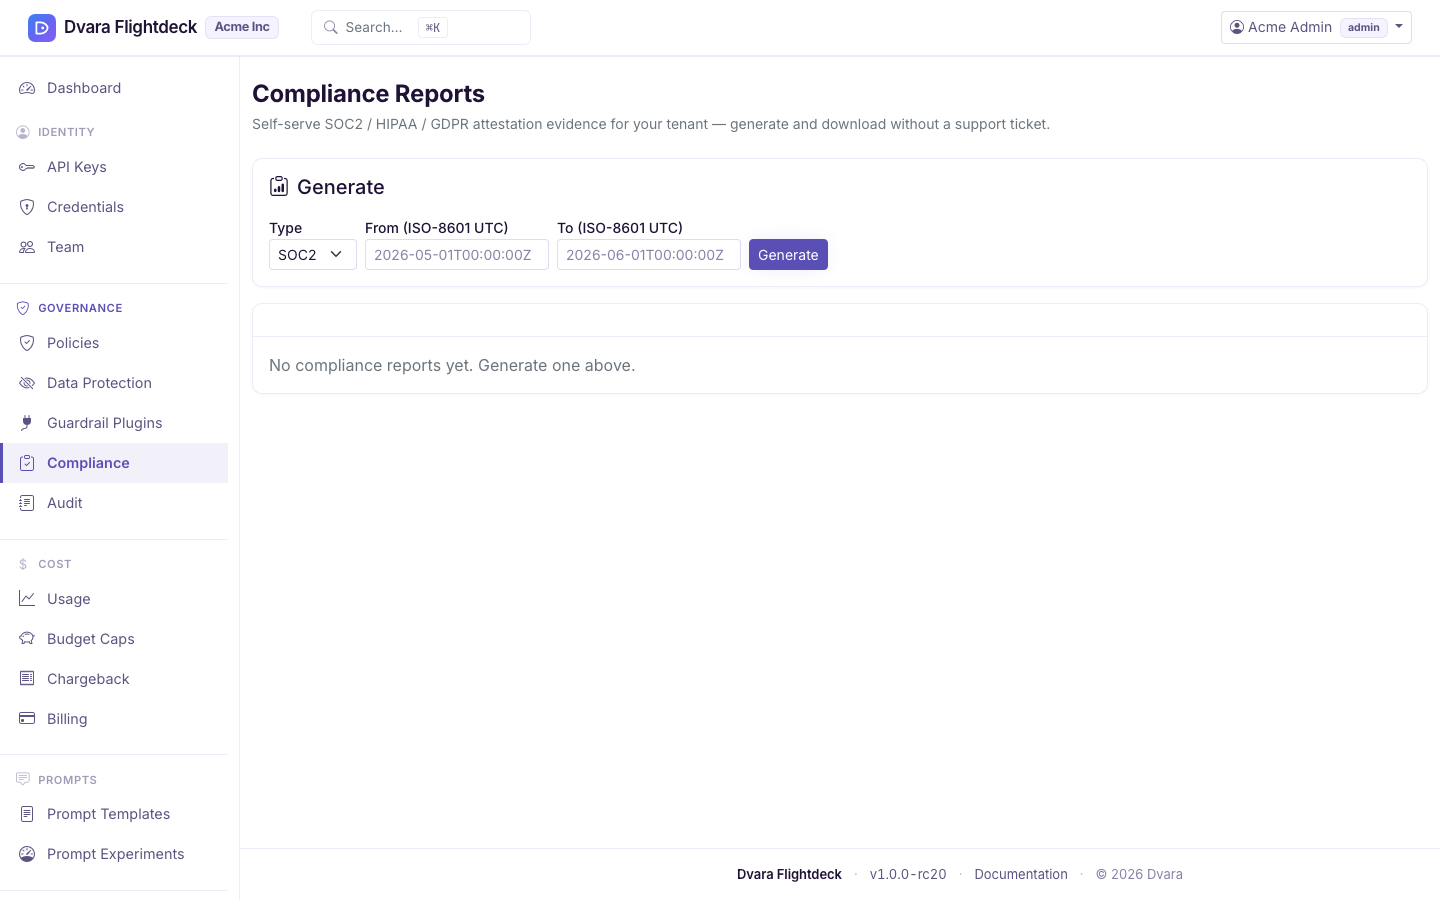
Open Compliance → Generate in Flightdeck. Pick:
- The report type —
SOC2,HIPAA,GDPR, or IndiaRBI/SEBI. - The date range — typically the previous calendar quarter for SOC2, the relevant window for an incident-driven HIPAA review, or an arbitrary range for GDPR data-subject requests. The India
RBI/SEBIreports aggregate data-localization (residency), tamper-evident audit-chain integrity, access control, and policy enforcement over the window.
The report aggregates the audit trail and configuration state for your workspace into a formatted PDF. It pulls from your workspace's audit events, your policies, your workspace settings, and the integrity verification of the audit chain itself for that window.
The PDF is generated server-side and stored alongside the metadata. It is a point-in-time snapshot — once generated, the numbers cannot drift.
Download or delete a past report
Every generated report has a PDF download and a status. A completed report
is available for 30 days after generation, then its download returns an expired
result. Download the evidence you need before that date. An admin can delete
a report earlier.
What every action writes to the audit trail
| Action | Audit event |
|---|---|
| Generate a compliance report | COMPLIANCE_REPORT_GENERATED (carries report_type) |
| Delete a compliance report | COMPLIANCE_REPORT_DELETED |
Browsing usage and searching the audit log are read-only and not audited. PDF and CSV report downloads are also not audited — the generation event is the audited record.
Next steps
- Pair compliance with PII posture
- Tie spend to compliance with chargeback reports
- Audit every action your team takes