See what governed AI traffic costs, and who incurred it. Then put a budget in front of it.
DVARA prices each completed model call from the usage the provider reported and the rates you set, records it against the tenant and key that made it, and checks every applicable budget before the next one goes out. It is DVARA's own estimate of your spend, not a copy of your provider's invoice.
A read-only spend estimate runs keyless; budgets, forecasts and reports are licensed.
Why is LLM spend so hard to control?
Provider dashboards meter their product, not your org chart. Engineering cannot see cost per workload, finance cannot project, and a runaway agent loop or a bad prompt template arrives a month later as a number with nobody's name on it. Pricing each call as it completes puts a tenant and a key on the spend while it is still the current period — which is early enough to act on, and is a different thing from a reconciled bill.
Which calls produce a cost record, and what is on it?
Not all of them, and the exceptions matter more than the rule. A call is priced when the provider reported usage and a rate matches the model — otherwise there is no record at all, which is not the same as a zero.
A completed model call is priced from the token counts the provider returned, using the rate you configured for that model. This is the path the dollar figures come from.
Two cases produce no cost record at all rather than a zero: the provider returned no usable token counts, and no pricing row matches the model. An unpriced model does not show up as free — it does not show up.
MCP tool calls and A2A hops are metered per call and per hop, and they appear in their own records. They do not carry a provider token cost, so do not expect them in the dollar ledger.
The tenant, the API key, the model, the provider, input and output tokens, input and output cost, the total, the rate it was priced against, and the timestamp. Amounts are in USD.
An application can attach tags in the request metadata and they are stored on the record and roll up in reports. They are declared by the caller and not validated, so treat them as a label the calling code chose rather than an attribution the platform verified.
Where an upstream did not return exact counts, the per-request token view marks the row as estimated — so a number you are about to bill against can be checked rather than assumed.
Where do the dollar figures come from?
From a rate table you own and arithmetic you can check. That is the strength and the caveat — nothing is looked up from a provider, so the numbers are only as current as the rates you entered.
Each entry carries a model pattern, an optional provider scope, an input price and an output price per million tokens, and an effective date. Rates are yours to set, which also means they are yours to keep current.
An exact model match wins; failing that, a glob pattern match. A provider scope narrows an entry to that provider. No match means the call is not priced.
Input tokens times the input rate, plus output tokens times the output rate, per million. That is the whole calculation — there is no markup, no conversion, and no reconciliation step.
This is DVARA’s own record of what your traffic should cost at the rates you entered. Your provider bills you directly under your own key. Expect the two to be close and to differ — reconciling them is finance’s job, not the gateway’s.
How does a call turn into a line in a report?
Enforcement comes first and pricing comes last, which is the reverse of how it reads. A budget is checked before the call goes out; what it cost is not known until the provider answers.
- 1
The call is evaluated against budget
Before the provider is called, every applicable cap is checked against the current spend counter. A hard breach refuses the call with a 402; a per-call ceiling, if you set one, refuses a single expensive request here too.
- 2
The provider returns usage
Pricing needs the token counts the provider reports. Nothing is priced on the way out — the cost of a call is not known until it finishes.
- 3
A rate is resolved
The model is matched against your rate table, exactly first and then by pattern. No matching rate means no cost record for that call.
- 4
The record is written and attributed
Tokens are multiplied by the rates, and the record is stamped with the tenant, API key, model, provider, and whatever tags the caller sent. This is the ledger everything else reads.
- 5
Counters and dashboards update
The spend counter that budgets read is incremented, and the dashboards refresh on their own short interval. Period-to-date figures move as responses land rather than on a schedule.
- 6
Reports are generated from the ledger
A chargeback report for a date range assembles tenant, API key, model and provider summaries, a daily breakdown, and the forecast and anomaly sections, as PDF or CSV.
What can a budget actually do?
Warn, refuse, or move traffic to something cheaper — at three scopes, with the tightest winning. The section worth reading closely is what a hard cap does and does not promise under load.
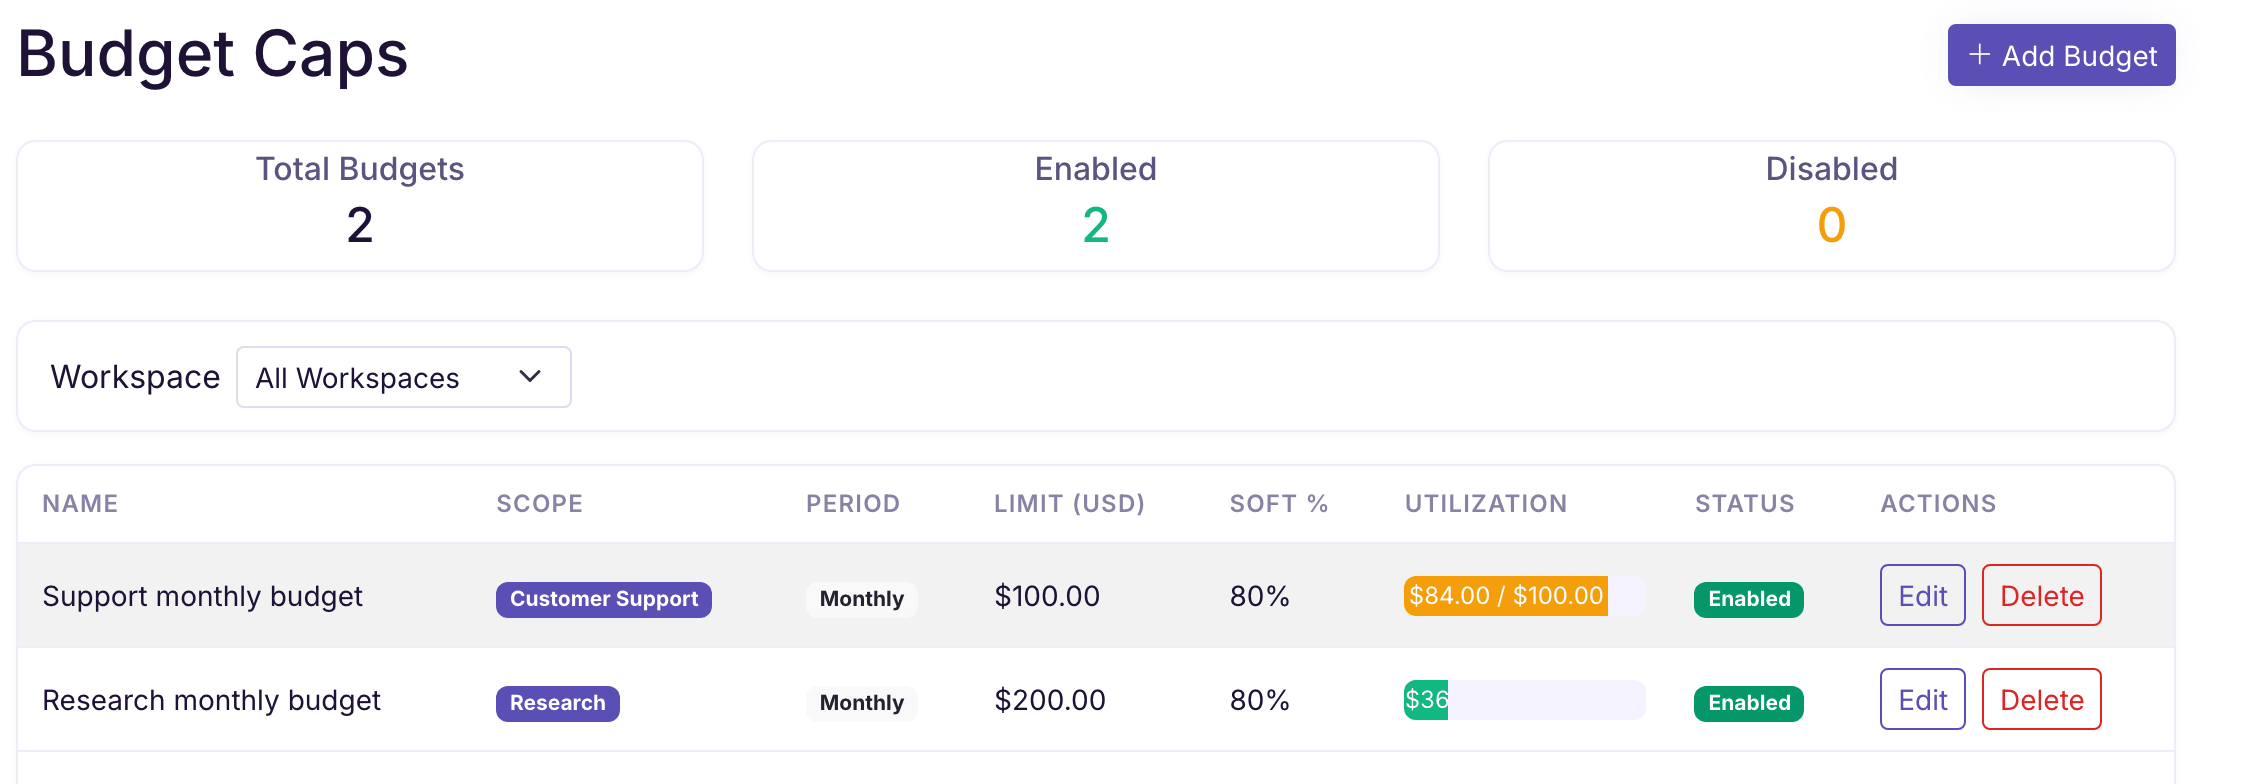
A fleet-wide cap across all tenants, a cap on one tenant, and a cap on one API key can all apply at once. Every applicable cap is evaluated and the tightest governs.
A soft limit is a percentage of the cap — 80% by default — that raises an alert without blocking. Crossing the hard limit rejects new calls with a 402 until the period resets. Periods are daily, weekly, or monthly.
Enforcement reads a fleet-visible spend counter that is deliberately approximate and fails open rather than blocking traffic when it is unsure. It is a strong control, not a transactional guarantee — concurrent calls can carry spend past a cap before it bites.
Optionally refuse any single request whose worst-case cost exceeds a ceiling, before it reaches the provider. It is off by default, set in configuration, and it only applies when the request declares a token ceiling and the model has a rate — otherwise the call cannot be priced and passes through.
A tenant can set its own caps from the portal, and they must sit at or below the platform ceiling that governs it. Platform caps show as read-only there.
A soft breach can move traffic to a cheaper model rather than failing the request. Cheaper is not equivalent — plan for the capability and quality difference rather than treating it as a free saving.
What can you project, detect, and send on?
Projections from trailing spend, deviations against a recent baseline, and a fixed report for a date range. Each is useful and each has a shape worth knowing before it lands in a finance conversation.
Month-end projections are extrapolated from recent daily spend per model, with a trend indicator. They need about a week of history before they appear, and they assume next week looks like last week — a workload change invalidates them.
A tenant and model whose daily rate deviates from its recent baseline by more than your threshold is listed, with the deviation and when it was detected. The threshold is set globally and overridable per tenant, and this also needs about a week of history.
Generated per tenant and date range as PDF or CSV, with tenant, API key, model and provider summaries plus a daily breakdown. Once generated the figures are fixed, so a report you sent last month still says what it said.
Identifiers, token counts, amounts, and caller-supplied tags. Prompt and response text is not part of a cost record — the per-request token view carries counts, not content.
Where do you see the spend?
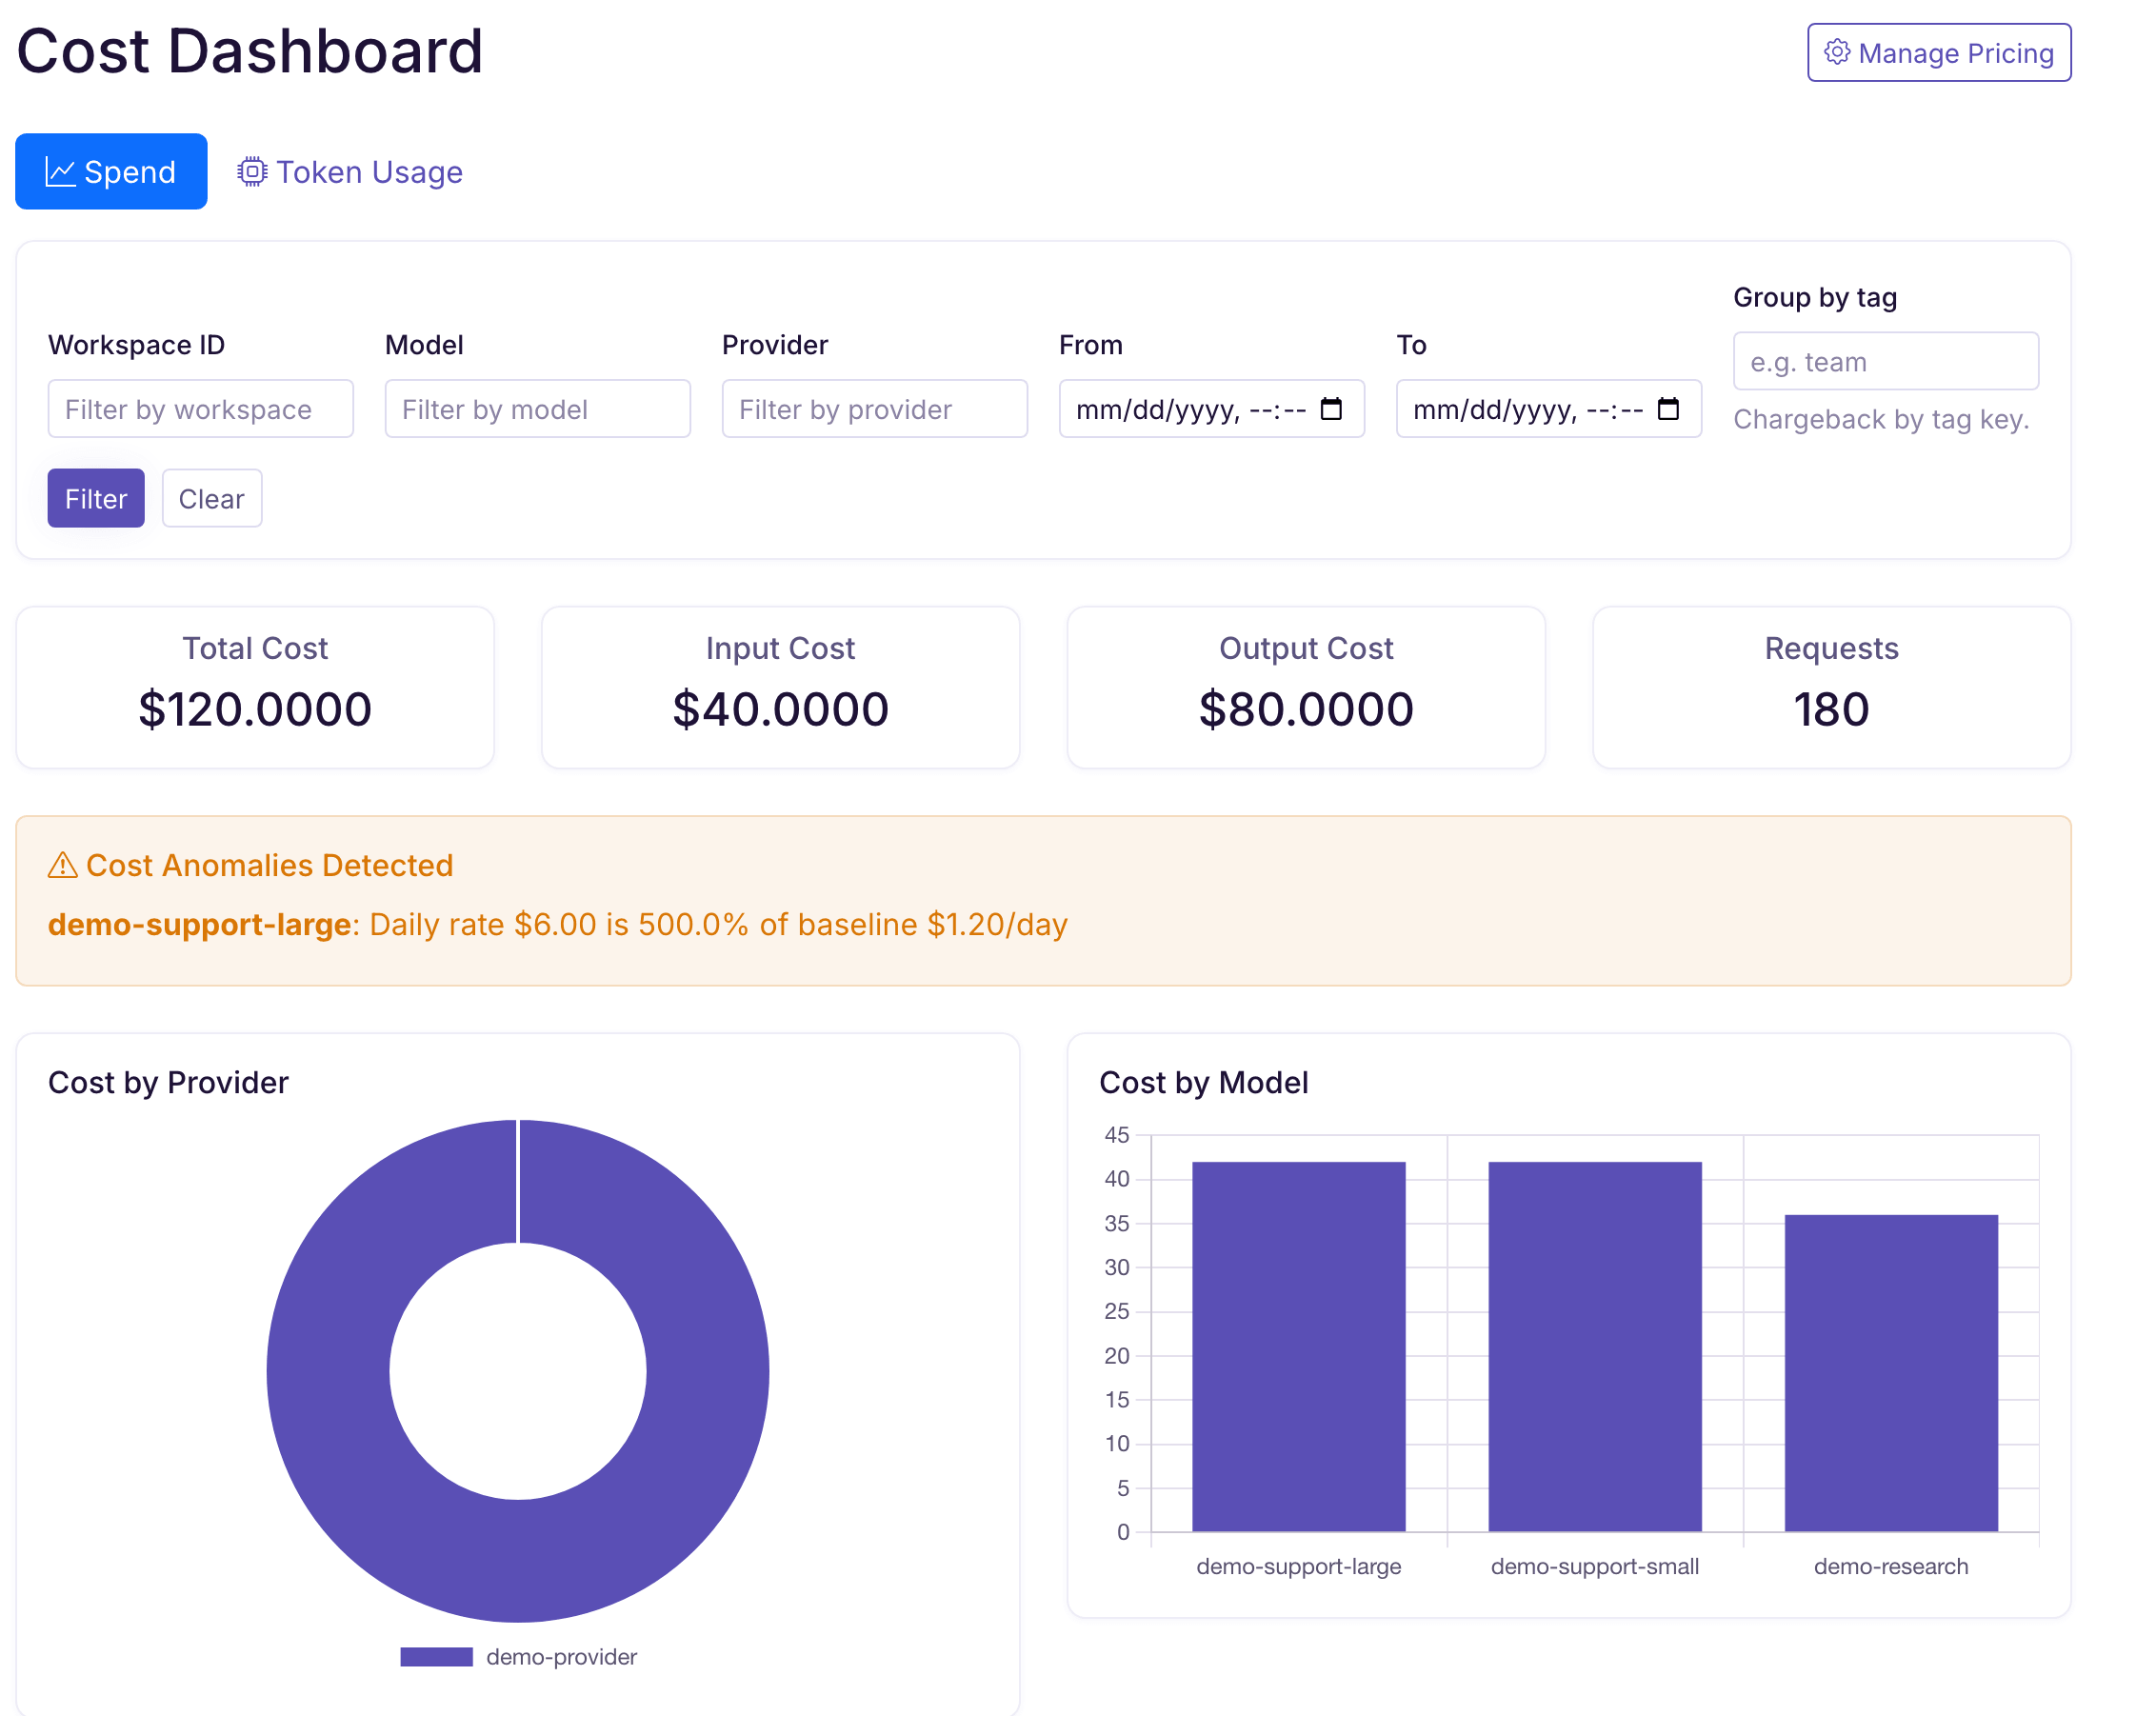
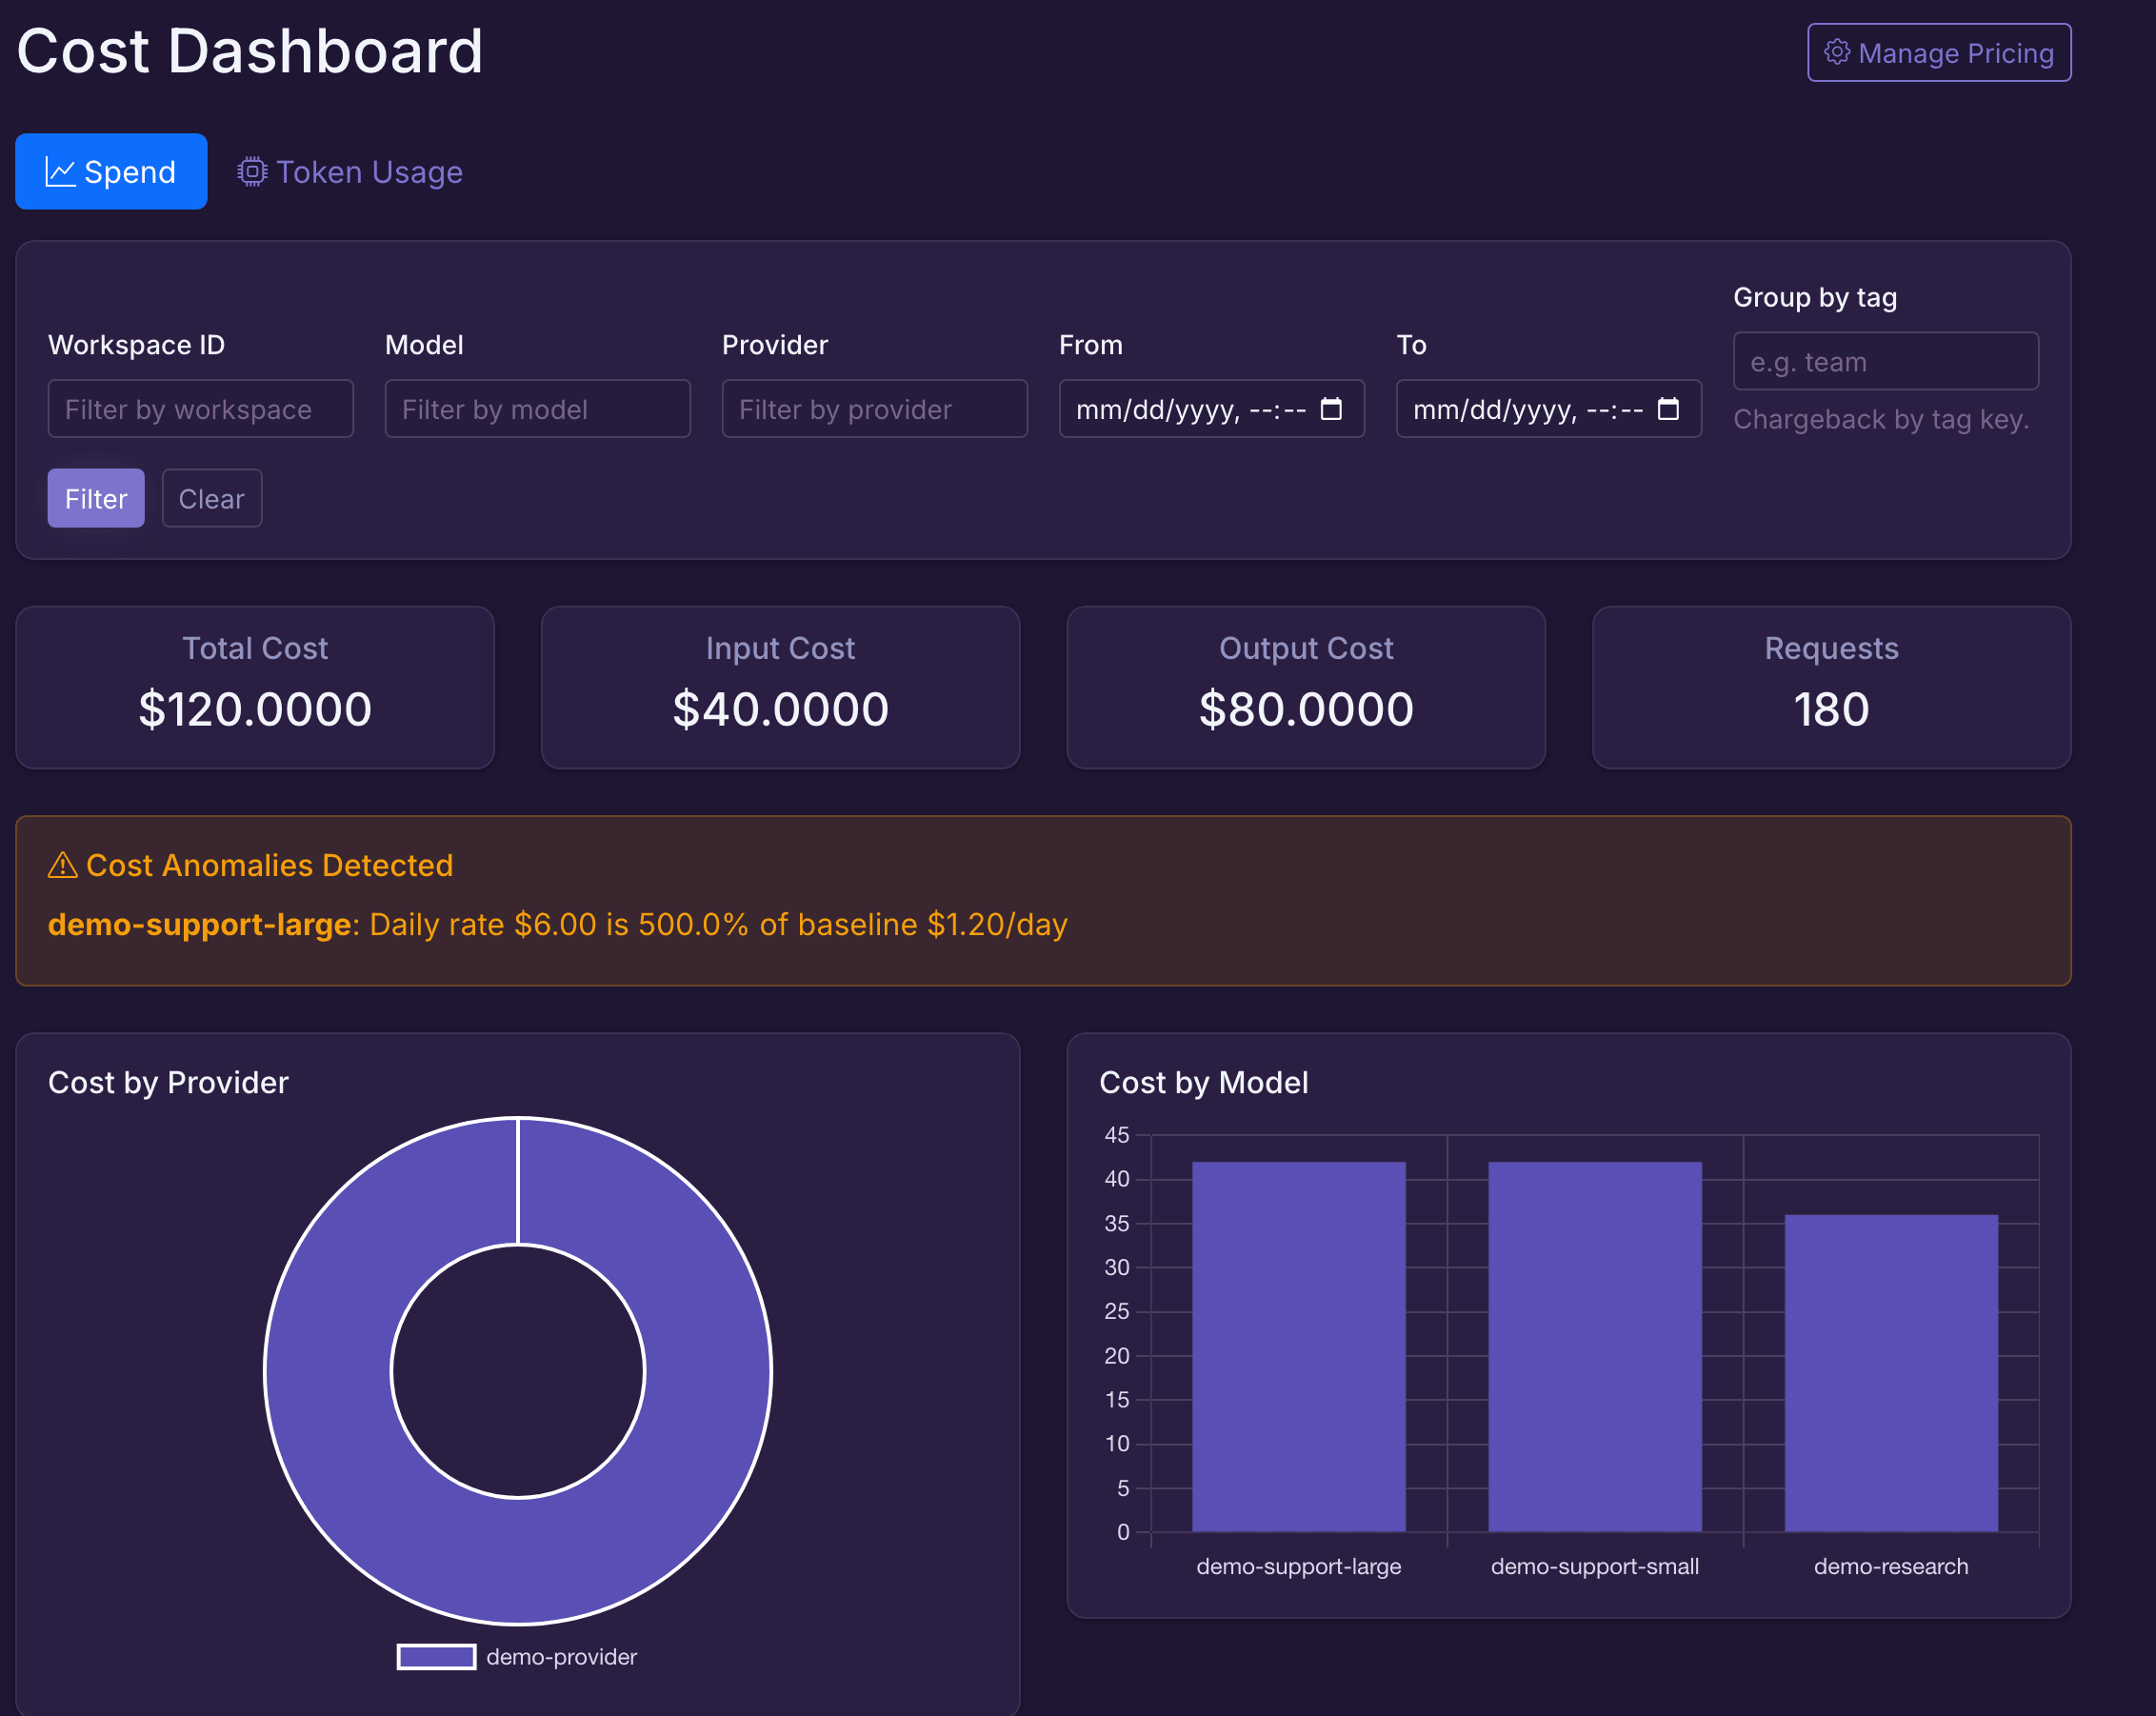
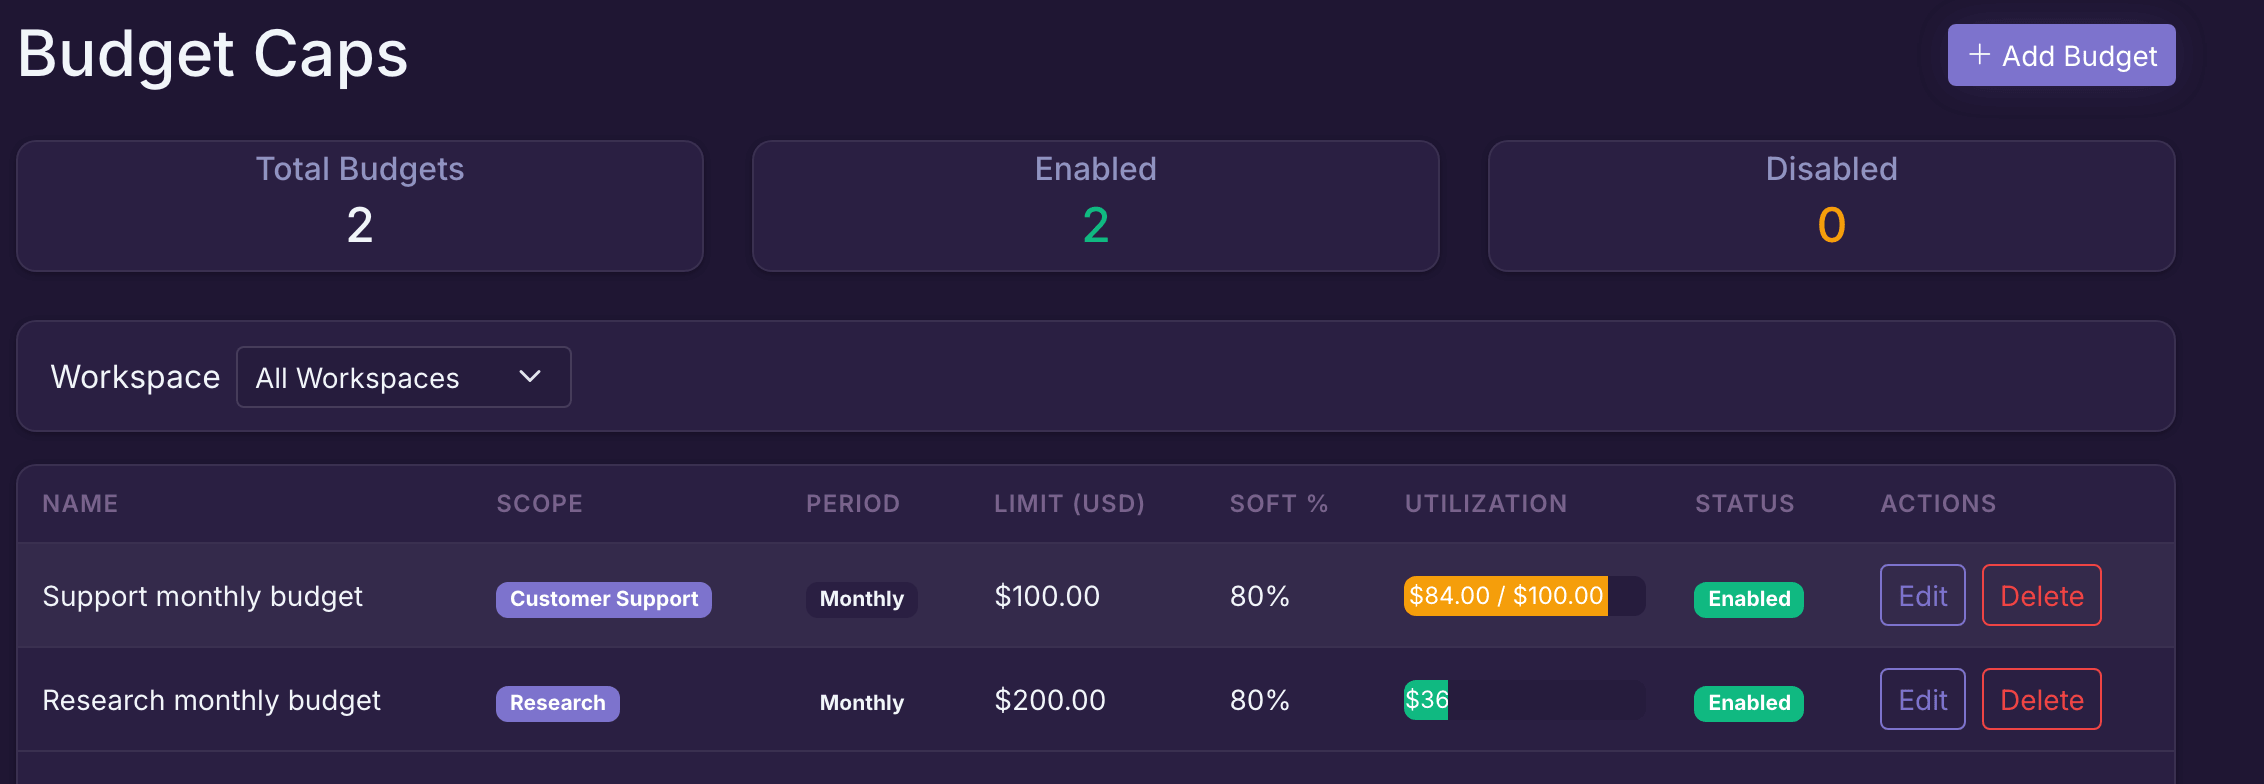
In DVARA Flightdeck. Totals, a breakdown by provider and by model, the status of every active budget, and the underlying records — with filters for tenant, model, provider, and date range.


How does DVARA compare on cost attribution?
Against the three alternatives that score strongest on FinOps in the matrix behind how DVARA compares — chosen by score, not by how weak they are. Each row is checkable against that product's own public documentation.
| Capability | DVARA | Portkey | Helicone | TrueFoundry |
|---|---|---|---|---|
| Real-time cost per request (USD) | ✓ | ✓ | ✓ | ✓ |
| Budget caps (soft + hard) per tenant | ✓ | ∼ | ∼ | ∼ |
| Auto model downgrade on budget threshold | ✓ | — | — | — |
| Chargeback reports per tenant/team | ✓ | ∼ | ∼ | ∼ |
| Pricing model | Licensed, sized by request volume — no hard stop on overage | Subscription from $49/mo + per-request overage (source) | Free tier, then $79/mo + usage overage; OSS self-host (source) | Free tier, then $499/mo tiers + usage overage (source) |
Capabilities last verified June 2026; pricing models August 2026. A stale mark is worse than no claim — every row is checkable against each product's own public documentation. For the full matrix across ten alternatives, see how DVARA compares.
What do you need to run this?
The line is between seeing spend and acting on it. Visibility runs keyless; capping, projecting and exporting do not. See what a licence covers.
A read-only per-model spend estimate. You can see what your traffic costs; you cannot cap it, project it, or export it.
Budget caps at every scope, the per-call ceiling, model downgrade on a soft breach, forecasts, anomaly detection, and chargeback reports as PDF or CSV.
You pay your providers directly under your own keys — DVARA does not resell tokens, and metering here exists for attribution and enforcement. A DVARA licence is sized by request volume and is a separate line from your provider spend.
Common questions about AI cost attribution
How is the cost of a call calculated?
Input tokens times your configured input rate plus output tokens times your output rate, per million, in USD. The token counts come from what the provider reported, and the rates come from a table you maintain — an exact model match first, then a glob pattern, optionally scoped to a provider. There is no markup and no conversion step.
Is this an estimate or a bill?
An estimate, and the distinction matters. It is DVARA’s own record of what your traffic should cost at the rates you entered. Your provider bills you directly under your own key. Expect the two to be close and to differ, and treat reconciliation as finance’s job rather than something the gateway does.
When is a call priced?
At completion, because pricing needs the usage the provider reports — the cost of a call is not known while it is in flight. Budget enforcement runs before the call instead, against the running spend counter.
What happens when a model has no rate, or usage is missing?
No cost record is written for that call. This is worth planning around: an unpriced model does not appear as free, it does not appear at all. Adding a rate for every model you route to is what keeps the ledger complete.
Which traffic produces a dollar cost?
Model calls. MCP tool calls and A2A hops are metered per call and per hop in their own records, but they have no provider token cost, so they are not in the dollar ledger. If you need the total cost of an agent workflow, the model turns are the priced part.
How does attribution by team or feature work?
Records always carry the tenant, API key, model and provider. Beyond that, an application can attach tags in the request metadata — team, feature, environment, whatever you choose — and those roll up in reports. They are declared by the calling application and not validated, so a tag is a label the caller chose. If the number is going into a chargeback, the tenant and API key are the dimensions the platform can vouch for.
Do budget caps actually stop spend?
A hard cap rejects new calls with HTTP 402 until the period resets, and every applicable cap — fleet-wide, tenant, API key — is evaluated with the tightest winning. Be precise about the guarantee though: enforcement reads a spend counter that is deliberately approximate and fails open rather than blocking traffic when it is unsure, so concurrent calls can carry spend a little past a cap before it bites. It is a strong control, not a transactional limit.
What happens as a tenant approaches its cap?
Crossing the soft limit — 80% of the cap by default — raises an alert without blocking, and that event can drive a webhook. You can also have a soft breach move traffic to a cheaper model rather than fail the request. A cheaper model is not an equivalent one, so treat that as a deliberate trade rather than a free saving.
How do forecasts and anomaly detection work?
Forecasts extrapolate month-end spend from recent daily spend per model, with a trend indicator. Anomalies flag a tenant and model whose daily rate deviates from its recent baseline by more than your threshold, which is set globally and overridable per tenant. Both need roughly a week of trailing data before they produce anything, and a forecast assumes the coming period resembles the last one — a workload change invalidates it.
What can finance actually be sent?
A cost allocation report for a tenant and date range, as PDF or CSV, with tenant, API key, model and provider summaries, a daily breakdown, and the forecast and anomaly sections. Once generated the numbers are fixed, so a report you sent last month still says what it said. It is built from DVARA’s estimate, not from a provider invoice.
Does metering here mean paying twice?
No. You pay providers directly under your own keys and DVARA does not resell tokens — metering exists so spend can be attributed and enforced. A DVARA licence is sized by request volume and is a separate line from your provider spend.
Which edition includes which capability?
Without a licence key you get a read-only per-model spend estimate — you can see what traffic costs but not cap, project, or export it. Budget caps at every scope, the per-call ceiling, model downgrade, forecasts, anomaly detection and chargeback reports are licensed.
Start with a rate table and one soft cap.
Rates make the ledger complete, and a soft cap tells you a workload is heading somewhere before it gets there. Both are cheaper decisions than the report that explains it afterwards.